
Phoenix Education Partners (PXED)
Market Price (10/12/2026): $24.97 | Market Cap: $896.0 MilSector: Consumer Discretionary | Industry: Education Services
Phoenix Education Partners (PXED)
Market Price (10/12/2026): $24.97Market Cap: $896.0 MilSector: Consumer DiscretionaryIndustry: Education Services
Investment Highlights Why It Matters Detailed financial logic regarding cash flow yields vs trend-riding momentum.
Attractive yieldTotal YieldTotal Yield = Earnings Yield + Dividend Yield, Earnings Yield = Net Income / Market Cap Dividend Yield = Total Dividends / Market Cap is 11%, ERPEquity Risk Premium (ERP) = Total Yield - Risk Free Rate, Reflects the premium above risk free assets offered by the investment. is 7.0%, FCF Yield is 14% Cash is significant % of market capNet D/ENet Debt/Equity. Debt net of cash. Negative indicates net cash. Equity is taken as the Market Capitalization is -18% Attractive cash flow generationCFO/Rev LTMCash Flow from Operations / Revenue (Sales), Last Twelve Months (LTM) is 15%, FCF/Rev LTMFree Cash Flow / Revenue (Sales), Last Twelve Months (LTM) is 13% Low stock price volatilityVol 12M is 50% Megatrend and thematic driversMegatrends include Digital Education & Lifelong Learning. Themes include Online Learning Platforms, Education Technology Solutions, and Workforce Development & Upskilling. | Weak multi-year price returns2Y Excs Rtn is -66%, 3Y Excs Rtn is -114% | Key risksPXED key risks include [1] its history of significant regulatory sanctions and high dependence on federal funding, Show more. |
| Attractive yieldTotal YieldTotal Yield = Earnings Yield + Dividend Yield, Earnings Yield = Net Income / Market Cap Dividend Yield = Total Dividends / Market Cap is 11%, ERPEquity Risk Premium (ERP) = Total Yield - Risk Free Rate, Reflects the premium above risk free assets offered by the investment. is 7.0%, FCF Yield is 14% |
| Cash is significant % of market capNet D/ENet Debt/Equity. Debt net of cash. Negative indicates net cash. Equity is taken as the Market Capitalization is -18% |
| Attractive cash flow generationCFO/Rev LTMCash Flow from Operations / Revenue (Sales), Last Twelve Months (LTM) is 15%, FCF/Rev LTMFree Cash Flow / Revenue (Sales), Last Twelve Months (LTM) is 13% |
| Low stock price volatilityVol 12M is 50% |
| Megatrend and thematic driversMegatrends include Digital Education & Lifelong Learning. Themes include Online Learning Platforms, Education Technology Solutions, and Workforce Development & Upskilling. |
| Weak multi-year price returns2Y Excs Rtn is -66%, 3Y Excs Rtn is -114% |
| Key risksPXED key risks include [1] its history of significant regulatory sanctions and high dependence on federal funding, Show more. |
Qualitative Assessment
AI Analysis | Feedback
Phoenix Education Partners (PXED) stock has lost about 20% since 6/30/2026 because of the following key factors:
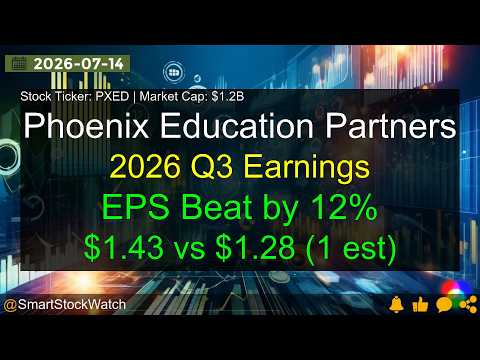
1. Phoenix Education Partners reported a significant earnings miss for its fiscal Q3 2026, which ended May 31, 2026. The company announced an adjusted EPS of $1.43, falling short of analyst forecasts of $1.57 by 8.9%. Despite revenue remaining flat at $271.8 million, this miss, coupled with a lowered fiscal year 2026 revenue guidance to $1.02-1.025 billion, led to an immediate negative market reaction. Following the announcement on July 14, 2026, PXED shares experienced a substantial decline, with after-hours trading seeing drops of 8.3% to $31.70 and 9.5% to $31.30, and a 12.8% loss by market close on July 15, 2026.
2. Profitability was negatively impacted by increased operating expenses and margin compression during fiscal Q3 2026. The company's adjusted EBITDA declined by 6.4% to $78.1 million. This margin compression was primarily driven by higher marketing expenditures and strategic investments related to artificial intelligence (AI). Furthermore, net income attributable to Phoenix Education Partners decreased by 27.3% to $39.2 million, largely due to elevated non-cash share-based compensation expenses from its initial public offering (IPO), increased advertising costs, and higher strategic alternatives and restructuring expenses.
Show more
Phoenix Education Partners (PXED) stock has lost about 20% since 6/30/2026 because of the following key factors:
1. Phoenix Education Partners reported a significant earnings miss for its fiscal Q3 2026, which ended May 31, 2026. The company announced an adjusted EPS of $1.43, falling short of analyst forecasts of $1.57 by 8.9%. Despite revenue remaining flat at $271.8 million, this miss, coupled with a lowered fiscal year 2026 revenue guidance to $1.02-1.025 billion, led to an immediate negative market reaction. Following the announcement on July 14, 2026, PXED shares experienced a substantial decline, with after-hours trading seeing drops of 8.3% to $31.70 and 9.5% to $31.30, and a 12.8% loss by market close on July 15, 2026.
2. Profitability was negatively impacted by increased operating expenses and margin compression during fiscal Q3 2026. The company's adjusted EBITDA declined by 6.4% to $78.1 million. This margin compression was primarily driven by higher marketing expenditures and strategic investments related to artificial intelligence (AI). Furthermore, net income attributable to Phoenix Education Partners decreased by 27.3% to $39.2 million, largely due to elevated non-cash share-based compensation expenses from its initial public offering (IPO), increased advertising costs, and higher strategic alternatives and restructuring expenses.
3. The evolving landscape of AI-powered student search behavior introduced uncertainty regarding future student acquisition. Management indicated that the earnings pressure and revised outlook were influenced by changing AI-driven student search behaviors, which are creating longer student evaluation cycles. This suggests a broader, company-specific challenge in adapting recruitment strategies to new technological paradigms, contributing to a cautious outlook despite management asserting that fundamental demand was not weakening.
Show less
Stock Movement Drivers
Fundamental Drivers
The -20.3% change in PXED stock from 6/30/2026 to 10/11/2026 was primarily driven by a -0.8% change in the company's Shares Outstanding (Mil).| (LTM values as of) | 6302026 | 10112026 | Change |
|---|---|---|---|
| Stock Price ($) | 32.62 | 26.01 | -20.3% |
| Change Contribution By: | |||
| Total Revenues ($ Mil) | � | 1,014 | 0.0% |
| Net Income Margin (%) | � | 8.2% | 0.0% |
| P/E Multiple | � | 11.3 | 0.0% |
| Shares Outstanding (Mil) | 36 | 36 | -0.8% |
| Cumulative Contribution | 0.0% |
Market Drivers
6/30/2026 to 10/11/2026| Return | Correlation | |
|---|---|---|
| PXED | -20.3% | |
| Market (SPY) | 4.3% | 9.1% |
| Sector (XLY) | -3.8% | 14.0% |
Fundamental Drivers
The -16.1% change in PXED stock from 3/31/2026 to 10/11/2026 was primarily driven by a -0.8% change in the company's Shares Outstanding (Mil).| (LTM values as of) | 3312026 | 10112026 | Change |
|---|---|---|---|
| Stock Price ($) | 31.00 | 26.01 | -16.1% |
| Change Contribution By: | |||
| Total Revenues ($ Mil) | � | 1,014 | 0.0% |
| Net Income Margin (%) | � | 8.2% | 0.0% |
| P/E Multiple | � | 11.3 | 0.0% |
| Shares Outstanding (Mil) | 36 | 36 | -0.8% |
| Cumulative Contribution | 0.0% |
Market Drivers
3/31/2026 to 10/11/2026| Return | Correlation | |
|---|---|---|
| PXED | -16.1% | |
| Market (SPY) | 20.0% | 6.4% |
| Sector (XLY) | 3.8% | 13.5% |
Fundamental Drivers
nullnull
Market Drivers
9/30/2025 to 10/11/2026| Return | Correlation | |
|---|---|---|
| PXED | ||
| Market (SPY) | 17.8% | 20.6% |
| Sector (XLY) | -5.3% | 27.0% |
Fundamental Drivers
nullnull
Market Drivers
9/30/2023 to 10/11/2026| Return | Correlation | |
|---|---|---|
| PXED | ||
| Market (SPY) | 88.4% | 20.6% |
| Sector (XLY) | 43.4% | 27.0% |
Price Returns Compared
| 2021 | 2022 | 2023 | 2024 | 2025 | 2026 | Total [1] | |
|---|---|---|---|---|---|---|---|
| Returns | |||||||
| PXED Return | - | - | - | - | -21% | -12% | -30% |
| Peers Return | -2% | -23% | 56% | 33% | 1% | -5% | 49% |
| S&P 500 Return | 27% | -19% | 24% | 23% | 16% | 13% | 107% |
Monthly Win Rates [3] | |||||||
| PXED Win Rate | - | - | - | - | 0% | 60% | |
| Peers Win Rate | 45% | 45% | 55% | 55% | 52% | 60% | |
| S&P 500 Win Rate | 75% | 42% | 67% | 75% | 67% | 50% | |
Max Drawdowns [4] | |||||||
| PXED Max Drawdown | - | - | - | - | - | -29% | |
| Peers Max Drawdown | -28% | -39% | -27% | -30% | -43% | -34% | |
| S&P 500 Max Drawdown | -5% | -25% | -10% | -8% | -19% | -9% | |
[1] Cumulative total returns since the beginning of 2021
[2] Peers: LOPE, SKIL, DUOL, LAUR, GHC.
[3] Win Rate = % of calendar months in which monthly returns were positive
[4] Max drawdown represents maximum peak-to-trough decline within a year
[5] 2026 data is for the year up to 10/9/2026 (YTD)
How Low Can It Go
PXED has limited trading history. Below is the Consumer Discretionary sector ETF (XLY) in its place.
| Event | XLY | S&P 500 |
|---|---|---|
| 2025 US Tariff Shock | ||
| % Loss | -21.8% | -18.8% |
| % Gain to Breakeven | 27.9% | 23.1% |
| Time to Breakeven | 105 days | 79 days |
| 2024 Yen Carry Trade Unwind | ||
| % Loss | -11.2% | -7.8% |
| % Gain to Breakeven | 12.6% | 8.5% |
| Time to Breakeven | 37 days | 18 days |
| Summer-Fall 2023 Five Percent Yield Shock | ||
| % Loss | -13.6% | -9.5% |
| % Gain to Breakeven | 15.8% | 10.5% |
| Time to Breakeven | 42 days | 24 days |
| 2022 Inflation Shock & Fed Tightening | ||
| % Loss | -35.9% | -24.5% |
| % Gain to Breakeven | 56.0% | 32.4% |
| Time to Breakeven | 874 days | 427 days |
| 2020 COVID-19 Crash | ||
| % Loss | -33.9% | -33.7% |
| % Gain to Breakeven | 51.3% | 50.9% |
| Time to Breakeven | 82 days | 140 days |
| Q4 2018 Fed Policy Error / Growth Scare | ||
| % Loss | -19.6% | -19.2% |
| % Gain to Breakeven | 24.4% | 23.8% |
| Time to Breakeven | 98 days | 105 days |
In The Past
State Street Consumer Discretionary Select Sector SPDR ETF's stock fell -21.8% during the 2025 US Tariff Shock. Such a loss loss requires a 27.9% gain to breakeven.
Preserve Wealth
Limiting losses and compounding gains is essential to preserving wealth.
Asset Allocation
Actively managed asset allocation strategies protect wealth. Learn more.
PXED has limited trading history. Below is the Consumer Discretionary sector ETF (XLY) in its place.
| Event | XLY | S&P 500 |
|---|---|---|
| 2025 US Tariff Shock | ||
| % Loss | -21.8% | -18.8% |
| % Gain to Breakeven | 27.9% | 23.1% |
| Time to Breakeven | 105 days | 79 days |
| 2022 Inflation Shock & Fed Tightening | ||
| % Loss | -35.9% | -24.5% |
| % Gain to Breakeven | 56.0% | 32.4% |
| Time to Breakeven | 874 days | 427 days |
| 2020 COVID-19 Crash | ||
| % Loss | -33.9% | -33.7% |
| % Gain to Breakeven | 51.3% | 50.9% |
| Time to Breakeven | 82 days | 140 days |
| 2008-2009 Global Financial Crisis | ||
| % Loss | -51.0% | -53.4% |
| % Gain to Breakeven | 104.3% | 114.4% |
| Time to Breakeven | 372 days | 1085 days |
In The Past
State Street Consumer Discretionary Select Sector SPDR ETF's stock fell -21.8% during the 2025 US Tariff Shock. Such a loss loss requires a 27.9% gain to breakeven.
Preserve Wealth
Limiting losses and compounding gains is essential to preserving wealth.
Asset Allocation
Actively managed asset allocation strategies protect wealth. Learn more.
About Phoenix Education Partners (PXED)
Phoenix Education Partners (PXED) operates the University of Phoenix, a leading online higher education provider focused on serving adult learners. The company's mission is to deliver career-relevant, affordable, and flexible education to help students achieve their professional goals and advance their careers. As a pioneer in online learning, PXED leverages an AI-ready data infrastructure and robust technology solutions to enhance the student experience, improve success, and connect students effectively with employers, adapting to the evolving demands of the modern workforce.
The core of PXED's offerings consists of 72 degree-granting programs, which represented approximately 97% of its net revenue for fiscal year 2024. These programs include Bachelor's, Master's, Associate's, and Doctoral degrees across diverse disciplines such as Business & IT, Health Professions, and Social & Behavioral Sciences. In addition to degrees, PXED offers 33 non-degree certificate programs and professional development courses. The company is also developing new talent solutions for employers, including "Talent Source," a platform for connecting employers with skilled students, and "Skillmore," an AI-powered tool for designing internal skill development pathways for employees.
PXED primarily serves working adult students, with an average age of 37; a significant majority are employed, care for dependents, or are first-generation college students. The company is dedicated to providing tailored education solutions for these adult learners who face unique time constraints and responsibilities. A key growth area for PXED is its business-to-business (B2B) enrollment strategy, through which students access programs via over 2,500 employer relationships. B2B enrollments constituted 30% of the total average degreed enrollment in fiscal year 2024, demonstrating a strong growth trajectory as PXED assists employers in upskilling their workforce and sourcing talent.
AI Analysis | Feedback
Here are 1-3 brief analogies for Phoenix Education Partners (PXED):
- It's the Carvana of accredited degrees for working adults, offering a fully online and career-focused university experience.
- Think of it as LinkedIn Learning for accredited degrees, providing comprehensive online higher education tailored for career advancement and employer partnerships.
- It's like the Amazon of online higher education for working professionals – a vast, digitally-driven platform providing flexible, career-aligned degrees and certificates.
AI Analysis | Feedback
- Degree Programs: Comprehensive online higher education programs leading to Associate's, Bachelor's, Master's, and Doctoral degrees in various disciplines.
- Non-Degree Certificate Programs: Shorter, credit-bearing certificate programs designed to provide students with critical skills for career advancement.
- Professional Development Courses: Non-credit courses offering specialized training and skill development for individuals and employees seeking career growth.
- Talent Source: A talent-sourcing platform that connects employers directly with students whose skill profiles align with specific job postings.
- Skillmore: An AI-powered tool that assists employers by scanning their skill inventory and designing internal development pathways for employees.
AI Analysis | Feedback
Phoenix Education Partners (PXED) primarily serves individual students, with the majority (approximately 70% in fiscal year 2024) of its total degreed enrollment being independent enrollees. While the company also has significant and growing business-to-business (B2B) relationships with over 2,500 employers, the names of these specific customer companies are not provided in the background information.
The company's major categories of individual customers are:
- Working Adults Seeking Career Advancement: This represents the largest segment of their student body, consisting primarily of employed individuals (76% are currently employed) looking to develop knowledge and skills to achieve professional goals and advance their careers. Their education is often pursued to meet the demands of the modern workforce.
- Adult Learners with Significant Life Responsibilities: These students face unique challenges that traditional programs often do not address, including time constraints, work commitments, and caring for dependents (64% care for dependents at home). They are typically older, with an average age of 37 and 95% of new students over the age of 22, and benefit from the University's flexible, asynchronous learning models.
- First-Generation College Students and Minority Groups: A substantial portion of the student body comprises individuals who are the first in their families to attend college (61% are first-generation college students) and those who identify as members of minority groups (62% of students who completed an optional survey). These students are seeking accessible higher education opportunities tailored to their needs.
AI Analysis | Feedback
AI Analysis | Feedback
Christopher M. Lynne, Chief Executive Officer
Christopher M. Lynne has spent over 20 years in higher education, advocating for career-focused education for nontraditional students, and was the first in his immediate family to attend higher education. He joined the University of Phoenix in 2018 as Chief Financial Officer, became President in 2022, and was appointed CEO of Phoenix Education Partners in October 2025. Mr. Lynne led the company's transition to a public company in 2025. During his tenure, he has driven the university's transformation, expanding its focus beyond degrees to include innovative career mobility solutions for students, alumni, and employers. He previously held leadership roles at Northcentral University as COO and CFO, at HotChalk as President and COO, and was the owner of Transcend Education Group. Phoenix Education Partners, the parent company of the University of Phoenix, has received backing from Apollo Global Management and Vistria Group. Mr. Lynne holds a B.S. in Accounting from Purdue University and an MBA from the Booth School of Business at the University of Chicago.
Blair Wilde Westblom, Chief Financial Officer and Treasurer
Blair Wilde Westblom leads the finance, real estate, and facilities functions for Phoenix Education Partners. She has over 21 years of finance leadership experience, including in publicly traded and private companies across various industries such as higher education, biotechnology, investment banking, and REITs. Ms. Westblom joined the University of Phoenix in 2010 as an associate director of finance, progressing through several promotions to become Chief Financial Officer in January 2023. Before joining the University, she served as a senior group controller at Genentech, a Roche subsidiary, where she managed the fiscal operations for its $3 billion biologic oncology business. In conjunction with the company's Initial Public Offering (IPO) in October 2025, Ms. Westblom received a significant equity compensation package.
Raghu Krishnaiah, Chief Operating Officer
Raghu Krishnaiah serves as the Chief Operating Officer of Phoenix Education Partners.
Srini Medi, Chief Legal Officer, Senior Vice President, General Counsel and Secretary
Srini Medi is the Chief Legal Officer, Senior Vice President, General Counsel, and Secretary for Phoenix Education Partners.
John Woods, Ph.D., Chief Academic Officer and Provost
John Woods, Ph.D. is the Chief Academic Officer and Provost at the University of Phoenix. He holds a PhD in higher education administration from Bowling Green State University.
AI Analysis | Feedback
1. Securities Probe and Allegations of Misleading Information: Phoenix Education Partners (PXED) is currently under investigation by law firms, including Rosen Law Firm, for potentially issuing "materially misleading business information" to the market. This ongoing probe, announced in February 2026, could lead to significant legal and financial liabilities, as well as lasting reputational damage for the company, and is expected to place downward pressure on its stock price.
2. Significant Data Breach Incident: In January 2026, a major data breach affecting nearly 3.5 million individuals at the University of Phoenix was reported, with unauthorized access to sensitive information occurring as early as August 2025. This cybersecurity incident highlights deficiencies in data security management and could result in decreased investor confidence, potential legal actions, and further damage to the company's reputation and stock value.
3. Regulatory Scrutiny and Potential Policy Changes: The for-profit education sector, in which Phoenix Education Partners operates, is subject to extensive regulatory requirements and ongoing scrutiny. Risks include potential Department of Education policy changes and a failure to comply with applicable regulations, which could lead to significant monetary liabilities, fines, penalties, and even the loss of access to federal student loans and grants. Such outcomes could have a material adverse effect on the company's business and financial condition.
AI Analysis | Feedback
AI Analysis | Feedback
Phoenix Education Partners (PXED), operating as the University of Phoenix, addresses several key markets within the education and professional development sectors, primarily in the U.S.
The addressable market for their core offering of **online higher education, including degree-granting programs** for adult learners, is significant. The U.S. online education market, which encompasses both academic and corporate online training, is valued at approximately USD 74.8 billion. More specifically, the market for fully online higher education in the U.S. is over USD 20 billion and is experiencing rapid growth. Another estimate places the U.S. e-learning market, which includes K-12, higher education, and corporate training, at over USD 128.37 billion in 2024, with projections to grow to USD 278.27 billion by 2033. The broader U.S. online education market is projected to grow from USD 12.35 billion in 2025 to USD 128.54 billion by 2034, covering academic degrees, professional certifications, and corporate workforce training.
For their **non-degree certificate programs, professional development courses, and talent solutions programs for employers (B2B enrollments)**, the relevant markets include corporate training and professional development in the U.S. The U.S. professional development market is valued at over USD 70 billion. The corporate training market in North America reached approximately USD 62.1 billion in 2024. Other estimates indicate the U.S. corporate training market is poised to grow, with some projections citing it around USD 163.5 billion.
Considering the company's dedicated focus on **adult learners**, the U.S. market for adult education, often referred to as continuing education, was valued at USD 66.91 billion in 2024 and is projected to reach USD 95.98 billion by 2030.
AI Analysis | Feedback
Phoenix Education Partners (PXED) is expected to drive future revenue growth over the next 2-3 years through the following key strategies:
-
Continued Growth in Business-to-Business (B2B) Enrollments: The company identifies B2B enrollments as a "significant opportunity for further growth." This segment has shown robust expansion, with Average Total Degreed Enrollment increasing from 13,300 in fiscal year 2022 to 23,300 in fiscal year 2024, reflecting a 32% compound annual growth rate (CAGR). B2B enrollments now represent 30% of the University’s Average Total Degreed Enrollment.
-
Expansion of Non-Degree Offerings and New Talent Solutions Programs: Phoenix Education Partners considers its non-degree offerings for students and employers a "growing priority." This includes shorter credit-bearing certificates and non-credit professional development courses aimed at career advancement and employee upskilling. Additionally, the company is developing new talent solutions like Talent Source, a talent-sourcing platform, and Skillmore, an AI-powered tool for designing development pathways. These new programs and services are designed to address evolving workforce demands and create new revenue streams.
-
Increased Overall Enrollment of Adult Learners through Tailored Education Solutions: The company is dedicated to adult learners, who represent an attractive and growing sub-segment of the higher education market. Phoenix Education Partners is "constantly evolving the flexible, asynchronous learning models and the robust technology solutions designed to meet their unique needs." This focus on a differentiated value proposition for working adults is evidenced by the increase in Average Total Degreed Enrollment from 78,900 in fiscal year 2024 to 82,700 during the first nine months of fiscal year 2025, indicating continued success in attracting and retaining this demographic.
AI Analysis | Feedback
Share Issuance
- Phoenix Education Partners completed an initial public offering (IPO) on October 10, 2025, by selling 4.25 million shares of common stock at $32.00 per share, raising approximately $136 million.
- The offering included an option for underwriters to purchase an additional 637,500 shares, bringing the total to 4.9 million shares sold.
- The proceeds from the IPO went to certain existing shareholders, primarily Apollo Global Management and The Vistria Group, not to Phoenix Education Partners itself.
Inbound Investments
- Prior to its IPO in 2025, the University of Phoenix, the company's main operating entity, was taken private in a $1.1 billion buyout in 2017 by Apollo Global Management and The Vistria Group.
Capital Expenditures
- Capital expenditures for the fiscal year ended August 31, 2025, totaled $22.5 million.
- For the first quarter of fiscal year 2026 (ended November 30, 2025), capital expenditures amounted to $4.7 million.
- The company's capital spending supports its "asset-light model" and is focused on purpose-built platforms, AI-ready data infrastructure, and technology to enhance the student experience and connectivity.
Peer Outperformance in Education Services
null| Industry | Names | 1Y med | 3Y med | 5Y med | Top 3 by 5Y |
|---|---|---|---|---|---|
| Education Services ← | 14 | -16.2% | 87.5% | 87.8% | CVSA 268% · LINC 246% · PRDO 235% |
| Homebuilding | 18 | -4.0% | 34.3% | 47.5% | GRBK 194% · TOL 146% · PHM 145% |
| Specialty Stores | 7 | 12.8% | 39.1% | 19.3% | ASO 41% · SIG 38% · DKS 34% |
| Hotels, Resorts & Cruise Lines | 21 | 11.5% | 34.6% | 10.0% | RCL 229% · MAR 142% · LIND 134% |
| Home Improvement Retail | 5 | -20.4% | 0.3% | -2.3% | HVT 15% · HD -2% · LOW -2% |
| Automotive Retail | 18 | -12.6% | 5.5% | -10.0% | MUSA 235% · PAG 117% · ORLY 113% |
| Footwear | 9 | 71.9% | 48.9% | -11.6% | WEYS 204% · DECK 47% · SHOO 19% |
| Restaurants | 36 | -8.2% | -7.8% | -16.3% | EAT 290% · CAKE 168% · BH 116% |
| Specialized Consumer Services | 10 | -13.6% | 12.8% | -16.5% | HRB 108% · FTDR 89% · SCI 36% |
| Distributors | 4 | -9.7% | -28.3% | -17.5% | ARMK 118% · GPC 17% · LKQ -52% |
| Home Furnishings | 4 | -2.1% | 28.1% | -17.8% | SGI 47% · LZB -1% · MHK -35% |
| Apparel Retail | 25 | 8.8% | 16.6% | -36.7% | ANF 268% · URBN 176% · TJX 137% |
| Automotive Parts & Equipment | 38 | -5.3% | -13.7% | -39.4% | MOD 1403% · GTX 269% · MLR 72% |
| Computer & Electronics Retail | 3 | 14.0% | 43.1% | -39.6% | BBY 1% · GME -40% · UPBD -61% |
| Household Appliances | 18 | 7.6% | -3.0% | -40.0% | FLXS 209% · HBB 168% · KEQU 155% |
| Leisure Facilities | 12 | 7.3% | -7.5% | -42.2% | JAKK 159% · LTH 135% · OSW 124% |
| Leisure Products | 13 | -20.4% | -21.2% | -42.3% | GOLF 80% · HAS 30% · MAT -12% |
| Broadline Retail | 14 | -1.6% | 18.5% | -47.2% | EBAY 64% · AMZN 62% · OLLI 40% |
| Casinos & Gaming | 20 | -9.5% | -24.2% | -49.4% | MCRI 91% · RRR 11% · BYD 8% |
| Apparel, Accessories & Luxury Goods | 29 | 4.1% | 14.7% | -51.2% | RL 256% · TPR 244% · ELA 193% |
| Consumer Electronics | 11 | -23.5% | -22.7% | -74.1% | AXIL 2620% · GRMN 93% · SONO -45% |
| Other Specialty Retail | 17 | -29.0% | -39.2% | -77.8% | TLF 99% · BBW 93% · WINA 66% |
| Automobile Manufacturers | 8 | -73.1% | -54.7% | -78.6% | GM 46% · TSLA 42% · F 6% |
Latest Trefis Analyses
| Title | Date | |
|---|---|---|
| DASHBOARDS | ||
| Phoenix Education Partners Earnings Notes | 12/16/2025 |
| Title | |
|---|---|
| ARTICLES |
Research & Analysis
Invest in Strategies
Wealth Management
Peer Comparisons
| Peers to compare with: |
Financials
| Median | |
|---|---|
| Name | |
| Mkt Price | 94.97 |
| Mkt Cap | 5.0 |
| Rev LTM | 1,145 |
| Op Inc LTM | 288 |
| FCF LTM | 248 |
| FCF 3Y Avg | 259 |
| CFO LTM | 327 |
| CFO 3Y Avg | 324 |
Growth & Margins
| Median | |
|---|---|
| Name | |
| Rev Chg LTM | 7.0% |
| Rev Chg 3Y Avg | 8.9% |
| Rev Chg Q | 7.1% |
| QoQ Delta Rev Chg LTM | 1.7% |
| Op Inc Chg LTM | 9.4% |
| Op Inc Chg 3Y Avg | 15.0% |
| Op Mgn LTM | 17.1% |
| Op Mgn 3Y Avg | 16.7% |
| QoQ Delta Op Mgn LTM | 0.1% |
| CFO/Rev LTM | 22.3% |
| CFO/Rev 3Y Avg | 22.7% |
| FCF/Rev LTM | 15.7% |
| FCF/Rev 3Y Avg | 18.3% |
Price Behavior
| Market Price | $26.01 | |
| Market Cap ($ Bil) | 0.9 | |
| First Trading Date | 10/09/2025 | |
| Distance from 52W High | -29.4% | |
| 50 Days | 200 Days | |
| DMA Price | $37.16 | $37.31 |
| DMA Trend | down | down |
| Distance from DMA | -30.0% | -30.3% |
| 3M | 1YR | |
| Volatility | 40.2% | 49.5% |
| Downside Capture | 182.48 | 125.94 |
| Upside Capture | 21.14 | 63.96 |
| Correlation (SPY) | 8.9% | 20.5% |
| 1M | 2M | 3M | 6M | 1Y | 3Y | |
|---|---|---|---|---|---|---|
| Beta | 0.79 | 1.05 | 0.40 | 0.25 | -0.16 | -0.32 |
| Up Beta | -2.49 | -0.28 | -0.25 | -0.16 | -0.50 | 0.25 |
| Down Beta | 1.15 | -1.22 | -0.80 | -0.22 | -0.65 | -0.10 |
| Up Capture | 45% | 126% | 21% | 17% | 56% | 5% |
| Bmk +ve Days | 6 | 16 | 27 | 66 | 132 | 424 |
| Stock +ve Days | 7 | 19 | 31 | 61 | 116 | 116 |
| Down Capture | 249% | 248% | 168% | 97% | 121% | 70% |
| Bmk -ve Days | 16 | 26 | 37 | 60 | 120 | 328 |
| Stock -ve Days | 15 | 23 | 33 | 64 | 127 | 127 |
[1] Upside and downside betas calculated using positive and negative benchmark daily returns respectively
Based On 1-Year Data
| Annualized Return | Annualized Volatility | Sharpe Ratio | Correlation with PXED | |
|---|---|---|---|---|
| PXED | -30.4% | 49.7% | -0.57 | - |
| Sector ETF (XLY) | -4.0% | 19.4% | -0.34 | 27.0% |
| Equity (SPY) | 16.7% | 13.0% | 0.91 | 20.6% |
| Gold (GLD) | 3.3% | 29.5% | 0.11 | 5.7% |
| Commodities (DBC) | 45.0% | 20.9% | 1.67 | -9.2% |
| Real Estate (VNQ) | 4.8% | 13.8% | 0.09 | 13.1% |
| Bitcoin (BTCUSD) | -33.2% | 44.2% | -0.79 | 18.9% |
Smart multi-asset allocation framework can stack odds in your favor. Learn How
Based On 5-Year Data
| Annualized Return | Annualized Volatility | Sharpe Ratio | Correlation with PXED | |
|---|---|---|---|---|
| PXED | -7.0% | 49.7% | -0.57 | - |
| Sector ETF (XLY) | 5.4% | 24.1% | 0.18 | 27.0% |
| Equity (SPY) | 13.9% | 17.1% | 0.62 | 20.6% |
| Gold (GLD) | 18.5% | 18.9% | 0.79 | 5.7% |
| Commodities (DBC) | 10.0% | 19.5% | 0.39 | -9.2% |
| Real Estate (VNQ) | 1.3% | 18.8% | -0.04 | 13.1% |
| Bitcoin (BTCUSD) | 11.4% | 52.0% | 0.39 | 18.9% |
Smart multi-asset allocation framework can stack odds in your favor. Learn How
Based On 10-Year Data
| Annualized Return | Annualized Volatility | Sharpe Ratio | Correlation with PXED | |
|---|---|---|---|---|
| PXED | -3.6% | 49.7% | -0.57 | - |
| Sector ETF (XLY) | 12.1% | 22.2% | 0.50 | 27.0% |
| Equity (SPY) | 15.5% | 17.9% | 0.73 | 20.6% |
| Gold (GLD) | 11.8% | 16.4% | 0.59 | 5.7% |
| Commodities (DBC) | 8.2% | 18.1% | 0.37 | -9.2% |
| Real Estate (VNQ) | 4.5% | 20.7% | 0.18 | 13.1% |
| Bitcoin (BTCUSD) | 63.5% | 66.2% | 1.03 | 18.9% |
Smart multi-asset allocation framework can stack odds in your favor. Learn How
Earnings Returns History
Updated 9/17/2026| Forward Returns | |||
|---|---|---|---|
| Earnings Date | 1D Returns | 5D Returns | 21D Returns |
| 7/14/2026 | -12.8% | -13.0% | -21.5% |
| 4/7/2026 | -0.8% | -8.7% | -2.7% |
| 1/13/2026 | -10.5% | -3.8% | -12.6% |
| 11/20/2025 | 2.8% | 11.2% | 7.7% |
| SUMMARY STATS | |||
| # Positive | 1 | 1 | 1 |
| # Negative | 3 | 3 | 3 |
| Median Positive | 2.8% | 11.2% | 7.7% |
| Median Negative | -10.5% | -8.7% | -12.6% |
| Max Positive | 2.8% | 11.2% | 7.7% |
| Max Negative | -12.8% | -13.0% | -21.5% |
| Forward Returns | |||
|---|---|---|---|
| Earnings Date | 1D Returns | 5D Returns | 21D Returns |
| 7/14/2026 | -12.8% | -13.0% | -21.5% |
| 4/7/2026 | -0.8% | -8.7% | -2.7% |
| 1/13/2026 | -10.5% | -3.8% | -12.6% |
| 11/20/2025 | 2.8% | 11.2% | 7.7% |
| SUMMARY STATS | |||
| # Positive | 1 | 1 | 1 |
| # Negative | 3 | 3 | 3 |
| Median Positive | 2.8% | 11.2% | 7.7% |
| Median Negative | -10.5% | -8.7% | -12.6% |
| Max Positive | 2.8% | 11.2% | 7.7% |
| Max Negative | -12.8% | -13.0% | -21.5% |
Recent Forward Guidance
Updated 10/4/2026Latest: Q3 2026 Earnings Reported 7/14/2026
| Forward Guidance | Guidance Change | |||||||
|---|---|---|---|---|---|---|---|---|
| Metric | Source | Low | Mid | High | % Chg | % Delta | Change | Prior |
| 2026 Revenue | Reported | 1.02 Bil | 1.02 Bil | 1.02 Bil | -0.7% | Lowered | Guidance: 1.03 Bil for 2026 | |
| 2026 Adjusted EBITDA | Reported | 246.00 Mil | 248.00 Mil | 250.00 Mil | 0.6% | Raised | Guidance: 246.50 Mil for 2026 | |
Insider Activity
Updated 8/21/2026| # | Owner | Title | Holding | Action | Filing Date | Price | Shares | Transacted Value | Value of Held Shares | Form |
|---|---|---|---|---|---|---|---|---|---|---|
| 1 | Nisar, Adnan A | TVG-I-E-AEG Holdings, LP | Sell | 10172025 | 29.92 | 105,452 | 3,155,124 | 147,669,053 | Form | |
| 2 | Nesbitt, Martin H | TVG-I-E-AEG Holdings, LP | Sell | 10172025 | 29.92 | 105,452 | 3,155,124 | 147,669,053 | Form | |
| 3 | Tvg-I-E-Aeg, Holdings, LP | Direct | Sell | 10172025 | 29.92 | 105,452 | 3,155,124 | 147,669,053 | Form | |
| 4 | Nisar, Adnan A | TVG-I-E-AEG Holdings, LP | Sell | 10142025 | 29.92 | 703,015 | 21,034,209 | 150,824,177 | Form | |
| 5 | Nesbitt, Martin H | TVG-I-E-AEG Holdings, LP | Sell | 10142025 | 29.92 | 703,015 | 21,034,209 | 150,824,177 | Form |
| # | Owner | Title | Holding | Action | Filing Date | Price | Shares | Transacted Value | Value of Held Shares | Form |
|---|---|---|---|---|---|---|---|---|---|---|
| 1 | Nisar, Adnan A | TVG-I-E-AEG Holdings, LP | Sell | 10172025 | 29.92 | 105,452 | 3,155,124 | 147,669,053 | Form | |
| 2 | Nesbitt, Martin H | TVG-I-E-AEG Holdings, LP | Sell | 10172025 | 29.92 | 105,452 | 3,155,124 | 147,669,053 | Form | |
| 3 | Tvg-I-E-Aeg, Holdings, LP | Direct | Sell | 10172025 | 29.92 | 105,452 | 3,155,124 | 147,669,053 | Form | |
| 4 | Nisar, Adnan A | TVG-I-E-AEG Holdings, LP | Sell | 10142025 | 29.92 | 703,015 | 21,034,209 | 150,824,177 | Form | |
| 5 | Nesbitt, Martin H | TVG-I-E-AEG Holdings, LP | Sell | 10142025 | 29.92 | 703,015 | 21,034,209 | 150,824,177 | Form | |
| 6 | Tvg-I-E-Aeg, Holdings, LP | Direct | Sell | 10142025 | 29.92 | 703,015 | 21,034,209 | 150,824,177 | Form |

Industry Resources
| Consumer Discretionary Resources |
| Retail Dive |
| Business of Fashion (BoF) |
| WWD (Women's Wear Daily) |
| National Retail Federation (NRF) |
| McKinsey & Company - Consumer |
| Mintel Consumer Trends |
| Education Services Resources |
| EdSurge |
| Education Week |
| Inside Higher Ed |
External Quote Links
| Y Finance | Barrons |
| TradingView | Morningstar |
| SeekingAlpha | ValueLine |
| Motley Fool | Robinhood |
| CNBC | Etrade |
| MarketWatch | Unusual Whales |
| YCharts | Perplexity Finance |
| FinViz |
Prefer one of these to Trefis? Tell us why.