
L3Harris Technologies (LHX)
Market Price (11/4/2026): $276.97 | Market Cap: $51.6 BilInvestor Relations Sector: Industrials | Industry: Aerospace & Defense
L3Harris Technologies (LHX)
Market Price (11/4/2026): $276.97Market Cap: $51.6 BilSector: IndustrialsIndustry: Aerospace & Defense
Investment Highlights Why It Matters Detailed financial logic regarding cash flow yields vs trend-riding momentum.
Attractive yieldTotal YieldTotal Yield = Earnings Yield + Dividend Yield, Earnings Yield = Net Income / Market Cap Dividend Yield = Total Dividends / Market Cap is 5.9%, FCF Yield is 7.2% Attractive cash flow generationCFO/Rev LTMCash Flow from Operations / Revenue (Sales), Last Twelve Months (LTM) is 18%, FCF/Rev LTMFree Cash Flow / Revenue (Sales), Last Twelve Months (LTM) is 16%, CFO LTM is 4.2 Bil, FCF LTM is 3.6 Bil Stock buyback supportStock Buyback 3Y Total is 2.3 Bil Low stock price volatilityVol 12M is 29% Megatrend and thematic driversMegatrends include Advanced Aviation & Space, Cybersecurity, and 5G & Advanced Connectivity. Themes include Commercial Space Exploration, Show more. | Weak multi-year price returns2Y Excs Rtn is -12%, 3Y Excs Rtn is -11% | Key risksLHX key risks include [1] its high dependence on fluctuating U.S. Show more. |
| Attractive yieldTotal YieldTotal Yield = Earnings Yield + Dividend Yield, Earnings Yield = Net Income / Market Cap Dividend Yield = Total Dividends / Market Cap is 5.9%, FCF Yield is 7.2% |
| Attractive cash flow generationCFO/Rev LTMCash Flow from Operations / Revenue (Sales), Last Twelve Months (LTM) is 18%, FCF/Rev LTMFree Cash Flow / Revenue (Sales), Last Twelve Months (LTM) is 16%, CFO LTM is 4.2 Bil, FCF LTM is 3.6 Bil |
| Stock buyback supportStock Buyback 3Y Total is 2.3 Bil |
| Low stock price volatilityVol 12M is 29% |
| Megatrend and thematic driversMegatrends include Advanced Aviation & Space, Cybersecurity, and 5G & Advanced Connectivity. Themes include Commercial Space Exploration, Show more. |
| Weak multi-year price returns2Y Excs Rtn is -12%, 3Y Excs Rtn is -11% |
| Key risksLHX key risks include [1] its high dependence on fluctuating U.S. Show more. |
Qualitative Assessment
AI Analysis | Feedback
L3Harris Technologies (LHX) stock has remained largely at the same level since 7/31/2026 because of the following key factors:
1. Q3 2026 financial outperformance driving recovery from earlier dip.
L3Harris Technologies, whose fiscal Q3 2026 ended on October 2, 2026, announced robust financial results for the quarter on October 29, 2026. The company reported diluted earnings per share (EPS) of $3.28, significantly exceeding the consensus estimate of $2.95, and revenue of $6.07 billion, surpassing the $5.92 billion estimate. This represented a 7.1% year-over-year revenue increase and 9% organic growth. Additionally, L3Harris raised its full-year 2026 revenue guidance to a range of $23.5 billion to $23.7 billion and its EPS guidance to $12.25 to $12.35. These strong company-specific developments, coupled with a record backlog of $53.2 billion and a 3.2x book-to-bill ratio, acted as a powerful catalyst for the stock's recovery. Shares surged 6.98% to $278.80 in premarket trading following the announcement, helping the stock rebound from a 52-week low of $232.34 observed on October 8, 2026, and bringing it back towards its late July levels of approximately $275.74.
2. Broader macroeconomic and defense sector headwinds limited sustained upside.
Despite L3Harris's strong individual performance, the stock's ability to achieve a sustained, significant rally above its initial July 2026 levels was tempered by prevailing macroeconomic and geopolitical factors. The broader defense sector, within L3Harris's fiscal Q3 2026 (July 2, 2026 – October 2, 2026) and early fiscal Q4 2026 (October 2, 2026 – January 1, 2027), faced headwinds such as election uncertainty, federal deficits in the U.S. and globally, and higher interest rates. Furthermore, industry-wide inventory shortfalls and industrial base bottlenecks posed challenges, potentially slowing the conversion of a robust backlog into immediate revenue and profit growth. These external pressures created a challenging environment that likely limited overall investor enthusiasm and capped the stock's upward trajectory, offsetting some of the positive company-specific news.
Show more
L3Harris Technologies (LHX) stock has remained largely at the same level since 7/31/2026 because of the following key factors:
1. Q3 2026 financial outperformance driving recovery from earlier dip.
L3Harris Technologies, whose fiscal Q3 2026 ended on October 2, 2026, announced robust financial results for the quarter on October 29, 2026. The company reported diluted earnings per share (EPS) of $3.28, significantly exceeding the consensus estimate of $2.95, and revenue of $6.07 billion, surpassing the $5.92 billion estimate. This represented a 7.1% year-over-year revenue increase and 9% organic growth. Additionally, L3Harris raised its full-year 2026 revenue guidance to a range of $23.5 billion to $23.7 billion and its EPS guidance to $12.25 to $12.35. These strong company-specific developments, coupled with a record backlog of $53.2 billion and a 3.2x book-to-bill ratio, acted as a powerful catalyst for the stock's recovery. Shares surged 6.98% to $278.80 in premarket trading following the announcement, helping the stock rebound from a 52-week low of $232.34 observed on October 8, 2026, and bringing it back towards its late July levels of approximately $275.74.
2. Broader macroeconomic and defense sector headwinds limited sustained upside.
Despite L3Harris's strong individual performance, the stock's ability to achieve a sustained, significant rally above its initial July 2026 levels was tempered by prevailing macroeconomic and geopolitical factors. The broader defense sector, within L3Harris's fiscal Q3 2026 (July 2, 2026 – October 2, 2026) and early fiscal Q4 2026 (October 2, 2026 – January 1, 2027), faced headwinds such as election uncertainty, federal deficits in the U.S. and globally, and higher interest rates. Furthermore, industry-wide inventory shortfalls and industrial base bottlenecks posed challenges, potentially slowing the conversion of a robust backlog into immediate revenue and profit growth. These external pressures created a challenging environment that likely limited overall investor enthusiasm and capped the stock's upward trajectory, offsetting some of the positive company-specific news.
3. Valuation considerations and prevailing market factor performance.
The stock's valuation played a role in its tendency to remain within a relatively tight range. As of October 29, 2026, L3Harris Technologies was indicated as "fairly valued at $268.72 compared to the current price of $277.64" by the GF Value™. This suggests that the market considered the stock to be trading near its intrinsic value, even after the strong fiscal Q3 earnings, which could have constrained any sustained breakout to significantly higher price levels. Additionally, during fiscal Q3 2026, "Momentum, Quality and Low Volatility" were identified as the worst-performing factors in U.S. equities, contributing to a less favorable market sentiment for certain investment styles and potentially adding downward pressure or limiting upward mobility for stocks like LHX during this period.
Show less
Stock Movement Drivers
Fundamental Drivers
The 0.7% change in LHX stock from 7/31/2026 to 11/3/2026 was primarily driven by a 7.3% change in the company's Net Income Margin (%).| (LTM values as of) | 7312026 | 11032026 | Change |
|---|---|---|---|
| Stock Price ($) | 275.74 | 277.67 | 0.7% |
| Change Contribution By: | |||
| Total Revenues ($ Mil) | 22,932 | 23,333 | 1.7% |
| Net Income Margin (%) | 8.1% | 8.7% | 7.3% |
| P/E Multiple | 27.6 | 24.8 | -10.3% |
| Shares Outstanding (Mil) | 186 | 181 | 2.8% |
| Cumulative Contribution | 0.7% |
Market Drivers
7/31/2026 to 11/3/2026| Return | Correlation | |
|---|---|---|
| LHX | 0.7% | |
| Market (SPY) | 1.0% | -1.2% |
| Sector (XLI) | -4.7% | 22.5% |
Fundamental Drivers
The -12.6% change in LHX stock from 4/30/2026 to 11/3/2026 was primarily driven by a -27.7% change in the company's P/E Multiple.| (LTM values as of) | 4302026 | 11032026 | Change |
|---|---|---|---|
| Stock Price ($) | 317.73 | 277.67 | -12.6% |
| Change Contribution By: | |||
| Total Revenues ($ Mil) | 22,477 | 23,333 | 3.8% |
| Net Income Margin (%) | 7.7% | 8.7% | 12.9% |
| P/E Multiple | 34.3 | 24.8 | -27.7% |
| Shares Outstanding (Mil) | 187 | 181 | 3.1% |
| Cumulative Contribution | -12.6% |
Market Drivers
4/30/2026 to 11/3/2026| Return | Correlation | |
|---|---|---|
| LHX | -12.6% | |
| Market (SPY) | 5.2% | -11.3% |
| Sector (XLI) | -1.6% | 19.6% |
Fundamental Drivers
The -2.4% change in LHX stock from 10/31/2025 to 11/3/2026 was primarily driven by a -18.1% change in the company's P/E Multiple.| (LTM values as of) | 10312025 | 11032026 | Change |
|---|---|---|---|
| Stock Price ($) | 284.38 | 277.67 | -2.4% |
| Change Contribution By: | |||
| Total Revenues ($ Mil) | 21,740 | 23,333 | 7.3% |
| Net Income Margin (%) | 8.1% | 8.7% | 7.5% |
| P/E Multiple | 30.2 | 24.8 | -18.1% |
| Shares Outstanding (Mil) | 187 | 181 | 3.3% |
| Cumulative Contribution | -2.4% |
Market Drivers
10/31/2025 to 11/3/2026| Return | Correlation | |
|---|---|---|
| LHX | -2.4% | |
| Market (SPY) | 11.5% | 7.7% |
| Sector (XLI) | 11.4% | 34.9% |
Fundamental Drivers
The 63.9% change in LHX stock from 10/31/2023 to 11/3/2026 was primarily driven by a 25.1% change in the company's Total Revenues ($ Mil).| (LTM values as of) | 10312023 | 11032026 | Change |
|---|---|---|---|
| Stock Price ($) | 169.37 | 277.67 | 63.9% |
| Change Contribution By: | |||
| Total Revenues ($ Mil) | 18,657 | 23,333 | 25.1% |
| Net Income Margin (%) | 8.0% | 8.7% | 9.3% |
| P/E Multiple | 21.6 | 24.8 | 14.7% |
| Shares Outstanding (Mil) | 189 | 181 | 4.5% |
| Cumulative Contribution | 63.9% |
Market Drivers
10/31/2023 to 11/3/2026| Return | Correlation | |
|---|---|---|
| LHX | 63.9% | |
| Market (SPY) | 86.6% | 21.0% |
| Sector (XLI) | 81.1% | 41.3% |
Price Returns Compared
| 2021 | 2022 | 2023 | 2024 | 2025 | 2026 | Total [1] | |
|---|---|---|---|---|---|---|---|
| Returns | |||||||
| LHX Return | 15% | -0% | 4% | 2% | 42% | -4% | 65% |
| Peers Return | 17% | 29% | -4% | 18% | 29% | 7% | 136% |
| S&P 500 Return | 27% | -19% | 24% | 23% | 16% | 10% | 101% |
Monthly Win Rates [3] | |||||||
| LHX Win Rate | 67% | 33% | 42% | 75% | 75% | 36% | |
| Peers Win Rate | 57% | 62% | 48% | 60% | 63% | 53% | |
| S&P 500 Win Rate | 75% | 42% | 67% | 75% | 67% | 36% | |
Max Drawdowns [4] | |||||||
| LHX Max Drawdown | -17% | -23% | -24% | -21% | -13% | -38% | |
| Peers Max Drawdown | -16% | -17% | -24% | -18% | -16% | -30% | |
| S&P 500 Max Drawdown | -5% | -25% | -10% | -8% | -19% | -9% | |
[1] Cumulative total returns since the beginning of 2021
[2] Peers: LMT, NOC, RTX, GD, LDOS. See LHX Returns vs. Peers.
[3] Win Rate = % of calendar months in which monthly returns were positive
[4] Max drawdown represents maximum peak-to-trough decline within a year
[5] 2026 data is for the year up to 11/3/2026 (YTD)
How Low Can It Go
| Event | LHX | S&P 500 |
|---|---|---|
| Summer-Fall 2023 Five Percent Yield Shock | ||
| % Loss | -19.5% | -9.5% |
| % Gain to Breakeven | 24.2% | 10.5% |
| Time to Breakeven | 60 days | 24 days |
| 2023 SVB Regional Banking Crisis | ||
| % Loss | -17.5% | -6.7% |
| % Gain to Breakeven | 21.3% | 7.1% |
| Time to Breakeven | 201 days | 31 days |
| 2020 COVID-19 Crash | ||
| % Loss | -33.2% | -33.7% |
| % Gain to Breakeven | 49.8% | 50.9% |
| Time to Breakeven | 437 days | 140 days |
| Q4 2018 Fed Policy Error / Growth Scare | ||
| % Loss | -24.4% | -19.2% |
| % Gain to Breakeven | 32.2% | 23.8% |
| Time to Breakeven | 109 days | 105 days |
| 2015-2016 China Devaluation / Global Growth Scare | ||
| % Loss | -14.8% | -12.2% |
| % Gain to Breakeven | 17.4% | 13.9% |
| Time to Breakeven | 51 days | 62 days |
| 2014-2016 Oil Price Collapse | ||
| % Loss | -13.2% | -6.8% |
| % Gain to Breakeven | 15.3% | 7.3% |
| Time to Breakeven | 28 days | 15 days |
In The Past
L3Harris Technologies's stock fell 0.0% during the 2025 US Tariff Shock. Such a loss loss requires a 0.0% gain to breakeven.
Preserve Wealth
Limiting losses and compounding gains is essential to preserving wealth.
Asset Allocation
Actively managed asset allocation strategies protect wealth. Learn more.
| Event | LHX | S&P 500 |
|---|---|---|
| 2020 COVID-19 Crash | ||
| % Loss | -33.2% | -33.7% |
| % Gain to Breakeven | 49.8% | 50.9% |
| Time to Breakeven | 437 days | 140 days |
| Q4 2018 Fed Policy Error / Growth Scare | ||
| % Loss | -24.4% | -19.2% |
| % Gain to Breakeven | 32.2% | 23.8% |
| Time to Breakeven | 109 days | 105 days |
| 2011 US Debt Ceiling Crisis & European Contagion | ||
| % Loss | -22.8% | -17.9% |
| % Gain to Breakeven | 29.6% | 21.8% |
| Time to Breakeven | 141 days | 123 days |
| 2008-2009 Global Financial Crisis | ||
| % Loss | -55.1% | -53.4% |
| % Gain to Breakeven | 122.6% | 114.4% |
| Time to Breakeven | 1572 days | 1085 days |
In The Past
L3Harris Technologies's stock fell 0.0% during the 2025 US Tariff Shock. Such a loss loss requires a 0.0% gain to breakeven.
Preserve Wealth
Limiting losses and compounding gains is essential to preserving wealth.
Asset Allocation
Actively managed asset allocation strategies protect wealth. Learn more.
About L3Harris Technologies (LHX)
L3Harris Technologies (LHX) is a global aerospace and defense technology company that provides mission-critical solutions to government and commercial customers worldwide. The company specializes in advanced systems and technologies across various domains, including intelligence, surveillance, and reconnaissance (ISR), secure communications, space exploration, and aviation.
Its core offerings encompass a wide range of products and services. These include multi-mission ISR systems, tactical and broadband secure networked communication equipment, and advanced electro-optical and infrared solutions. L3Harris also develops space payloads, sensors, electronic warfare systems, and classified intelligence and cyber defense solutions. Furthermore, it provides mission systems for maritime platforms, unmanned surface and undersea autonomous solutions, defense aviation products, commercial pilot training, and air traffic management solutions.
Through its diverse portfolio, L3Harris Technologies serves as a vital partner in addressing complex challenges in national security, public safety, and critical infrastructure. The company's comprehensive technological capabilities support crucial operations from battlefield communications and space-based sensing to airborne missions and maritime intelligence gathering across the globe.
AI Analysis | Feedback
- A Honeywell or Raytheon for defense and space, specializing in advanced communication, sensor, and intelligence systems.
- The Cisco of military and government communications, also providing the 'eyes and ears' (advanced sensors and intelligence systems) for defense and space missions.
AI Analysis | Feedback
Here are the major products and services of L3Harris Technologies:
- Intelligence, Surveillance, and Reconnaissance (ISR) Systems: Provides multi-mission systems, sensors, and support services for intelligence gathering and analysis across various platforms.
- Communication Systems: Offers tactical, broadband, and satellite communication equipment, including radios and data link terminals, for military, public safety, and professional use.
- Space Payloads and Sensors: Develops advanced payloads, sensors, and complete mission solutions for space-based applications.
- Electronic Warfare Systems: Delivers systems designed to detect, jam, and counter adversary electronic signals.
- Maritime Mission Systems: Integrates mission systems for naval platforms, encompassing signals intelligence, unmanned solutions, and ship control systems.
- Electro-Optical and Infrared (EO/IR) Solutions: Supplies advanced imaging, sensing, and targeting technologies utilizing electro-optical and infrared spectrums.
- Mission Avionics: Provides integrated electronic systems and software for aircraft to enhance mission performance and capability.
- Cyber Defense Solutions: Offers classified intelligence and robust cyber defense capabilities to protect critical information and infrastructure.
- Night Vision Systems: Manufactures integrated night vision systems for helmet and weapon mounting, enhancing visibility in low-light conditions.
- Defense Aviation Products: Develops and supplies various products specifically for military aircraft applications.
- Commercial Pilot Training: Provides comprehensive training programs for aspiring and current commercial pilots.
- Air Traffic Management Solutions: Offers mission networks and systems for efficient and safe air traffic control and management.
AI Analysis | Feedback
AI Analysis | Feedback
AI Analysis | Feedback
Christopher E. Kubasik, Chair and Chief Executive Officer
Christopher E. Kubasik has over 30 years of experience in the aerospace and defense industry. He joined L3 Technologies in 2015 as President and Chief Operating Officer, and was appointed CEO in January 2018, later becoming Chair in May 2018. Following the merger of L3 Technologies and Harris Corporation in 2019, he served as Vice Chair, President, and Chief Operating Officer of L3Harris Technologies before being named Chief Executive Officer in June 2021 and Chair in June 2022. Prior to L3, he was President and Chief Operating Officer of Lockheed Martin Corporation, where he also held senior executive and finance roles, including Executive Vice President and Chief Financial Officer since 2004. Earlier in his career, Kubasik was President and CEO of Seabury Advisory Group LLC, an aviation and aerospace professional services firm, and a partner at Ernst & Young. He holds a bachelor's degree in accounting from the University of Maryland's Smith School of Business.
Kenneth Bedingfield, Senior Vice President, Chief Financial Officer and President, Missile Solutions (MSL) segment
Kenneth Bedingfield was appointed Chief Financial Officer of L3Harris Technologies, effective March 16, 2026. In his role as CFO, he is responsible for overseeing all internal and external financial reporting, Securities and Exchange Commission and Sarbanes Oxley compliance, financial planning, financial controls, capital structure, accounting, audit, financial services, tax, treasury, investor relations, contracts, and corporate development. He also serves as the President of the Missile Solutions segment.
Samir Mehta, President, Space & Mission Systems (SMS) and Communications & Spectrum Dominance (CSD) segments
Samir Mehta was appointed President overseeing both the Space & Mission Systems and Communications & Spectrum Dominance segments, effective March 12, 2026. He brings 25 years of leadership experience within the aerospace and defense industry. Prior to this role, he led L3Harris' Communication Systems segment and, earlier in 2026, assumed responsibility for the Space & Mission Systems segment. As President of these segments, he is responsible for business strategy, financial performance, successful execution, and growth, leading approximately 34,000 employees.
Christoph T. Feddersen, Senior Vice President, General Counsel & Secretary
Christoph T. Feddersen is responsible for the company's legal, internal audit, environmental health & safety, and enterprise security organizations. He joined L3Harris in 2024 as Vice President and General Counsel for Space and Airborne Systems, bringing more than 25 years of legal practice experience from in-house roles and international law firms in the United States and Europe. Before joining L3Harris, Feddersen spent 17 years in various positions at RTX Corporation.
AI Analysis | Feedback
The key risks to L3Harris Technologies (LHX) are primarily associated with its significant reliance on government spending, the volatile global geopolitical and economic landscape, and the intense competition within the aerospace and defense sector.
- Dependence on U.S. Government Contracts and Spending Priorities: A substantial portion of L3Harris Technologies' revenue, approximately 75%, is derived from U.S. Government customers. This makes the company highly vulnerable to shifts in government spending, budget cuts, procurement reform initiatives, and funding uncertainties. Any prolonged uncertainty from the appropriations process, continuing resolutions, or government shutdowns could lead to funding reductions, contract modifications or terminations, and difficulties in forecasting revenue and resource requirements, thereby materially pressuring the company's business and financial performance.
- Geopolitical Instability, Economic Conditions, and International Market Volatility: L3Harris Technologies operates internationally, making its business susceptible to geopolitical events and economic uncertainties. Instability in key markets can disrupt sales and supply chains, while economic downturns can lead to reduced demand for defense products. Furthermore, international operations expose the company to regulatory changes, currency fluctuations, and potential trade policy changes, which are largely beyond its control and could have material adverse effects on its operations and profitability.
- Highly Competitive Markets and Technological Advances: The company operates in highly competitive markets that are sensitive to technological advances. L3Harris Technologies faces competition from both larger defense contractors and non-traditional players, some of whom may possess greater resources for research and development. To maintain its competitive edge, the company must continuously invest significantly in research and development to innovate and offer advanced solutions, ensuring it remains at the forefront of technological capabilities in the defense sector.
AI Analysis | Feedback
The emergence of commercial space technologies and services, particularly exemplified by proliferated low-earth orbit (LEO) satellite constellations like SpaceX's Starlink, presents a clear emerging threat. L3Harris Technologies' Communication Systems segment provides traditional satellite communication (SATCOM) systems and terminals, and its Space and Airborne Systems segment offers space payloads and full-mission solutions. Commercial LEO constellations offer a disruptive model with significantly lower costs, higher bandwidth, lower latency, and rapid deployment compared to traditional bespoke military and government SATCOM solutions. This agile, commercially-driven approach directly competes with and could potentially displace parts of L3Harris's offerings in military and government satellite communications and related space services.
AI Analysis | Feedback
L3Harris Technologies (symbol: LHX) operates within several significant addressable markets for its diverse range of products and services.
Integrated Mission Systems Segment:
- Intelligence, Surveillance, and Reconnaissance (ISR) Systems: The global intelligence, surveillance, and reconnaissance (ISR) market was valued at approximately USD 42 billion in 2024 and is expected to reach around USD 71.2 billion by 2034, growing at a CAGR of 5.6% during the forecast period. Another estimate projects the market to grow from USD 44.4 billion in 2025 to USD 76.5 billion by 2035. North America dominated this market in 2023, accounting for over 35% of the share.
- Advanced Electro-Optical and Infrared Solutions (related to Night Vision): The global military night vision device market is projected to grow from USD 5.68 billion in 2025 to USD 9.88 billion by 2031, at a 9.67% CAGR. Another report estimates the broader global night vision devices market at USD 11.37 billion in 2024, projected to reach USD 17.72 billion by 2033. North America held 39.7% of the market share in 2024. L3Harris Technologies is a key player in this market and received a significant order for Enhanced Night Vision Goggle – Binocular (ENVG-B) systems from the U.S. Army.
- Maritime Autonomous Solutions: The global Maritime Autonomous Systems market was valued at USD 5.7 billion in 2025 and is projected to reach USD 22.8 billion by 2033, growing at a Compound Annual Growth Rate (CAGR) of 23.4%. Another source indicates the market size at USD 6.04 billion in 2023, projected to reach USD 13.41 billion by 2030. L3Harris Technologies holds an estimated 40% of the global market share alongside Thales and Kongsberg Maritime.
Space and Airborne Systems Segment:
- Space Payloads, Sensors, and Full-Mission Solutions (Space Militarization/Defense): The global space militarization market size was valued at USD 61.92 billion in 2025 and is projected to grow to USD 116.1 billion by 2034, exhibiting a CAGR of 7.19%. North America dominated this market with a market share of 40.15% in 2025.
- Electronic Warfare Systems: The global electronic warfare market size was valued at USD 22.66 billion in 2025 and is expected to reach USD 31.28 billion by 2033, at a CAGR of 4.11%. Other estimates include a market size of USD 26.08 billion in 2025, predicted to increase to approximately USD 43.13 billion by 2035. North America dominated the electronic warfare market with the largest revenue share of 36.75% in 2025.
- Mission Avionics (Military Avionics): The global next-gen military avionics market size was valued at USD 36.4 billion in 2024 and is estimated to grow to USD 57.6 billion by 2034. Another report states the global military aircraft avionics market size was valued at approximately USD 38.5 billion in 2024 and is projected to reach around USD 57.2 billion by 2030. North America is the largest market for military aircraft avionics.
Communication Systems Segment:
- Tactical Communications (Military Communications): The global military communications market was valued at USD 38.85 billion in 2024 and is expected to grow to USD 54.35 billion by 2033. Another source indicates a market size of USD 42.10 billion in 2025, projected to grow to USD 70.20 billion by 2034. North America is the most significant global military communications market shareholder.
- Public Safety and Professional Communications: The global public safety communications market size is estimated to reach USD 72 billion by 2031. The public safety wireless communication solution market stood at USD 3.62 billion in 2026 and is projected to reach USD 6.66 billion by 2035. North America has emerged as the most dominant region in the global public safety wireless communication solution market.
Aviation Systems Segment:
- Air Traffic Management (ATM) Solutions: The global air traffic management market size was estimated at USD 9.4 billion in 2023 and is projected to reach approximately USD 15.2 billion by 2032. Another report indicates the global air traffic management market size was valued at USD 15.35 billion in 2025 and is projected to grow to USD 20.5 billion by 2034. North America remains a key market for air-traffic management.
AI Analysis | Feedback
L3Harris Technologies (LHX) is expected to drive future revenue growth over the next 2-3 years through several key initiatives and market trends:
-
Robust Demand in Missile Solutions: L3Harris anticipates significant growth in its Missile Solutions segment, which includes the fully integrated Aerojet Rocketdyne business. This segment is projected to generate approximately $4.4 billion in revenue in 2026, a notable increase from $3.8 billion in 2025, as production ramps up across more than 30 missile programs. The company is also pursuing a strategic partnership with the Department of War (DoW) involving a $1 billion investment to substantially increase solid rocket motor production capacity, with a planned initial public offering (IPO) of the Missile Solutions business in the second half of 2026.
-
Expansion in Space and Airborne Systems: Growth in the Space and Airborne Systems segment is driven by strategic investments in new space architectures, hypersonic detection capabilities, and key programs like the F-35 upgrades. The company is also heavily involved in the Golden Dome initiative for missile warning and tracking, leveraging existing investments and preparing to deploy a constellation of satellites critical for detecting hypersonic threats.
-
Advancements in Resilient Communication and Autonomous Systems: L3Harris is developing and deploying advanced technologies, including resilient communication equipment and innovative autonomous solutions. There is increased demand for software-defined resilient communications, particularly for international deliveries. The company has also introduced its "Red Wolf" and "Green Wolf" launched effects vehicles, which are multi-role autonomous platforms for kinetic strikes and electronic warfare, along with AMORPHOUS™ software designed to control thousands of autonomous assets simultaneously, addressing critical national security needs.
-
International Market Penetration: The company is actively expanding its global reach, focusing on high-growth areas and strategic acquisitions in emerging markets. L3Harris is capitalizing on increased defense spending, particularly in Europe and the Indo-Pacific regions, for its communication systems and electro-optic infrared capabilities, driven by evolving geopolitical dynamics and active European rearmament.
AI Analysis | Feedback
Share Repurchases
- L3Harris Technologies' board approved an additional $3.0 billion share repurchase authorization in October 2022, bringing the total current authorization to approximately $4.5 billion.
- In fiscal year 2025, the company repurchased 5.1 million shares of its common stock for $1.2 billion.
- Annual share repurchases amounted to $554 million in 2025 and $518 million in 2023.
Share Issuance
- No significant share issuances were identified over the last 3-5 years. The number of shares outstanding has generally decreased due to ongoing share repurchase programs.
Inbound Investments
- In January 2026, L3Harris Technologies secured a $1 billion investment from the Department of War (now Department of Defense) in connection with its plans to separate its solid rocket motor missile solutions unit. This investment will convert into common equity when the unit goes public.
Outbound Investments
- In July 2023, L3Harris Technologies completed the acquisition of Aerojet Rocketdyne for $4.7 billion in cash, expanding its capabilities in missile and space propulsion.
- The company acquired Viasat's tactical data link product line for $1.96 billion, with the transaction announced in October 2022 and expected to close in the first half of 2023.
Capital Expenditures
- L3Harris Technologies' capital expenditures averaged $375 million for fiscal years ending December 2021 to 2026.
- Capital expenditures for fiscal 2025 were $424 million, and are anticipated to be approximately $600 million for fiscal 2026.
- The company plans $3 billion in capital expenditures for Missile Solutions capacity expansion and is investing over $1.25 billion in its manufacturing footprint, including new facilities to boost solid rocket motor production.
Peer Outperformance in Aerospace & Defense
| Ticker | Name | Rev Growth 3Y Avg | P/E | 1Y | 3Y | 5Y | 5Y Gap |
|---|---|---|---|---|---|---|---|
| LHX | L3Harris Technologies | 7.8% | 24.8x | -2.2% | 58.4% | 38.7% | — |
| ATI | ATI | 6.8% | 44.2x | 82.9% | 332.4% | 996.9% | +958pp |
| MOG-A | Moog | 10.4% | 30.4x | 75.7% | 177.1% | 385.3% | +347pp |
| CW | Curtiss-Wright | 10.3% | 34.0x | -17.2% | 146.0% | 290.7% | +252pp |
| DCO | Ducommun | 5.1% | -83.8x | 78.5% | 243.7% | 225.5% | +187pp |
| LMT | Lockheed Martin | 5.4% | 22.6x | 34.3% | 52.7% | 120.4% | +82pp |
| Industry | Names | 1Y med | 3Y med | 5Y med | Top 3 by 5Y |
|---|---|---|---|---|---|
| Construction & Engineering | 29 | -3.6% | 100.0% | 149.1% | STRL 1304% · FIX 1275% · AGX 776% |
| Marine Transportation | 5 | 34.9% | 45.7% | 144.5% | MATX 171% · KEX 145% |
| Construction Machinery & Heavy Transportation Equipment | 13 | 16.1% | 58.1% | 103.1% | ALSN 274% · CAT 233% · WAB 224% |
| Aerospace & Defense ← | 54 | -9.5% | 62.7% | 65.1% | ATI 997% · FTAI 981% · HWM 644% |
| Industrial Machinery & Supplies & Components | 71 | 7.9% | 55.4% | 39.9% | CRS 890% · MLI 337% · SYM 273% |
| Trading Companies & Distributors | 19 | 21.5% | 40.7% | 32.2% | DXPE 420% · AIT 224% · URI 220% |
| Rail Transportation | 7 | 35.2% | 58.3% | 31.6% | CSX 52% · UNP 42% · NSC 32% |
| Diversified Support Services | 32 | 23.9% | 42.2% | 27.2% | CXW 233% · OPLN 166% · CACI 138% |
| Building Products | 34 | -6.4% | 11.9% | 20.1% | MOD 1023% · GFF 355% · TT 149% |
| Cargo Ground Transportation | 16 | 37.4% | 13.7% | 8.5% | XPO 292% · R 259% · ARCB 25% |
| Electrical Components & Equipment | 39 | -3.6% | 76.3% | 7.4% | POWL 1863% · VRT 819% · BE 569% |
| Office Services & Supplies | 10 | 27.7% | 21.1% | 1.3% | TILE 153% · PBI 146% · HNI 46% |
| Industrial Conglomerates | 17 | 12.6% | -4.5% | -13.9% | CSW 109% · CSL 78% · DD 76% |
| Data Processing & Outsourced Services | 6 | -17.5% | -0.6% | -15.4% | EXLS 61% · BR 18% · G -14% |
| Research & Consulting Services | 13 | 3.4% | -16.8% | -20.4% | HURN 281% · FCN 32% · BAH 11% |
| Agricultural & Farm Machinery | 16 | 12.9% | -7.6% | -22.0% | DE 107% · TTC 19% · AGCO 6% |
| Security & Alarm Services | 9 | -52.9% | 12.7% | -25.0% | BCO 65% |
| Environmental & Facilities Services | 29 | -32.9% | 21.6% | -28.3% | GEO 207% · CLH 175% · RSG 95% |
| Passenger Airlines | 11 | -1.6% | 41.6% | -34.2% | LTM 2778% · UAL 119% · DAL 110% |
| Air Freight & Logistics | 12 | -23.3% | -9.3% | -40.9% | FDX 83% · EXPD 69% · CHRW 59% |
| Human Resource & Employment Services | 22 | 20.5% | -9.6% | -44.1% | ADP 47% · FA 22% · PAYX 10% |
| Passenger Ground Transportation | 3 | -20.4% | 39.5% | -61.4% | UBER 46% · CAR -61% · LYFT -66% |
| Airport Services | 4 | -51.9% | -61.5% | -86.1% | JOBY -49% |
Latest Trefis Analyses
Research & Analysis
Invest in Strategies
Wealth Management
Peer Comparisons
| Peers to compare with: |
Financials
| Median | |
|---|---|
| Name | |
| Mkt Price | 325.62 |
| Mkt Cap | 89.5 |
| Rev LTM | 50,056 |
| Op Inc LTM | 5,242 |
| FCF LTM | 4,804 |
| FCF 3Y Avg | 3,504 |
| CFO LTM | 6,286 |
| CFO 3Y Avg | 4,853 |
Growth & Margins
| Median | |
|---|---|
| Name | |
| Rev Chg LTM | 7.6% |
| Rev Chg 3Y Avg | 6.9% |
| Rev Chg Q | 9.1% |
| QoQ Delta Rev Chg LTM | 2.2% |
| Op Inc Chg LTM | 11.4% |
| Op Inc Chg 3Y Avg | 12.0% |
| Op Mgn LTM | 11.2% |
| Op Mgn 3Y Avg | 10.3% |
| QoQ Delta Op Mgn LTM | -0.0% |
| CFO/Rev LTM | 12.9% |
| CFO/Rev 3Y Avg | 10.8% |
| FCF/Rev LTM | 10.4% |
| FCF/Rev 3Y Avg | 8.4% |
Valuation
| Median | |
|---|---|
| Name | |
| Mkt Cap | 89.5 |
| P/S | 1.8 |
| P/Op Inc | 17.1 |
| P/EBIT | 16.9 |
| P/E | 22.1 |
| P/CFO | 14.2 |
| Total Yield | 6.4% |
| Dividend Yield | 1.7% |
| FCF Yield 3Y Avg | 5.0% |
| D/E | 0.2 |
| Net D/E | 0.1 |
Returns
| Median | |
|---|---|
| Name | |
| 1M Rtn | 14.3% |
| 3M Rtn | -1.3% |
| 6M Rtn | 3.6% |
| 12M Rtn | 4.5% |
| 3Y Rtn | 55.2% |
| 1M Excs Rtn | 17.3% |
| 3M Excs Rtn | 0.7% |
| 6M Excs Rtn | -0.3% |
| 12M Excs Rtn | -6.3% |
| 3Y Excs Rtn | -21.9% |
Comparison Analyses
Segment Financials
Revenue by Segment| $ Mil | 2026 | 2025 | 2023 | 2022 |
|---|---|---|---|---|
| Space and Airborne Systems (SAS) | 6,946 | 6,869 | 6,856 | 6,384 |
| Integrated Mission Systems (IMS) | 6,630 | 6,618 | 6,630 | 6,626 |
| Communication Systems (CS) | 5,673 | 5,459 | 5,070 | 4,217 |
| Aerojet Rocketdyne (AR) | 2,845 | 2,580 | 1,052 | |
| Intersegment | -229 | -201 | ||
| Other | -189 | -165 | ||
| Other non-reportable businesses | 0 | |||
| Total | 21,865 | 21,325 | 19,419 | 17,062 |
| $ Mil | 2026 | 2025 | 2023 | 2022 |
|---|---|---|---|---|
| Communication Systems (CS) | 1,432 | 1,324 | 1,229 | 667 |
| Space and Airborne Systems (SAS) | 852 | 812 | 756 | 665 |
| Integrated Mission Systems (IMS) | 812 | 826 | 459 | 494 |
| Aerojet Rocketdyne (AR) | 270 | 307 | 122 | |
| Unallocated corporate items and other, net | -1,256 | -1,351 | -1,140 | -699 |
| Other non-reportable businesses | 0 | |||
| Other | 0 | |||
| Total | 2,110 | 1,918 | 1,426 | 1,127 |
| $ Mil | 2026 | 2025 | 2023 | 2022 | 2021 |
|---|---|---|---|---|---|
| Corporate | 10,166 | 11,021 | 10,679 | 7,966 | 8,690 |
| Integrated Mission Systems (IMS) | 9,831 | 10,389 | 10,631 | 11,283 | 11,830 |
| Space and Airborne Systems (SAS) | 8,958 | 8,705 | 9,085 | 8,475 | 8,151 |
| Communication Systems (CS) | 7,131 | 7,060 | 7,084 | 5,800 | 6,035 |
| Aerojet Rocketdyne (AR) | 5,109 | 4,826 | 4,208 | ||
| Other non-reportable businesses | 3 | ||||
| Total | 41,195 | 42,001 | 41,687 | 33,524 | 34,709 |
Price Behavior
| Market Price | $277.67 | |
| Market Cap ($ Bil) | 50.3 | |
| First Trading Date | 12/29/2006 | |
| Distance from 52W High | -25.7% | |
| 50 Days | 200 Days | |
| DMA Price | $250.15 | $302.08 |
| DMA Trend | down | down |
| Distance from DMA | 11.0% | -8.1% |
| 3M | 1YR | |
| Volatility | 25.5% | 28.8% |
| Downside Capture | -2.27 | 38.35 |
| Upside Capture | -16.49 | 31.38 |
| Correlation (S&P 500) | -9.5% | 8.6% |
| 1M | 2M | 3M | 6M | 1Y | 3Y | |
|---|---|---|---|---|---|---|
| Beta | -0.75 | -0.37 | -0.02 | -0.26 | 0.17 | 0.32 |
| Up Beta | -1.06 | -0.56 | 0.45 | -0.67 | -0.18 | 0.41 |
| Down Beta | -0.67 | -1.46 | -0.88 | -0.18 | 0.23 | 0.28 |
| Up Capture | 66% | 15% | 11% | -23% | 16% | 11% |
| Bmk +ve Days | 12 | 18 | 28 | 62 | 130 | 427 |
| Stock +ve Days | 14 | 20 | 31 | 59 | 119 | 385 |
| Down Capture | -193% | -23% | 9% | -3% | 41% | 43% |
| Bmk -ve Days | 10 | 25 | 36 | 64 | 121 | 325 |
| Stock -ve Days | 8 | 23 | 33 | 67 | 132 | 364 |
[1] Upside and downside betas calculated using positive and negative benchmark daily returns respectively
Based On 1-Year Data
| Annualized Return | Annualized Volatility | Sharpe Ratio | Correlation with LHX | |
|---|---|---|---|---|
| LHX | -2.4% | 28.8% | -0.09 | - |
| Sector ETF (XLI) | 11.5% | 17.3% | 0.46 | 34.9% |
| Equity (SPY) | 11.6% | 12.8% | 0.57 | 7.7% |
| Gold (GLD) | -2.4% | 28.6% | -0.10 | 19.4% |
| Commodities (DBC) | 42.0% | 20.9% | 1.56 | 7.1% |
| Real Estate (VNQ) | 10.6% | 13.7% | 0.48 | 28.9% |
| Bitcoin (BTCUSD) | -29.9% | 43.5% | -0.70 | -0.7% |
Smart multi-asset allocation framework can stack odds in your favor. Learn How
Based On 5-Year Data
| Annualized Return | Annualized Volatility | Sharpe Ratio | Correlation with LHX | |
|---|---|---|---|---|
| LHX | 5.6% | 25.0% | 0.19 | - |
| Sector ETF (XLI) | 12.0% | 17.6% | 0.51 | 42.8% |
| Equity (SPY) | 12.0% | 17.1% | 0.52 | 26.4% |
| Gold (GLD) | 16.5% | 19.0% | 0.69 | 15.1% |
| Commodities (DBC) | 8.3% | 19.6% | 0.31 | 18.3% |
| Real Estate (VNQ) | 1.0% | 18.9% | -0.06 | 33.7% |
| Bitcoin (BTCUSD) | 5.0% | 51.5% | 0.28 | 7.7% |
Smart multi-asset allocation framework can stack odds in your favor. Learn How
Based On 10-Year Data
| Annualized Return | Annualized Volatility | Sharpe Ratio | Correlation with LHX | |
|---|---|---|---|---|
| LHX | 13.9% | 25.9% | 0.52 | - |
| Sector ETF (XLI) | 13.5% | 20.1% | 0.59 | 55.6% |
| Equity (SPY) | 15.2% | 17.9% | 0.71 | 43.2% |
| Gold (GLD) | 11.5% | 16.5% | 0.57 | 10.3% |
| Commodities (DBC) | 7.8% | 18.1% | 0.34 | 20.3% |
| Real Estate (VNQ) | 5.4% | 20.7% | 0.22 | 44.4% |
| Bitcoin (BTCUSD) | 61.1% | 66.2% | 1.01 | 9.4% |
Smart multi-asset allocation framework can stack odds in your favor. Learn How
Returns Analyses
Earnings Returns History
Updated 11/3/2026| Forward Returns | |||
|---|---|---|---|
| Earnings Date | 1D Returns | 5D Returns | 21D Returns |
| 10/29/2026 | 6.8% | ||
| 7/29/2026 | -8.6% | -3.8% | -11.9% |
| 4/30/2026 | -0.3% | -6.0% | -1.9% |
| 1/29/2026 | -1.2% | -5.9% | 1.2% |
| 10/30/2025 | 3.1% | 0.1% | -4.7% |
| 7/24/2025 | 1.3% | 1.7% | 2.4% |
| 4/24/2025 | -0.0% | 1.7% | 10.6% |
| 1/30/2025 | 0.1% | -1.4% | -2.8% |
| ... | |||
| SUMMARY STATS | |||
| # Positive | 12 | 13 | 14 |
| # Negative | 12 | 10 | 9 |
| Median Positive | 3.0% | 1.9% | 4.0% |
| Median Negative | -2.6% | -5.8% | -5.2% |
| Max Positive | 7.9% | 7.9% | 16.7% |
| Max Negative | -8.6% | -8.2% | -12.2% |
| Forward Returns | |||
|---|---|---|---|
| Earnings Date | 1D Returns | 5D Returns | 21D Returns |
| 10/29/2026 | 6.8% | ||
| 7/29/2026 | -8.6% | -3.8% | -11.9% |
| 4/30/2026 | -0.3% | -6.0% | -1.9% |
| 1/29/2026 | -1.2% | -5.9% | 1.2% |
| 10/30/2025 | 3.1% | 0.1% | -4.7% |
| 7/24/2025 | 1.3% | 1.7% | 2.4% |
| 4/24/2025 | -0.0% | 1.7% | 10.6% |
| 1/30/2025 | 0.1% | -1.4% | -2.8% |
| 10/24/2024 | 3.5% | 1.4% | 2.1% |
| 7/25/2024 | -5.7% | -5.8% | -5.2% |
| 4/25/2024 | 3.5% | 1.9% | 7.7% |
| 1/25/2024 | 2.2% | 2.4% | 3.5% |
| 10/26/2023 | -2.4% | 4.5% | 7.9% |
| 7/26/2023 | -6.3% | -8.2% | -12.2% |
| 4/27/2023 | -1.4% | -6.2% | -9.7% |
| 1/26/2023 | 7.9% | 7.9% | 7.2% |
| 10/27/2022 | -1.6% | -7.0% | -10.2% |
| 7/28/2022 | 3.5% | 2.6% | 1.0% |
| 4/28/2022 | -2.9% | 1.0% | 0.8% |
| 1/31/2022 | -4.3% | -2.5% | 16.7% |
| 10/29/2021 | 2.9% | -0.8% | -3.7% |
| 8/3/2021 | 2.4% | 1.3% | 3.1% |
| 4/30/2021 | 0.0% | 3.7% | 4.7% |
| 1/29/2021 | -2.9% | 4.7% | 4.5% |
| SUMMARY STATS | |||
| # Positive | 12 | 13 | 14 |
| # Negative | 12 | 10 | 9 |
| Median Positive | 3.0% | 1.9% | 4.0% |
| Median Negative | -2.6% | -5.8% | -5.2% |
| Max Positive | 7.9% | 7.9% | 16.7% |
| Max Negative | -8.6% | -8.2% | -12.2% |
SEC Filings
Expand for More| Report Date | Filing Date | Filing |
|---|---|---|
| 09/30/2026 | 10/29/2026 | 10-Q |
| 06/30/2026 | 07/30/2026 | 10-Q |
| 03/31/2026 | 04/30/2026 | 10-Q |
| 12/31/2025 | 02/12/2026 | 10-K |
| 09/30/2025 | 10/30/2025 | 10-Q |
| 06/30/2025 | 07/24/2025 | 10-Q |
| 03/31/2025 | 04/24/2025 | 10-Q |
| 12/31/2024 | 02/14/2025 | 10-K |
| 09/30/2024 | 10/25/2024 | 10-Q |
| 06/30/2024 | 07/26/2024 | 10-Q |
| 03/31/2024 | 04/26/2024 | 10-Q |
| 12/31/2023 | 02/20/2024 | 10-K |
| 09/30/2023 | 10/27/2023 | 10-Q |
| 06/30/2023 | 07/26/2023 | 10-Q |
| 03/31/2023 | 04/28/2023 | 10-Q |
| 12/31/2022 | 02/24/2023 | 10-K |
| Report Date | Filing Date | Filing |
|---|---|---|
| 09/30/2026 | 10/29/2026 | 10-Q |
| 06/30/2026 | 07/30/2026 | 10-Q |
| 03/31/2026 | 04/30/2026 | 10-Q |
| 12/31/2025 | 02/12/2026 | 10-K |
| 09/30/2025 | 10/30/2025 | 10-Q |
| 06/30/2025 | 07/24/2025 | 10-Q |
| 03/31/2025 | 04/24/2025 | 10-Q |
| 12/31/2024 | 02/14/2025 | 10-K |
| 09/30/2024 | 10/25/2024 | 10-Q |
| 06/30/2024 | 07/26/2024 | 10-Q |
| 03/31/2024 | 04/26/2024 | 10-Q |
| 12/31/2023 | 02/20/2024 | 10-K |
| 09/30/2023 | 10/27/2023 | 10-Q |
| 06/30/2023 | 07/26/2023 | 10-Q |
| 03/31/2023 | 04/28/2023 | 10-Q |
| 12/31/2022 | 02/24/2023 | 10-K |
| 09/30/2022 | 10/31/2022 | 10-Q |
| 06/30/2022 | 07/29/2022 | 10-Q |
| 03/31/2022 | 04/29/2022 | 10-Q |
| 12/31/2021 | 02/25/2022 | 10-K |
| 09/30/2021 | 10/29/2021 | 10-Q |
| 06/30/2021 | 08/04/2021 | 10-Q |
| 03/31/2021 | 05/03/2021 | 10-Q |
| 12/31/2020 | 03/01/2021 | 10-K |
| 09/30/2020 | 11/02/2020 | 10-Q |
| 06/30/2020 | 08/04/2020 | 10-Q |
| 03/31/2020 | 05/07/2020 | 10-Q |
| 12/31/2019 | 03/03/2020 | 10-KT |
Recent Forward Guidance
Updated 10/30/2026Latest: Q3 2026 Earnings Reported 10/29/2026
| Forward Guidance | Guidance Change | |||||||
|---|---|---|---|---|---|---|---|---|
| Metric | Source | Low | Mid | High | % Chg | % Delta | Change | Prior |
| 2026 Cash from operations | Reported | 3.60 Bil | 0.0% | Affirmed | Guidance: 3.60 Bil for 2026 | |||
| 2026 Revenue | Reported | 23.50 Bil | 23.60 Bil | 23.70 Bil | 0.6% | Raised | Guidance: 23.45 Bil for 2026 | |
| 2026 Space & Mission Systems Revenue | Reported | 11.90 Bil | ||||||
| 2026 Communications & Spectrum Dominance Revenue | Reported | 7.90 Bil | ||||||
| 2026 Missile Solutions Revenue | Reported | 4.10 Bil | ||||||
| 2026 Space & Mission Systems Operating Margin | Reported | 10.5% | ||||||
| 2026 Communications & Spectrum Dominance Operating Margin | Reported | 25.5% | ||||||
| 2026 Missile Solutions Operating Margin | Reported | 12.0% | ||||||
| 2026 Segment Operating Margin | Reported | 16.0% | ||||||
| 2026 Diluted EPS | Reported | 12.25 | 12.3 | 12.35 | 3.4% | Raised | Guidance: 11.9 for 2026 | |
| 2026 Capital Expenditures | Reported | 600.00 Mil | 0.0% | Affirmed | Guidance: 600.00 Mil for 2026 | |||
| 2026 Free Cash Flow | Reported | 3.00 Bil | 0.0% | Affirmed | Guidance: 3.00 Bil for 2026 | |||
Prior: Q2 2026 Earnings Reported 7/29/2026
| Forward Guidance | Guidance Change | |||||||
|---|---|---|---|---|---|---|---|---|
| Metric | Source | Low | Mid | High | % Chg | % Delta | Change | Prior |
| 2026 Net cash provided by operating activities | Reported | 3.60 Bil | 0.0% | Affirmed | Guidance: 3.60 Bil for 2026 | |||
| 2026 Revenue | Reported | 23.20 Bil | 23.45 Bil | 23.70 Bil | 0.9% | Raised | Guidance: 23.25 Bil for 2026 | |
| 2026 EPS | Reported | 11.8 | 11.9 | 12 | 3.5% | Raised | Guidance: 11.5 for 2026 | |
| 2026 Capital Expenditures | Reported | 600.00 Mil | 0.0% | Affirmed | Guidance: 600.00 Mil for 2026 | |||
| 2026 Free Cash Flow | Reported | 3.00 Bil | 0.0% | Affirmed | Guidance: 3.00 Bil for 2026 | |||
Q1 2026 Earnings Reported 4/30/2026
| Forward Guidance | Guidance Change | |||||||
|---|---|---|---|---|---|---|---|---|
| Metric | Source | Low | Mid | High | % Chg | % Delta | Change | Prior |
| 2026 Net cash provided by operating activities | Reported | 3.60 Bil | 0 | Affirmed | Guidance: 3.60 Bil for 2026 | |||
| 2026 Revenue | Reported | 23.00 Bil | 23.25 Bil | 23.50 Bil | 0 | Affirmed | Guidance: 23.25 Bil for 2026 | |
| 2026 Segment operating margin | Reported | 16.0% | ||||||
| 2026 Diluted EPS | Reported | 11.4 | 11.5 | 11.6 | 0.9% | 10.0% | Raised | Guidance: 11.4 for 2026 |
| 2026 Capital expenditures | Reported | 600.00 Mil | 0 | Affirmed | Guidance: 600.00 Mil for 2026 | |||
| 2026 Free cash flow | Reported | 3.00 Bil | 0 | Affirmed | Guidance: 3.00 Bil for 2026 | |||
Q4 2025 Earnings Reported 1/29/2026
| Forward Guidance | Guidance Change | |||||||
|---|---|---|---|---|---|---|---|---|
| Metric | Source | Low | Mid | High | % Chg | % Delta | Change | Prior |
| 2026 Net cash provided by operating activities | Reported | 3.60 Bil | ||||||
| 2026 Revenue | Reported | 23.00 Bil | 23.25 Bil | 23.50 Bil | 5.7% | Higher New | Guidance: 22.00 Bil for 2025 | |
| 2026 Diluted EPS | Reported | 11.3 | 11.4 | 11.5 | 7.5% | Higher New | Guidance: 10.6 for 2025 | |
| 2026 Capital expenditures | Reported | 600.00 Mil | ||||||
| 2026 Free cash flow | Reported | 3.00 Bil | 13.2% | Higher New | Guidance: 2.65 Bil for 2025 | |||
Insider Activity
Updated 8/3/2026| # | Owner | Title | Holding | Action | Filing Date | Price | Shares | Transacted Value | Value of Held Shares | Form |
|---|---|---|---|---|---|---|---|---|---|---|
| 1 | Rakita, Melanie | Vice President & CHRO | Direct | Sell | 5052026 | 310.45 | 2,180 | 676,781 | 1,301,559 | Form |
| 2 | Rakita, Melanie | Vice President & CHRO | Direct | Sell | 3022026 | 370.32 | 751 | 278,110 | 1,529,866 | Form |
| 3 | Mehta, Samir | Pres., Space & Mission Sys. | Direct | Sell | 3022026 | 370.32 | 5,528 | 2,047,129 | 2,872,228 | Form |
| 4 | Rambeau, Jon | Pres., Coms. & Spec. Dom. | Direct | Sell | 3022026 | 370.32 | 5,528 | 2,047,129 | 2,836,662 | Form |
| 5 | Rakita, Melanie | Vice President & CHRO | Direct | Sell | 3022026 | 341.45 | 2,378 | 811,968 | 1,667,027 | Form |
| # | Owner | Title | Holding | Action | Filing Date | Price | Shares | Transacted Value | Value of Held Shares | Form |
|---|---|---|---|---|---|---|---|---|---|---|
| 1 | Rakita, Melanie | Vice President & CHRO | Direct | Sell | 5052026 | 310.45 | 2,180 | 676,781 | 1,301,559 | Form |
| 2 | Rakita, Melanie | Vice President & CHRO | Direct | Sell | 3022026 | 370.32 | 751 | 278,110 | 1,529,866 | Form |
| 3 | Mehta, Samir | Pres., Space & Mission Sys. | Direct | Sell | 3022026 | 370.32 | 5,528 | 2,047,129 | 2,872,228 | Form |
| 4 | Rambeau, Jon | Pres., Coms. & Spec. Dom. | Direct | Sell | 3022026 | 370.32 | 5,528 | 2,047,129 | 2,836,662 | Form |
| 5 | Rakita, Melanie | Vice President & CHRO | Direct | Sell | 3022026 | 341.45 | 2,378 | 811,968 | 1,667,027 | Form |
| 6 | Mehta, Samir | Pres., Space & Missions Sys. | Direct | Sell | 2062026 | 338.85 | 4,840 | 1,640,034 | 2,004,660 | Form |
| 7 | Kubasik, Christopher E | Chair and CEO | Direct | Sell | 11142025 | 301.05 | 14,171 | 4,266,180 | 43,479,447 | Form |
| 8 | Kubasik, Christopher E | Chair and CEO | Direct | Sell | 9122025 | 279.90 | 83,000 | 23,231,700 | 40,747,232 | Form |
| 9 | Kubasik, Christopher E | Chair and CEO | Direct | Sell | 8122025 | 269.52 | 40,138 | 10,817,994 | 39,236,134 | Form |
Investor Activity (13F)
Updated Nov 4, 2026Active managers (13F portfolio over $250M, at least 3 holdings) with a position over $5M that is either over 10% of their portfolio or held in a concentrated book of 50 or fewer total positions. Index/ETF, sovereign, bank, community-bank and charitable/donor-advised filers are excluded.
| Active Manager | Value | % of Portfolio | Total Positions | QoQ | Filing |
|---|---|---|---|---|---|
| FengHe Fund Management Pte. Ltd. | $35.2 Mil | 4.9% | 31 | TRIM -62.3% | 13F |
| Castle Hook Partners LP | $232.7 Mil | 4.7% | 44 | New | 13F |
| Focused Investors LLC | $108.5 Mil | 3.5% | 22 | TRIM -28.1% | 13F |
| Martin Investment Management, LLC | $10.2 Mil | 3.0% | 46 | Hold | 13F |
| Element Capital Management LLC | $6.0 Mil | 2.4% | 34 | New | 13F |
| Shapiro Capital Management LLC | $24.7 Mil | 1.5% | 50 | TRIM -44.7% | 13F |
| Gladstone Capital Management LLP | $13.7 Mil | 1.4% | 32 | New | 13F |
| Appaloosa LP | $68.3 Mil | 1.2% | 31 | TRIM -32.9% | 13F |
| Hancock Prospecting Pty Ltd | $24.2 Mil | 0.7% | 36 | New | 13F |
| Active Manager | Value | % of Portfolio | Total Positions | QoQ | As Of | Filing |
|---|---|---|---|---|---|---|
| Benson Investment Management Company, Inc. | $6.4 Mil | 2.2% | 50 | Exited | Dec 31, 2025 | 13F |
| FengHe Fund Management Pte. Ltd. | $35.2 Mil | 4.9% | 31 | TRIM -62.3% | Mar 31, 2026 | 13F |
| Shapiro Capital Management LLC | $24.7 Mil | 1.5% | 50 | TRIM -44.7% | Mar 31, 2026 | 13F |
| Appaloosa LP | $68.3 Mil | 1.2% | 31 | TRIM -32.9% | Mar 31, 2026 | 13F |
| Focused Investors LLC | $108.5 Mil | 3.5% | 22 | TRIM -28.1% | Mar 31, 2026 | 13F |
| Active Manager | Value | % of Portfolio | Total Positions | QoQ | Filing |
|---|---|---|---|---|---|
| Castle Hook Partners LP | $232.7 Mil | 4.7% | 44 | New | 13F |
| Focused Investors LLC | $108.5 Mil | 3.5% | 22 | TRIM -28.1% | 13F |
| Appaloosa LP | $68.3 Mil | 1.2% | 31 | TRIM -32.9% | 13F |
| FengHe Fund Management Pte. Ltd. | $35.2 Mil | 4.9% | 31 | TRIM -62.3% | 13F |
| Shapiro Capital Management LLC | $24.7 Mil | 1.5% | 50 | TRIM -44.7% | 13F |
| Hancock Prospecting Pty Ltd | $24.2 Mil | 0.7% | 36 | New | 13F |
| Gladstone Capital Management LLP | $13.7 Mil | 1.4% | 32 | New | 13F |
| Martin Investment Management, LLC | $10.2 Mil | 3.0% | 46 | Hold | 13F |
| Element Capital Management LLC | $6.0 Mil | 2.4% | 34 | New | 13F |
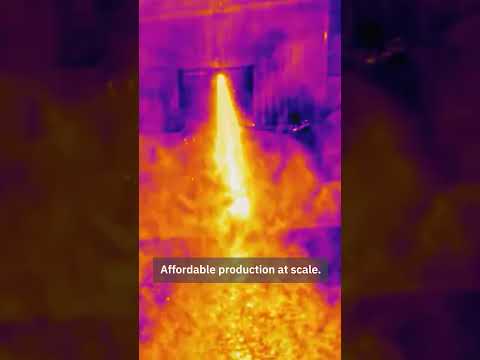
L3Harris Technologies — Investor Video Playlist




Industry Resources
| Industrials Resources |
| IndustryWeek |
| Manufacturing.net |
| Aviation Week |
| Aerospace & Defense Resources |
| Defense News |
| FlightGlobal |
External Quote Links
| Y Finance | Barrons |
| TradingView | Morningstar |
| SeekingAlpha | ValueLine |
| Motley Fool | Robinhood |
| CNBC | Etrade |
| MarketWatch | Unusual Whales |
| YCharts | Perplexity Finance |
| FinViz |
Prefer one of these to Trefis? Tell us why.