
Twin Vee PowerCats Co (VEEE)
Market Price (10/17/2026): $9.88 | Market Cap: $5.6 MilSector: Consumer Discretionary | Industry: Leisure Products
Twin Vee PowerCats Co (VEEE)
Market Price (10/17/2026): $9.88Market Cap: $5.6 MilSector: Consumer DiscretionaryIndustry: Leisure Products
Investment Highlights Why It Matters Detailed financial logic regarding cash flow yields vs trend-riding momentum.
Cash is significant % of market capNet D/ENet Debt/Equity. Debt net of cash. Negative indicates net cash. Equity is taken as the Market Capitalization is -11% Megatrend and thematic driversMegatrends include Experience Economy & Premiumization, and Electrification of Everything. Themes include Travel & Leisure Tech, and Electric Marine Propulsion. | Weak multi-year price returns2Y Excs Rtn is -129%, 3Y Excs Rtn is -176% Meaningful short interestShort Interest % of Basic SharesShort Interest % of Basic Shares = (Short Interest Quantity) / (Basic Shares Outstanding). A high fraction of short interest can indicate potential risk of a short squeeze. is 10% | Not profitable at operating income levelOp Inc LTMOperating Income, Last Twelve Months is -9.4 Mil, Op Mgn LTMOperating Margin = Operating Income / Revenue Reflects profitability before taxes and before impact of capital structure (interest payments). is -69% Weak revenue growthRev Chg 3Y AvgRevenue Change % averaged over trailing 3 years is -24%, Rev Chg QQuarterly Revenue Change % is -34% Not cash flow generativeCFO/Rev LTMCash Flow from Operations / Revenue (Sales), Last Twelve Months (LTM) is -57%, FCF/Rev LTMFree Cash Flow / Revenue (Sales), Last Twelve Months (LTM) is -63% Valuation getting more expensiveP/S 6M Chg %Price/Sales change over 6 months. Declining P/S indicates valuation has become less expensive. is 319% Yield minus risk free rate is negativeERPEquity Risk Premium (ERP) = Total Yield - Risk Free Rate, Reflects the premium above risk free assets offered by the investment. is -184% High stock price volatilityVol 12M is 456% Key risksVEEE key risks include [1] persistent financial losses and a high risk of bankruptcy, Show more. |
| Cash is significant % of market capNet D/ENet Debt/Equity. Debt net of cash. Negative indicates net cash. Equity is taken as the Market Capitalization is -11% |
| Megatrend and thematic driversMegatrends include Experience Economy & Premiumization, and Electrification of Everything. Themes include Travel & Leisure Tech, and Electric Marine Propulsion. |
| Weak multi-year price returns2Y Excs Rtn is -129%, 3Y Excs Rtn is -176% |
| Meaningful short interestShort Interest % of Basic SharesShort Interest % of Basic Shares = (Short Interest Quantity) / (Basic Shares Outstanding). A high fraction of short interest can indicate potential risk of a short squeeze. is 10% |
| Not profitable at operating income levelOp Inc LTMOperating Income, Last Twelve Months is -9.4 Mil, Op Mgn LTMOperating Margin = Operating Income / Revenue Reflects profitability before taxes and before impact of capital structure (interest payments). is -69% |
| Weak revenue growthRev Chg 3Y AvgRevenue Change % averaged over trailing 3 years is -24%, Rev Chg QQuarterly Revenue Change % is -34% |
| Not cash flow generativeCFO/Rev LTMCash Flow from Operations / Revenue (Sales), Last Twelve Months (LTM) is -57%, FCF/Rev LTMFree Cash Flow / Revenue (Sales), Last Twelve Months (LTM) is -63% |
| Valuation getting more expensiveP/S 6M Chg %Price/Sales change over 6 months. Declining P/S indicates valuation has become less expensive. is 319% |
| Yield minus risk free rate is negativeERPEquity Risk Premium (ERP) = Total Yield - Risk Free Rate, Reflects the premium above risk free assets offered by the investment. is -184% |
| High stock price volatilityVol 12M is 456% |
| Key risksVEEE key risks include [1] persistent financial losses and a high risk of bankruptcy, Show more. |
Qualitative Assessment
AI Analysis | Feedback
Twin Vee PowerCats Co (VEEE) stock has gained about 95% since 6/30/2026 because of the following key factors:
1. Announced Merger and Strategic Shift to Mineral Exploration. Twin Vee PowerCats Co. (VEEE) entered into a definitive merger agreement with USFM Corporation in July 2026, signifying a transformative pivot from recreational marine products to a critical mineral exploration entity in Greenland. This transaction, initially projected to close in fiscal Q3 2026 and subsequently revised to fiscal Q4 2026 or fiscal Q1 2027, stipulated that Twin Vee stockholders would receive equity in the combined public company and contingent value rights tied to the privatized marine business, generating substantial investor interest in this new strategic direction. The stock experienced an initial surge of 28% following the announcement in July 2026.
2. Extremely Low Share Float Post-Reverse Stock Split. A 1-for-37 reverse stock split, which became effective on May 4, 2026, dramatically reduced the number of outstanding shares to approximately 574,500. This ultra-low float environment created significant mechanical vulnerability, allowing even minor buying pressure to trigger amplified and explosive price movements, independent of fundamental value.
Show more
Twin Vee PowerCats Co (VEEE) stock has gained about 95% since 6/30/2026 because of the following key factors:
1. Announced Merger and Strategic Shift to Mineral Exploration. Twin Vee PowerCats Co. (VEEE) entered into a definitive merger agreement with USFM Corporation in July 2026, signifying a transformative pivot from recreational marine products to a critical mineral exploration entity in Greenland. This transaction, initially projected to close in fiscal Q3 2026 and subsequently revised to fiscal Q4 2026 or fiscal Q1 2027, stipulated that Twin Vee stockholders would receive equity in the combined public company and contingent value rights tied to the privatized marine business, generating substantial investor interest in this new strategic direction. The stock experienced an initial surge of 28% following the announcement in July 2026.
2. Extremely Low Share Float Post-Reverse Stock Split. A 1-for-37 reverse stock split, which became effective on May 4, 2026, dramatically reduced the number of outstanding shares to approximately 574,500. This ultra-low float environment created significant mechanical vulnerability, allowing even minor buying pressure to trigger amplified and explosive price movements, independent of fundamental value.
3. Speculative Investor Sentiment Driven by Merger Anticipation. Despite the company reporting a substantial year-over-year revenue decline of 34% and a widened net loss of $2.9 million for fiscal Q2 2026, the stock's significant gains were primarily fueled by speculative capital anticipating the closing of the USFM merger. This event-driven trading culminated in the stock surging over 100% on September 21, 2026, highlighting the market's focus on the corporate transaction as the key catalyst rather than current financial performance. The amended merger agreement in October 2026, which adjusted the ownership split and delayed the closing timeframe, continued to contribute to the ongoing speculative dynamics surrounding the transaction.
Show less
Stock Movement Drivers
Fundamental Drivers
The 94.0% change in VEEE stock from 6/30/2026 to 10/16/2026 was primarily driven by a 666.6% change in the company's P/S Multiple.| (LTM values as of) | 6302026 | 10162026 | Change |
|---|---|---|---|
| Stock Price ($) | 5.19 | 10.07 | 94.0% |
| Change Contribution By: | |||
| Total Revenues ($ Mil) | 15 | 14 | -10.7% |
| P/S Multiple | 0.1 | 0.4 | 666.6% |
| Shares Outstanding (Mil) | 0 | 1 | -71.7% |
| Cumulative Contribution | 94.0% |
Market Drivers
6/30/2026 to 10/16/2026| Return | Correlation | |
|---|---|---|
| VEEE | 94.0% | |
| Market (SPY) | 2.2% | -12.1% |
| Sector (XLY) | -4.1% | -4.2% |
Fundamental Drivers
The 6.0% change in VEEE stock from 3/31/2026 to 10/16/2026 was primarily driven by a 994.0% change in the company's P/S Multiple.| (LTM values as of) | 3312026 | 10162026 | Change |
|---|---|---|---|
| Stock Price ($) | 9.50 | 10.07 | 6.0% |
| Change Contribution By: | |||
| Total Revenues ($ Mil) | 15 | 14 | -8.6% |
| P/S Multiple | 0.0 | 0.4 | 994.0% |
| Shares Outstanding (Mil) | 0 | 1 | -89.4% |
| Cumulative Contribution | 6.0% |
Market Drivers
3/31/2026 to 10/16/2026| Return | Correlation | |
|---|---|---|
| VEEE | 6.0% | |
| Market (SPY) | 17.7% | -7.6% |
| Sector (XLY) | 3.4% | -2.0% |
Fundamental Drivers
The -90.1% change in VEEE stock from 9/30/2025 to 10/16/2026 was primarily driven by a -91.0% change in the company's Shares Outstanding (Mil).| (LTM values as of) | 9302025 | 10162026 | Change |
|---|---|---|---|
| Stock Price ($) | 101.38 | 10.07 | -90.1% |
| Change Contribution By: | |||
| Total Revenues ($ Mil) | 13 | 14 | 3.0% |
| P/S Multiple | 0.4 | 0.4 | 7.3% |
| Shares Outstanding (Mil) | 0 | 1 | -91.0% |
| Cumulative Contribution | -90.1% |
Market Drivers
9/30/2025 to 10/16/2026| Return | Correlation | |
|---|---|---|
| VEEE | -90.1% | |
| Market (SPY) | 15.5% | -4.6% |
| Sector (XLY) | -5.6% | -0.4% |
Fundamental Drivers
The -98.0% change in VEEE stock from 9/30/2023 to 10/16/2026 was primarily driven by a -95.5% change in the company's Shares Outstanding (Mil).| (LTM values as of) | 9302023 | 10162026 | Change |
|---|---|---|---|
| Stock Price ($) | 503.20 | 10.07 | -98.0% |
| Change Contribution By: | |||
| Total Revenues ($ Mil) | 35 | 14 | -60.8% |
| P/S Multiple | 0.4 | 0.4 | 13.4% |
| Shares Outstanding (Mil) | 0 | 1 | -95.5% |
| Cumulative Contribution | -98.0% |
Market Drivers
9/30/2023 to 10/16/2026| Return | Correlation | |
|---|---|---|
| VEEE | -98.0% | |
| Market (SPY) | 84.7% | 3.5% |
| Sector (XLY) | 42.9% | 4.4% |
Price Returns Compared
| 2021 | 2022 | 2023 | 2024 | 2025 | 2026 | Total [1] | |
|---|---|---|---|---|---|---|---|
| Returns | |||||||
| VEEE Return | -46% | -54% | -22% | -61% | -68% | -84% | -100% |
| Peers Return | 32% | -26% | 13% | -26% | -6% | 23% | -6% |
| S&P 500 Return | 27% | -19% | 24% | 23% | 16% | 14% | 108% |
Monthly Win Rates [3] | |||||||
| VEEE Win Rate | 33% | 33% | 42% | 25% | 25% | 30% | |
| Peers Win Rate | 62% | 42% | 52% | 48% | 46% | 52% | |
| S&P 500 Win Rate | 75% | 42% | 67% | 75% | 67% | 50% | |
Max Drawdowns [4] | |||||||
| VEEE Max Drawdown | - | -79% | -47% | -79% | -79% | -94% | |
| Peers Max Drawdown | -28% | -40% | -34% | -36% | -39% | -30% | |
| S&P 500 Max Drawdown | -5% | -25% | -10% | -8% | -19% | -9% | |
[1] Cumulative total returns since the beginning of 2021
[2] Peers: BC, MBUU, MCFT, HZO.
[3] Win Rate = % of calendar months in which monthly returns were positive
[4] Max drawdown represents maximum peak-to-trough decline within a year
[5] 2026 data is for the year up to 10/16/2026 (YTD)
How Low Can It Go
| Event | VEEE | S&P 500 |
|---|---|---|
| 2025 US Tariff Shock | ||
| % Loss | -47.3% | -18.8% |
| % Gain to Breakeven | 89.7% | 23.1% |
| Time to Breakeven | 17 days | 79 days |
| 2024 Yen Carry Trade Unwind | ||
| % Loss | -37.0% | -7.8% |
| % Gain to Breakeven | 58.8% | 8.5% |
| Time to Breakeven | 33 days | 18 days |
| 2023 SVB Regional Banking Crisis | ||
| % Loss | -39.7% | -6.7% |
| % Gain to Breakeven | 65.9% | 7.1% |
| Time to Breakeven | 38 days | 31 days |
In The Past
Twin Vee PowerCats Co's stock fell -47.3% during the 2025 US Tariff Shock. Such a loss loss requires a 89.7% gain to breakeven.
Preserve Wealth
Limiting losses and compounding gains is essential to preserving wealth.
Asset Allocation
Actively managed asset allocation strategies protect wealth. Learn more.
| Event | VEEE | S&P 500 |
|---|---|---|
| 2025 US Tariff Shock | ||
| % Loss | -47.3% | -18.8% |
| % Gain to Breakeven | 89.7% | 23.1% |
| Time to Breakeven | 17 days | 79 days |
| 2024 Yen Carry Trade Unwind | ||
| % Loss | -37.0% | -7.8% |
| % Gain to Breakeven | 58.8% | 8.5% |
| Time to Breakeven | 33 days | 18 days |
| 2023 SVB Regional Banking Crisis | ||
| % Loss | -39.7% | -6.7% |
| % Gain to Breakeven | 65.9% | 7.1% |
| Time to Breakeven | 38 days | 31 days |
In The Past
Twin Vee PowerCats Co's stock fell -47.3% during the 2025 US Tariff Shock. Such a loss loss requires a 89.7% gain to breakeven.
Preserve Wealth
Limiting losses and compounding gains is essential to preserving wealth.
Asset Allocation
Actively managed asset allocation strategies protect wealth. Learn more.
About Twin Vee PowerCats Co (VEEE)
Twin Vee PowerCats Co. (VEEE) designs, manufactures, and markets power catamaran boats for both recreational and commercial use. Based in Fort Pierce, Florida, the company offers a range of vessels, segmented by their propulsion type into gas-powered and electric-powered boats. Their catamarans cater to diverse activities, allowing consumers to engage in recreational pursuits such as fishing, diving, and water skiing, while also serving commercial needs like transportation, eco-tours, and specialized fishing and diving expeditions.
The company's main products are these unique catamaran boats, and it is actively engaged in developing new fully electric and advanced gas-powered models to expand its offerings. Twin Vee distributes its products through an established network of 19 independent boat dealers. These dealers primarily serve the company's customer base across North America and the Caribbean, making these regions its key markets.
```AI Analysis | Feedback
- Think of them as a "Rivian for catamaran boats," though they also offer traditional gas-powered models.
- A specialized boat manufacturer, akin to a smaller Brunswick (BC) that focuses exclusively on catamaran designs.
AI Analysis | Feedback
- Gas-Powered Catamaran Boats: These recreational and commercial power boats are propelled by traditional internal combustion engines.
- Electric-Powered Catamaran Boats: These recreational and commercial power boats are propelled by electric motors.
AI Analysis | Feedback
Twin Vee PowerCats Co. (VEEE) sells its boats primarily to other companies, specifically a network of 19 independent boat dealers located in North America and the Caribbean. These independent boat dealers are the company's direct major customers.
The provided background information does not identify specific names of these independent boat dealers, nor does it indicate if any single dealer constitutes a major customer requiring individual disclosure.
AI Analysis | Feedback
- Brunswick Corporation (BC)
- Suzuki Motor Corporation (SZKMY)
AI Analysis | Feedback
Joseph C. Visconti, Chairman of the Board, President, and Chief Executive Officer
Mr. Visconti has served as the Company's Chief Executive Officer and Chairman of the Board since 2015. He was President from 2015 to 2024 and was reappointed President in January 2025. With over 25 years of executive-level operational and financial experience, Mr. Visconti was the founder, CEO, and President of two previous companies: a regional Investment Bank he built to over 400 employees and sold in 2000, and ValueRich, a financial media company that went public on the American Stock Exchange in 2007. ValueRich transitioned into Twin Vee PowerCats, Inc. in 2015. He also founded Forza X1 in 2021, an electric boat company that he took public on NASDAQ.
Michael P. Dickerson, Interim Chief Financial Officer
Mr. Dickerson has served as the Interim Chief Financial Officer since July 2026. Previously, he was the Chief Financial & Administrative Officer from April 2024 through September 2025, after which he became a consultant to the Company. He possesses more than 35 years of corporate experience in senior and executive-level finance and operational roles, including finance & accounting, treasury, investor relations & corporate communications, and risk management. His experience spans multi-billion dollar publicly traded and private companies such as Dorman Products, Inc., Aaron's Inc., and Gannett Co., Inc. In February 2024, he served as Executive Vice President, Chief Financial & Administrative Officer, and Treasurer in a consulting capacity at Savannah River Logistics.
Preston Yarborough, Vice President and Director
Mr. Yarborough contributes over 23 years of marine experience to the Twin Vee team. He holds a seat on the Board of Directors and has been instrumental in leading the design, development, and production of all of Twin Vee's boat models for several years.
Jay Foster, Chief Marketing Officer
Glenn Sonoda, Secretary and In-House Counsel
AI Analysis | Feedback
Key Risks to Twin Vee PowerCats Co. (VEEE)
- High uncertainty and execution risks associated with the fundamental business pivot from boat manufacturing to a critical minerals focus. The public company (VEEE) is undergoing a major transformation, divesting its legacy boat manufacturing business into a private trust and pivoting to a new and unrelated critical minerals venture via a merger with USFM Corporation. This introduces substantial execution risk, including the successful integration of the new business, market acceptance of the new focus, and the inherent challenges of operating in an entirely different industry. Shareholder dilution, where existing Twin Vee shareholders will hold only 7% of the post-merger entity, and potential legal challenges related to the complex merger structure further compound this risk.
- Persistent financial instability and operational challenges within the legacy marine business. Prior to the strategic pivot, Twin Vee PowerCats Co.'s marine operations experienced significant financial difficulties, including declining revenues, sustained operating losses, and consistent cash burn. Although this business is being spun off into a private trust, its historical performance underscores the reasons for the pivot and the potential for limited returns for current shareholders through the non-transferable contingent value rights (CVRs) tied to the marine operations. The marine industry itself has faced "economic challenges" and "declining demand."
- Extreme stock price volatility and speculative trading driven by the ongoing corporate transformation rather than fundamental business performance. The company's stock has exhibited significant volatility, with price movements largely driven by speculation surrounding the merger and the pivot into critical minerals, rather than the underlying financial strength of either the legacy or new business. A recent reverse stock split and a "tiny float" have contributed to "violent explosive squeezes," making the stock a highly speculative investment with the "very real possibility of a total loss if this complex merger falls through."
AI Analysis | Feedback
AI Analysis | Feedback
Twin Vee PowerCats Co. (VEEE) operates in the recreational and commercial power catamaran boat market, with products including both gas-powered and electric-powered vessels. The company primarily serves North America and the Caribbean. Here's an overview of the addressable market sizes for their main products:
North American Market
- Powered Catamaran Market (Recreational and Commercial): The North American market for powered catamarans was valued at approximately USD 1.6 billion in 2025 and is projected to grow to USD 3.2 billion by 2035, exhibiting a compound annual growth rate (CAGR) of 7%. This market segment includes both recreational and commercial applications and is predominantly comprised of gas-powered vessels, with increasing integration of electric propulsion systems.
- Electric Boat Market (including Electric-Powered Catamarans): The North American electric boat market was valued at USD 1.6 billion in 2024, representing a substantial portion of the global market. It is expected to reach USD 3.80 billion by 2027, growing at a CAGR of 12.7% during the forecast period of 2025-2032.
Caribbean Market
Specific market size figures in USD for recreational and commercial power catamaran boats, or electric boats, within the Caribbean region are not available from the search results.
AI Analysis | Feedback
Twin Vee PowerCats Co. (VEEE) is expected to drive future revenue growth over the next 2-3 years through several key initiatives:
- Expansion of Dealer Network: The company aims to expand its network of independent boat dealers both domestically and internationally. This strategic effort is focused on recruiting high-quality dealers and distributors to broaden the reach and distribution of its recreational and commercial power catamaran boats.
- Launch of New Products and Expanded Model Lineup: Twin Vee PowerCats Co. is committed to introducing new boat models and expanding its existing product lines. This includes plans to relaunch the Bahama Boats brand with a comprehensive model lineup, ranging from 21 feet to 41 feet and potentially larger, as part of its ongoing product development and digital initiatives.
- Strategic Partnership with Mercury Marine: A significant driver of growth is the strategic partnership with Mercury Marine. This collaboration is intended to bolster the relaunch and expansion of the Bahama Boats brand by leveraging Mercury's strong engine brand and product innovation, thereby enhancing the appeal and performance of Twin Vee's offerings.
- Increased Production Capacity: Twin Vee PowerCats Co. has invested in its manufacturing capabilities, operating a 100,000 square foot facility capable of producing up to 700 units annually, depending on the model mix. This increased production capacity positions the company to meet anticipated growth in demand and support its expansion strategies.
- Improved Retail Demand and Dealer Restocking: The company has observed a return to year-over-year revenue growth, with improved retail demand and renewed dealer restocking in the latter half of 2025. This positive market trend, following a reduction in elevated field inventory levels, indicates a favorable environment for increased sales volume.
AI Analysis | Feedback
Share Issuance
- In early 2026, Twin Vee PowerCats Co. completed three equity offerings, resulting in net proceeds of $5,800,025 from the issuance of 468,863 shares.
- Following a 1-for-10 reverse stock split effective April 7, 2025, the company conducted a May underwritten offering of 750,000 shares at $4.00 per share, yielding $2,555,101 in net proceeds.
- For the three months ended March 31, 2026, the company recorded proceeds from the issuance of common stock, net of fees, totaling $1,392,615.
Inbound Investments
- As part of an amended merger agreement with USFM Corporation in October 2026, USFM is required to use reasonable best efforts to seek to close an up to $5 million private investment in public equity (PIPE) financing.
Capital Expenditures
- Twin Vee PowerCats Co. invested $127,000 in capital expenditures during Q2 2026, primarily for funding long-term assets and infrastructure.
- This Q2 2026 capital expenditure represents an 82.1% decrease from the same quarter in the prior year.
- The company's capital expenditures for the twelve months ended June 30, 2026, were approximately $856,154.
Peer Outperformance in Leisure Products
| Industry | Names | 1Y med | 3Y med | 5Y med | Top 3 by 5Y |
|---|---|---|---|---|---|
| Education Services | 14 | -18.3% | 78.7% | 87.5% | CVSA 248% · PRDO 232% · LRN 140% |
| Homebuilding | 18 | -7.8% | 31.8% | 44.6% | GRBK 187% · PHM 146% · TOL 140% |
| Specialty Stores | 7 | 12.5% | 39.3% | 17.2% | ASO 51% · DKS 36% · FIVE 17% |
| Hotels, Resorts & Cruise Lines | 21 | 11.3% | 40.4% | 11.2% | RCL 233% · MAR 153% · HLT 142% |
| Home Furnishings | 3 | -5.3% | 45.2% | 1.7% | SGI 50% · MHK -35% |
| Home Improvement Retail | 5 | -17.8% | 5.8% | -0.8% | HD 0% · LOW -1% · FND -63% |
| Automotive Retail | 17 | -14.7% | 6.1% | -8.2% | MUSA 239% · PAG 132% · ORLY 113% |
| Footwear | 9 | 72.7% | 44.4% | -10.2% | DECK 44% · SHOO 19% · CROX -10% |
| Specialized Consumer Services | 10 | -13.6% | 22.1% | -12.1% | HRB 132% · FTDR 85% · SCI 42% |
| Distributors | 4 | -9.2% | -25.1% | -16.0% | ARMK 123% · GPC 22% · LKQ -54% |
| Restaurants | 36 | -5.8% | -7.5% | -18.4% | EAT 329% · CAKE 200% · TXRH 107% |
| Household Appliances | 17 | -4.2% | 20.4% | -36.6% | |
| Apparel Retail | 26 | 4.6% | 5.1% | -37.5% | ANF 291% · TJX 146% · ROST 130% |
| Leisure Facilities | 12 | 9.7% | -8.3% | -41.2% | LTH 139% · OSW 119% · PLNT -37% |
| Computer & Electronics Retail | 3 | 16.8% | 50.9% | -41.5% | BBY 3% · GME -41% |
| Leisure Products ← | 14 | -17.9% | -19.6% | -44.3% | GOLF 80% · HAS 31% · MAT -13% |
| Automotive Parts & Equipment | 39 | -13.1% | -19.5% | -47.1% | MOD 1130% · GTX 253% · BWA 51% |
| Apparel, Accessories & Luxury Goods | 29 | 0.2% | 12.1% | -47.4% | RL 258% · TPR 248% · KTB 77% |
| Broadline Retail | 13 | 9.6% | 28.0% | -48.3% | EBAY 75% · AMZN 47% · OLLI 41% |
| Casinos & Gaming | 20 | -12.3% | -27.5% | -50.5% | MCRI 87% · BYD 11% · RRR 9% |
| Automobile Manufacturers | 8 | -74.5% | -54.7% | -77.1% | GM 51% · TSLA 26% · F 8% |
| Other Specialty Retail | 17 | -35.1% | -36.3% | -77.3% | ULTA 46% · TSCO -8% · BBWI -65% |
| Consumer Electronics | 11 | -31.6% | -34.4% | -78.5% | GRMN 102% · SONO -45% |
Latest Trefis Analyses
| Title | Date | |
|---|---|---|
| DASHBOARDS | ||
| Twin Vee PowerCats Earnings Notes | 12/16/2025 | |
| Can Twin Vee PowerCats Stock Hold Up When Markets Turn? | 10/17/2025 |
| Title | |
|---|---|
| ARTICLES |
Research & Analysis
Invest in Strategies
Wealth Management
Peer Comparisons
| Peers to compare with: |
Financials
| Median | |
|---|---|
| Name | |
| Mkt Price | 22.25 |
| Mkt Cap | 0.8 |
| Rev LTM | 1,555 |
| Op Inc LTM | 35 |
| FCF LTM | 110 |
| FCF 3Y Avg | 11 |
| CFO LTM | 143 |
| CFO 3Y Avg | 60 |
Growth & Margins
| Median | |
|---|---|
| Name | |
| Rev Chg LTM | 6.7% |
| Rev Chg 3Y Avg | -7.5% |
| Rev Chg Q | 0.3% |
| QoQ Delta Rev Chg LTM | -0.0% |
| Op Inc Chg LTM | -17.4% |
| Op Inc Chg 3Y Avg | -28.0% |
| Op Mgn LTM | 1.7% |
| Op Mgn 3Y Avg | 3.6% |
| QoQ Delta Op Mgn LTM | 0.3% |
| CFO/Rev LTM | 8.3% |
| CFO/Rev 3Y Avg | 4.9% |
| FCF/Rev LTM | 5.4% |
| FCF/Rev 3Y Avg | 1.2% |
Segment Financials
Revenue by Segment| $ Mil | 2025 | 2024 | 2023 | 2022 | 2021 |
|---|---|---|---|---|---|
| Twin Vee PowerCats, which designs, manufactures, and sells recreational and commercial powerboats | 15 | 14 | |||
| Electric Boat and Development | 0 | ||||
| Franchise | 0 | -0 | 0 | ||
| Gas-powered Boats | 33 | 32 | 16 | ||
| Total | 15 | 14 | 33 | 32 | 16 |
| $ Mil | 2023 | 2022 | 2021 |
|---|---|---|---|
| Franchise | -0 | -0 | -0 |
| Gas-powered Boats | -5 | -2 | -1 |
| Electric Boat and Development | -7 | -4 | -0 |
| Total | -12 | -6 | -2 |
| $ Mil | 2023 | 2022 | 2021 |
|---|---|---|---|
| Franchise | -0 | -0 | -0 |
| Gas-powered Boats | -4 | -2 | -0 |
| Electric Boat and Development | -6 | -4 | -0 |
| Total | -10 | -6 | -1 |
Price Behavior
| Market Price | $10.07 | |
| Market Cap ($ Bil) | 0.0 | |
| First Trading Date | 07/21/2021 | |
| Distance from 52W High | -89.8% | |
| 50 Days | 200 Days | |
| DMA Price | $10.52 | $18.22 |
| DMA Trend | down | down |
| Distance from DMA | -4.3% | -44.7% |
| 3M | 1YR | |
| Volatility | 206.9% | 455.7% |
| Downside Capture | 589.15 | 52.81 |
| Upside Capture | -348.61 | -223.04 |
| Correlation (S&P 500) | 6.6% | -5.8% |
| 1M | 2M | 3M | 6M | 1Y | 3Y | |
|---|---|---|---|---|---|---|
| Beta | 2.42 | 0.16 | -10.41 | -4.06 | -1.69 | 0.68 |
| Up Beta | 3.12 | -0.30 | -3.78 | -0.19 | 0.41 | 1.03 |
| Down Beta | 45.69 | 31.93 | -19.94 | -5.36 | -1.49 | 1.24 |
| Up Capture | -37% | -170% | -146% | -58% | -61% | -2% |
| Bmk +ve Days | 6 | 16 | 27 | 66 | 132 | 424 |
| Stock +ve Days | 7 | 15 | 23 | 49 | 89 | 301 |
| Down Capture | -316% | -343% | -1540% | -361% | 63% | 109% |
| Bmk -ve Days | 16 | 26 | 37 | 60 | 120 | 328 |
| Stock -ve Days | 14 | 26 | 40 | 75 | 157 | 419 |
[1] Upside and downside betas calculated using positive and negative benchmark daily returns respectively
Based On 1-Year Data
| Annualized Return | Annualized Volatility | Sharpe Ratio | Correlation with VEEE | |
|---|---|---|---|---|
| VEEE | -93.3% | 451.4% | 0.28 | - |
| Sector ETF (XLY) | -3.6% | 19.2% | -0.32 | -1.1% |
| Equity (SPY) | 15.8% | 12.7% | 0.86 | -5.4% |
| Gold (GLD) | -1.4% | 29.4% | -0.05 | -10.8% |
| Commodities (DBC) | 50.4% | 20.7% | 1.86 | 11.1% |
| Real Estate (VNQ) | 4.8% | 13.7% | 0.09 | 4.2% |
| Bitcoin (BTCUSD) | -25.9% | 43.6% | -0.57 | -6.2% |
Smart multi-asset allocation framework can stack odds in your favor. Learn How
Based On 5-Year Data
| Annualized Return | Annualized Volatility | Sharpe Ratio | Correlation with VEEE | |
|---|---|---|---|---|
| VEEE | -66.4% | 239.1% | 0.12 | - |
| Sector ETF (XLY) | 5.1% | 24.1% | 0.17 | 6.5% |
| Equity (SPY) | 13.2% | 17.1% | 0.59 | 6.3% |
| Gold (GLD) | 18.4% | 18.9% | 0.79 | -6.2% |
| Commodities (DBC) | 9.6% | 19.5% | 0.37 | 7.4% |
| Real Estate (VNQ) | 1.6% | 18.8% | -0.02 | 6.6% |
| Bitcoin (BTCUSD) | 8.8% | 51.8% | 0.35 | 3.5% |
Smart multi-asset allocation framework can stack odds in your favor. Learn How
Based On 10-Year Data
| Annualized Return | Annualized Volatility | Sharpe Ratio | Correlation with VEEE | |
|---|---|---|---|---|
| VEEE | -46.1% | 234.6% | 0.06 | - |
| Sector ETF (XLY) | 12.0% | 22.2% | 0.49 | 6.7% |
| Equity (SPY) | 15.2% | 17.9% | 0.72 | 6.5% |
| Gold (GLD) | 12.3% | 16.4% | 0.61 | -6.1% |
| Commodities (DBC) | 8.1% | 18.1% | 0.36 | 7.6% |
| Real Estate (VNQ) | 5.2% | 20.7% | 0.21 | 6.7% |
| Bitcoin (BTCUSD) | 63.2% | 66.2% | 1.03 | 3.3% |
Smart multi-asset allocation framework can stack odds in your favor. Learn How
Returns Analyses
Earnings Returns History
Updated 10/8/2026| Forward Returns | |||
|---|---|---|---|
| Earnings Date | 1D Returns | 5D Returns | 21D Returns |
| 8/12/2025 | 1.5% | -0.5% | 24.3% |
| 5/8/2025 | -53.8% | -66.8% | -66.6% |
| 8/14/2024 | -6.0% | -1.7% | 28.7% |
| 5/15/2024 | 4.6% | 1.7% | 24.7% |
| 3/27/2024 | -17.3% | -11.7% | -27.6% |
| 11/13/2023 | 0.8% | 7.0% | 10.1% |
| 8/14/2023 | -5.8% | -14.6% | -25.2% |
| 5/16/2023 | 0.0% | 2.5% | 25.6% |
| ... | |||
| SUMMARY STATS | |||
| # Positive | 5 | 5 | 5 |
| # Negative | 9 | 9 | 9 |
| Median Positive | 0.8% | 2.5% | 24.7% |
| Median Negative | -6.0% | -6.0% | -18.0% |
| Max Positive | 4.6% | 7.0% | 28.7% |
| Max Negative | -53.8% | -66.8% | -66.6% |
| Forward Returns | |||
|---|---|---|---|
| Earnings Date | 1D Returns | 5D Returns | 21D Returns |
| 8/12/2025 | 1.5% | -0.5% | 24.3% |
| 5/8/2025 | -53.8% | -66.8% | -66.6% |
| 8/14/2024 | -6.0% | -1.7% | 28.7% |
| 5/15/2024 | 4.6% | 1.7% | 24.7% |
| 3/27/2024 | -17.3% | -11.7% | -27.6% |
| 11/13/2023 | 0.8% | 7.0% | 10.1% |
| 8/14/2023 | -5.8% | -14.6% | -25.2% |
| 5/16/2023 | 0.0% | 2.5% | 25.6% |
| 3/29/2023 | -4.4% | -4.4% | -18.0% |
| 11/9/2022 | -8.7% | 1.4% | -7.8% |
| 8/15/2022 | -7.3% | -17.0% | -46.7% |
| 5/12/2022 | -1.6% | 2.5% | -8.4% |
| 11/15/2021 | 0.8% | -6.0% | -16.2% |
| 8/24/2021 | -1.7% | -2.0% | -15.4% |
| SUMMARY STATS | |||
| # Positive | 5 | 5 | 5 |
| # Negative | 9 | 9 | 9 |
| Median Positive | 0.8% | 2.5% | 24.7% |
| Median Negative | -6.0% | -6.0% | -18.0% |
| Max Positive | 4.6% | 7.0% | 28.7% |
| Max Negative | -53.8% | -66.8% | -66.6% |
SEC Filings
Expand for More| Report Date | Filing Date | Filing |
|---|---|---|
| 06/30/2026 | 08/06/2026 | 10-Q |
| 03/31/2026 | 05/07/2026 | 10-Q |
| 12/31/2025 | 02/27/2026 | 10-K |
| 09/30/2025 | 11/06/2025 | 10-Q |
| 06/30/2025 | 08/07/2025 | 10-Q |
| 03/31/2025 | 05/08/2025 | 10-Q |
| 12/31/2024 | 03/20/2025 | 10-K |
| 09/30/2024 | 11/14/2024 | 10-Q |
| 06/30/2024 | 08/14/2024 | 10-Q |
| 03/31/2024 | 05/15/2024 | 10-Q |
| 12/31/2023 | 03/27/2024 | 10-K |
| 09/30/2023 | 11/14/2023 | 10-Q |
| 06/30/2023 | 08/14/2023 | 10-Q |
| 03/31/2023 | 05/15/2023 | 10-Q |
| 12/31/2022 | 03/30/2023 | 10-K |
| 09/30/2022 | 11/09/2022 | 10-Q |
| Report Date | Filing Date | Filing |
|---|---|---|
| 06/30/2026 | 08/06/2026 | 10-Q |
| 03/31/2026 | 05/07/2026 | 10-Q |
| 12/31/2025 | 02/27/2026 | 10-K |
| 09/30/2025 | 11/06/2025 | 10-Q |
| 06/30/2025 | 08/07/2025 | 10-Q |
| 03/31/2025 | 05/08/2025 | 10-Q |
| 12/31/2024 | 03/20/2025 | 10-K |
| 09/30/2024 | 11/14/2024 | 10-Q |
| 06/30/2024 | 08/14/2024 | 10-Q |
| 03/31/2024 | 05/15/2024 | 10-Q |
| 12/31/2023 | 03/27/2024 | 10-K |
| 09/30/2023 | 11/14/2023 | 10-Q |
| 06/30/2023 | 08/14/2023 | 10-Q |
| 03/31/2023 | 05/15/2023 | 10-Q |
| 12/31/2022 | 03/30/2023 | 10-K |
| 09/30/2022 | 11/09/2022 | 10-Q |
| 06/30/2022 | 08/12/2022 | 10-Q |
| 03/31/2022 | 05/12/2022 | 10-Q |
| 12/31/2021 | 03/31/2022 | 10-K |
| 09/30/2021 | 11/15/2021 | 10-Q |
| 06/30/2021 | 08/24/2021 | 10-Q |
| 03/31/2021 | 07/22/2021 | 424B4 |
Insider Activity
Updated 7/29/2026| # | Owner | Title | Holding | Action | Filing Date | Price | Shares | Transacted Value | Value of Held Shares | Form |
|---|---|---|---|---|---|---|---|---|---|---|
| 1 | Hrt, Financial LP | Direct | Sell | 7292026 | 18.12 | 49,505 | 897,031 | 100,077 | Form | |
| 2 | Schuyler, Kevin | Direct | Buy | 3192026 | 0.41 | 25,000 | 10,165 | 12,707 | Form | |
| 3 | Swets, Larry G JR | Direct | Buy | 3182026 | 0.36 | 50,000 | 18,000 | 90,000 | Form | |
| 4 | Swets, Larry G JR | Direct | Buy | 3182026 | 0.38 | 50,000 | 19,000 | 76,000 | Form | |
| 5 | Swets, Larry G JR | Direct | Buy | 3132026 | 0.42 | 50,000 | 21,000 | 63,000 | Form |
| # | Owner | Title | Holding | Action | Filing Date | Price | Shares | Transacted Value | Value of Held Shares | Form |
|---|---|---|---|---|---|---|---|---|---|---|
| 1 | Hrt, Financial LP | Direct | Sell | 7292026 | 18.12 | 49,505 | 897,031 | 100,077 | Form | |
| 2 | Schuyler, Kevin | Direct | Buy | 3192026 | 0.41 | 25,000 | 10,165 | 12,707 | Form | |
| 3 | Swets, Larry G JR | Direct | Buy | 3182026 | 0.36 | 50,000 | 18,000 | 90,000 | Form | |
| 4 | Swets, Larry G JR | Direct | Buy | 3182026 | 0.38 | 50,000 | 19,000 | 76,000 | Form | |
| 5 | Swets, Larry G JR | Direct | Buy | 3132026 | 0.42 | 50,000 | 21,000 | 63,000 | Form | |
| 6 | Swets, Larry G JR | Direct | Buy | 2252026 | 0.47 | 100,000 | 47,000 | 47,000 | Form | |
| 7 | Visconti, Joseph C | CEO & Interim CFO | Direct | Buy | 2252026 | 0.47 | 20,000 | 9,400 | 123,570 | Form |
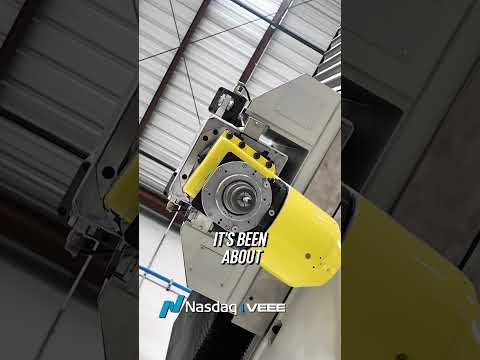
Twin Vee PowerCats Co — Investor Video Playlist





Industry Resources
| Consumer Discretionary Resources |
| Retail Dive |
| Business of Fashion (BoF) |
| WWD (Women's Wear Daily) |
| National Retail Federation (NRF) |
| McKinsey & Company - Consumer |
| Mintel Consumer Trends |
| Leisure Products Resources |
| The Toy Book |
| Bicycle Retailer |
| SGB Media |
External Quote Links
| Y Finance | Barrons |
| TradingView | Morningstar |
| SeekingAlpha | ValueLine |
| Motley Fool | Robinhood |
| CNBC | Etrade |
| MarketWatch | Unusual Whales |
| YCharts | Perplexity Finance |
| FinViz |
Prefer one of these to Trefis? Tell us why.