
Firefly Aerospace (FLY)
Market Price (10/16/2026): $17.91 | Market Cap: $2.9 BilSector: Industrials | Industry: Aerospace & Defense
Firefly Aerospace (FLY)
Market Price (10/16/2026): $17.91Market Cap: $2.9 BilSector: IndustrialsIndustry: Aerospace & Defense
Investment Highlights Why It Matters Detailed financial logic regarding cash flow yields vs trend-riding momentum.
Cash is significant % of market capNet D/ENet Debt/Equity. Debt net of cash. Negative indicates net cash. Equity is taken as the Market Capitalization is -21% Strong revenue growthRev Chg LTMRevenue Change % Last Twelve Months (LTM) is 179% Valuation becoming less expensiveP/S 6M Chg %Price/Sales change over 6 months. Declining P/S indicates valuation has become less expensive. is -62% Megatrend and thematic driversMegatrends include Advanced Aviation & Space. Themes include Commercial Space Exploration. | Weak multi-year price returns2Y Excs Rtn is -107%, 3Y Excs Rtn is -151% | Not profitable at operating income levelOp Inc LTMOperating Income, Last Twelve Months is -339 Mil, Op Mgn LTMOperating Margin = Operating Income / Revenue Reflects profitability before taxes and before impact of capital structure (interest payments). is -118% Expensive valuation multiplesP/SPrice/Sales ratio is 9.6x Significant share based compensationSBC/Rev LTMShare Based Compensation / Revenue (Sales), Last Twelve Months (LTM) is 16% Not cash flow generativeCFO/Rev LTMCash Flow from Operations / Revenue (Sales), Last Twelve Months (LTM) is -92%, FCF/Rev LTMFree Cash Flow / Revenue (Sales), Last Twelve Months (LTM) is -114% Yield minus risk free rate is negativeERPEquity Risk Premium (ERP) = Total Yield - Risk Free Rate, Reflects the premium above risk free assets offered by the investment. is -19% High stock price volatilityVol 12M is 108% Key risksFLY key risks include [1] its significant financial instability, Show more. |
| Cash is significant % of market capNet D/ENet Debt/Equity. Debt net of cash. Negative indicates net cash. Equity is taken as the Market Capitalization is -21% |
| Strong revenue growthRev Chg LTMRevenue Change % Last Twelve Months (LTM) is 179% |
| Valuation becoming less expensiveP/S 6M Chg %Price/Sales change over 6 months. Declining P/S indicates valuation has become less expensive. is -62% |
| Megatrend and thematic driversMegatrends include Advanced Aviation & Space. Themes include Commercial Space Exploration. |
| Weak multi-year price returns2Y Excs Rtn is -107%, 3Y Excs Rtn is -151% |
| Not profitable at operating income levelOp Inc LTMOperating Income, Last Twelve Months is -339 Mil, Op Mgn LTMOperating Margin = Operating Income / Revenue Reflects profitability before taxes and before impact of capital structure (interest payments). is -118% |
| Expensive valuation multiplesP/SPrice/Sales ratio is 9.6x |
| Significant share based compensationSBC/Rev LTMShare Based Compensation / Revenue (Sales), Last Twelve Months (LTM) is 16% |
| Not cash flow generativeCFO/Rev LTMCash Flow from Operations / Revenue (Sales), Last Twelve Months (LTM) is -92%, FCF/Rev LTMFree Cash Flow / Revenue (Sales), Last Twelve Months (LTM) is -114% |
| Yield minus risk free rate is negativeERPEquity Risk Premium (ERP) = Total Yield - Risk Free Rate, Reflects the premium above risk free assets offered by the investment. is -19% |
| High stock price volatilityVol 12M is 108% |
| Key risksFLY key risks include [1] its significant financial instability, Show more. |
Qualitative Assessment
AI Analysis | Feedback
Firefly Aerospace (FLY) stock has lost about 40% since 6/30/2026 because of the following key factors:
1. Persistent Net Losses Despite Revenue Growth in Fiscal Q2 2026. Although Firefly Aerospace reported significant year-over-year revenue growth of 659.2% to $117.68 million for fiscal Q2 2026, and beat analyst consensus estimates with an EPS of $-0.42, the company continued to operate at a net loss. Following the earnings report on August 11, 2026, the stock experienced a decline, suggesting that investors may be growing impatient with the company's sustained unprofitability despite increasing revenues and a $1.5 billion backlog as of June 30, 2026.
2. Delays and Reliability Concerns with Launch Vehicle Programs. Firefly Aerospace continues to face challenges and delays in its launch vehicle programs. The company's upgraded Alpha small-lift launch vehicle is now expected to have its first launch in fiscal Q4 2026. Additionally, a partnership with SSC Space for Alpha launches from the Esrange Space Center has seen its target date pushed back to 2028 from earlier plans. These ongoing delays and historical issues with launch reliability can erode investor confidence in future operational revenue and consistent mission execution.
Show more
Firefly Aerospace (FLY) stock has lost about 40% since 6/30/2026 because of the following key factors:
1. Persistent Net Losses Despite Revenue Growth in Fiscal Q2 2026. Although Firefly Aerospace reported significant year-over-year revenue growth of 659.2% to $117.68 million for fiscal Q2 2026, and beat analyst consensus estimates with an EPS of $-0.42, the company continued to operate at a net loss. Following the earnings report on August 11, 2026, the stock experienced a decline, suggesting that investors may be growing impatient with the company's sustained unprofitability despite increasing revenues and a $1.5 billion backlog as of June 30, 2026.
2. Delays and Reliability Concerns with Launch Vehicle Programs. Firefly Aerospace continues to face challenges and delays in its launch vehicle programs. The company's upgraded Alpha small-lift launch vehicle is now expected to have its first launch in fiscal Q4 2026. Additionally, a partnership with SSC Space for Alpha launches from the Esrange Space Center has seen its target date pushed back to 2028 from earlier plans. These ongoing delays and historical issues with launch reliability can erode investor confidence in future operational revenue and consistent mission execution.
3. Broad Negative Sentiment in the Speculative Space Sector. Firefly Aerospace's stock decline aligns with a broader trend of investor skepticism towards pre-revenue or consistently loss-making space and defense startups. Reports indicate a surge in shareholder lawsuits against such companies, reflecting a growing impatience among investors regarding their financial performance and continued need for capital. The stock's movement has been noted as similar to dips experienced by other space-related companies, indicating a sector-wide pressure rather than solely company-specific issues.
Show less
Stock Movement Drivers
Fundamental Drivers
nullnull
Market Drivers
6/30/2026 to 10/15/2026| Return | Correlation | |
|---|---|---|
| FLY | -42.1% | |
| Market (SPY) | 3.4% | 55.5% |
| Sector (XLI) | -9.8% | 45.2% |
Fundamental Drivers
nullnull
Market Drivers
3/31/2026 to 10/15/2026| Return | Correlation | |
|---|---|---|
| FLY | -40.2% | |
| Market (SPY) | 19.0% | 46.8% |
| Sector (XLI) | 3.5% | 32.6% |
Fundamental Drivers
nullnull
Market Drivers
9/30/2025 to 10/15/2026| Return | Correlation | |
|---|---|---|
| FLY | -42.0% | |
| Market (SPY) | 16.8% | 41.9% |
| Sector (XLI) | 9.3% | 36.6% |
Fundamental Drivers
nullnull
Market Drivers
9/30/2023 to 10/15/2026| Return | Correlation | |
|---|---|---|
| FLY | ||
| Market (SPY) | 86.7% | 38.8% |
| Sector (XLI) | 71.3% | 33.3% |
Price Returns Compared
| 2021 | 2022 | 2023 | 2024 | 2025 | 2026 | Total [1] | |
|---|---|---|---|---|---|---|---|
| Returns | |||||||
| FLY Return | - | - | - | - | -63% | -24% | -72% |
| Peers Return | 10% | 3% | -2% | 190% | 42% | -13% | 298% |
| S&P 500 Return | 27% | -19% | 24% | 23% | 16% | 14% | 108% |
Monthly Win Rates [3] | |||||||
| FLY Win Rate | - | - | - | - | 20% | 60% | |
| Peers Win Rate | 47% | 60% | 43% | 55% | 55% | 42% | |
| S&P 500 Win Rate | 75% | 42% | 67% | 75% | 67% | 50% | |
Max Drawdowns [4] | |||||||
| FLY Max Drawdown | - | - | - | - | - | -71% | |
| Peers Max Drawdown | -27% | -30% | -43% | -38% | -36% | -46% | |
| S&P 500 Max Drawdown | -5% | -25% | -10% | -8% | -19% | -9% | |
[1] Cumulative total returns since the beginning of 2021
[2] Peers: RKLB, LUNR, LMT, NOC, BA.
[3] Win Rate = % of calendar months in which monthly returns were positive
[4] Max drawdown represents maximum peak-to-trough decline within a year
[5] 2026 data is for the year up to 10/15/2026 (YTD)
How Low Can It Go
FLY has limited trading history. Below is the Industrials sector ETF (XLI) in its place.
| Event | XLI | S&P 500 |
|---|---|---|
| 2025 US Tariff Shock | ||
| % Loss | -15.8% | -18.8% |
| % Gain to Breakeven | 18.8% | 23.1% |
| Time to Breakeven | 34 days | 79 days |
| Summer-Fall 2023 Five Percent Yield Shock | ||
| % Loss | -11.7% | -9.5% |
| % Gain to Breakeven | 13.2% | 10.5% |
| Time to Breakeven | 45 days | 24 days |
| 2022 Inflation Shock & Fed Tightening | ||
| % Loss | -20.1% | -24.5% |
| % Gain to Breakeven | 25.1% | 32.4% |
| Time to Breakeven | 125 days | 427 days |
| 2020 COVID-19 Crash | ||
| % Loss | -41.6% | -33.7% |
| % Gain to Breakeven | 71.2% | 50.9% |
| Time to Breakeven | 231 days | 140 days |
| Q4 2018 Fed Policy Error / Growth Scare | ||
| % Loss | -23.7% | -19.2% |
| % Gain to Breakeven | 31.1% | 23.8% |
| Time to Breakeven | 120 days | 105 days |
| 2015-2016 China Devaluation / Global Growth Scare | ||
| % Loss | -11.1% | -12.2% |
| % Gain to Breakeven | 12.5% | 13.9% |
| Time to Breakeven | 51 days | 62 days |
In The Past
State Street Industrial Select Sector SPDR ETF's stock fell -15.8% during the 2025 US Tariff Shock. Such a loss loss requires a 18.8% gain to breakeven.
Preserve Wealth
Limiting losses and compounding gains is essential to preserving wealth.
Asset Allocation
Actively managed asset allocation strategies protect wealth. Learn more.
FLY has limited trading history. Below is the Industrials sector ETF (XLI) in its place.
| Event | XLI | S&P 500 |
|---|---|---|
| 2022 Inflation Shock & Fed Tightening | ||
| % Loss | -20.1% | -24.5% |
| % Gain to Breakeven | 25.1% | 32.4% |
| Time to Breakeven | 125 days | 427 days |
| 2020 COVID-19 Crash | ||
| % Loss | -41.6% | -33.7% |
| % Gain to Breakeven | 71.2% | 50.9% |
| Time to Breakeven | 231 days | 140 days |
| Q4 2018 Fed Policy Error / Growth Scare | ||
| % Loss | -23.7% | -19.2% |
| % Gain to Breakeven | 31.1% | 23.8% |
| Time to Breakeven | 120 days | 105 days |
| 2011 US Debt Ceiling Crisis & European Contagion | ||
| % Loss | -22.5% | -17.9% |
| % Gain to Breakeven | 29.0% | 21.8% |
| Time to Breakeven | 114 days | 123 days |
| 2008-2009 Global Financial Crisis | ||
| % Loss | -60.5% | -53.4% |
| % Gain to Breakeven | 153.2% | 114.4% |
| Time to Breakeven | 700 days | 1085 days |
In The Past
State Street Industrial Select Sector SPDR ETF's stock fell -15.8% during the 2025 US Tariff Shock. Such a loss loss requires a 18.8% gain to breakeven.
Preserve Wealth
Limiting losses and compounding gains is essential to preserving wealth.
Asset Allocation
Actively managed asset allocation strategies protect wealth. Learn more.
About Firefly Aerospace (FLY)
Firefly Aerospace (FLY) is a U.S.-based space and defense technology company specializing in comprehensive mission solutions for national security, government, and commercial customers. Its core mission is to enable responsive, regular, and reliable access to space through advanced launch vehicles and dynamic spacecraft. The company operates at the forefront of the rapidly expanding global space economy, providing crucial capabilities in an industry experiencing record demand for satellite launches and critical defense infrastructure in orbit.
Firefly offers a differentiated and scalable platform of Launch and Spacecraft Solutions with proven flight heritage. Its launch vehicle offerings include Alpha, an operational rocket that is the first and only U.S.-based orbital vehicle in its 1,000-kilogram class to successfully reach orbit. Alpha is renowned for its responsive launch capabilities, including setting a U.S. Space Force record with a 24-hour turnaround, and is utilized for hypersonic flight testing. Building on this technology, Firefly is developing Eclipse in partnership with Northrop Grumman, a reusable launch vehicle expected to deliver significantly larger payloads to various orbits as early as 2026, targeting space station resupply, critical national security, and commercial missions.
Complementing its launch capabilities, Firefly provides advanced Spacecraft Solutions. Its Blue Ghost lander is the only commercial vehicle to achieve a fully successful Moon landing, marking the first U.S. lunar surface mission since the Apollo era over 50 years ago, and positioning Firefly for future lunar and interplanetary expeditions. The company also offers Elytra, a multi-mission orbital spacecraft platform designed for diverse applications such as space domain awareness, long-range communications relays, and satellite delivery. Elytra supports Blue Ghost missions and critical government agencies including the National Reconnaissance Office, Space Development Agency, and the DoD’s Defense Innovation Unit. Firefly's primary customers are national security organizations, government agencies (e.g., NASA, DoD), and commercial entities requiring reliable and advanced space capabilities, making it a crucial partner for the United States' national defense strategy.
AI Analysis | Feedback
Firefly Aerospace is like SpaceX for national security missions and lunar exploration.
Alternatively, Firefly Aerospace is like Northrop Grumman, but a commercial space company that's leading in rapid-response launches and lunar landings.
AI Analysis | Feedback
- Alpha Launch Vehicle: An operational orbital rocket in the 1,000 kg class, providing reliable, regular, and rapid access to space, including responsive space missions and hypersonic flight test capabilities.
- Eclipse Launch Vehicle: A reusable and scaled-up version of Alpha, currently in final development, designed to deliver 16,000 kg payloads to various orbits, including LEO, MEO, GEO, HEO, and TLI.
- Blue Ghost Lander: A flight-proven lunar lander that provides mission solutions for lunar surface operations and can carry payloads to the Moon.
- Elytra Spacecraft: A highly maneuverable, multi-mission orbital spacecraft platform capable of satellite delivery, on-orbit transfers, communications relay, space domain awareness, and warfighting applications.
- Ocula Lunar Imaging Service: A lunar imaging service offered through the Elytra platform, expected to be available as early as 2026.
AI Analysis | Feedback
- The U.S. Space Force (for missions such as VICTUS NOX, VICTUS SOL, and VICTUS HAZE).
- The Department of Defense (DoD), including its Defense Innovation Unit (DIU) (for programs like MACH-TB and Space Maneuver Vehicle contracts).
- NASA (for missions such as Blue Ghost Mission 1, a contract valued at $102.1 million).
- The National Reconnaissance Office (NRO).
- The Space Development Agency (SDA).
- Other federal agencies.
- Commercial customers (a general category).
- Defense companies (as a partner of choice for hypersonic flight testing capabilities).
AI Analysis | Feedback
AI Analysis | Feedback
Jason Kim, Chief Executive Officer; Board Member
Jason Kim has served as Chief Executive Officer and a member of the Board at Firefly Aerospace since October 2024. He has 25 years of experience in executive management of satellites, rockets, ground systems, and autonomous systems. Prior to joining Firefly, Jason served as CEO of Millennium Space Systems from December 2020 to September 2024, where he led the company through a period of significant expansion and technology advancements. Millennium Space Systems was acquired by Boeing. He also held leadership roles at Raytheon Intelligence & Space, Northrop Grumman Aerospace Systems, and served in the U.S. Air Force.
Darren Ma, Chief Financial Officer
Darren Ma has served as Chief Financial Officer of Firefly Aerospace since August 2020, overseeing all financial business operations, capital raises, and investor relations. His prior roles include Chief Financial Officer and Senior Vice President of Spectra7 Microsystems from November 2017 to July 2020, and Chief Financial Officer of GigPeak, Inc. from October 2014 to September 2017. He also held business unit controller and finance manager positions at Semtech and Intel, respectively.
Shea Ferring, Chief Technology Officer
Shea Ferring is the Chief Technology Officer at Firefly Aerospace. He previously served as Co-Founder and Chief Operating Officer of M2S2-Technologies, an engineering services company, from October 2014 to April 2018.
Ramon Sanchez, Chief Operating Officer
Ramon Sanchez has served as Chief Operating Officer of Firefly Aerospace since December 2025. Before joining Firefly, he had a 25-year tenure at The Boeing Company, where his most recent role was Senior Director of Operations for Space, Intelligence & Weapons Systems, starting in April 2022. Mr. Sanchez is also a U.S. Army veteran.
Adam Oakes, Vice President, Launch Vehicles
Adam Oakes oversees Firefly's launch vehicle programs for Alpha and MLV, including the vision and strategy, technology development, and key aspects of launch vehicle manufacturing, testing, and operations. Prior to his role at Firefly, Adam spent 10 years at SpaceX, where he led various engine development and qualification campaigns for the Falcon/Merlin product line and served as Director of Production and Test at SpaceX's McGregor facility and Director of Propulsion Production at SpaceX's Hawthorne facility.
AI Analysis | Feedback
Key Risks to Firefly Aerospace (FLY)
- Risk related to the successful development and deployment of next-generation launch vehicles and spacecraft: Firefly Aerospace is significantly investing in and relying on the successful "final development" and deployment of its Eclipse launch vehicle, which is "expected to launch from Wallops Island, Virginia, as early as 2026" and aims to deliver 16 times the mass of Alpha to orbit. Similarly, the company "expects to offer a lunar imaging service, named Ocula, through Elytra as early as 2026." The inherent complexities, technological challenges, potential for delays, cost overruns, or performance failures in the development and initial operational phases of these advanced systems could significantly impact the company's ability to achieve its growth objectives, secure future contracts, and maintain its competitive position in the rapidly evolving space industry.
- Reliance on government contracts and potential fluctuations in defense and space budgets: A substantial portion of Firefly Aerospace's business model and growth strategy is anchored in contracts and partnerships with national security, government, and commercial customers, with a strong emphasis on entities like the U.S. Department of Defense, Space Force, National Reconnaissance Office, and Space Development Agency. While current trends indicate increased government spending in the space domain, shifts in geopolitical priorities, changes in government procurement processes, budget allocations, or economic downturns could lead to reductions in demand for Firefly's services, contract modifications, or cancellations, thereby negatively impacting the company's revenue and profitability.
- Inherent risks of space launch and operations: Despite Firefly Aerospace's recent successes, including Alpha's successful orbital launches and the Blue Ghost lander's successful Moon landing, the space industry continues to carry inherent high risks associated with launch vehicle failures, operational anomalies of spacecraft, and other unforeseen technical challenges. Any future launch failures, significant operational issues with its spacecraft (Blue Ghost or Elytra), or delays and complications in the construction and expansion of its launch sites (e.g., Wallops Island, Esrange Space Center, Cape Canaveral) could result in substantial financial losses, damage to the company's reputation, delays in fulfilling existing contracts, and difficulties in securing new business.
AI Analysis | Feedback
AI Analysis | Feedback
AI Analysis | Feedback
Expected Drivers of Future Revenue Growth for Firefly Aerospace (FLY)
Over the next 2-3 years, Firefly Aerospace is expected to drive future revenue growth through several key initiatives:
- Increased Alpha Launch Cadence and Contracts: Firefly's operational Alpha launch vehicle has a strong track record, including setting a new responsive launch record for the U.S. Space Force with the VICTUS NOX mission. As of March 2025, Alpha has more than 30 planned launches under contract, including additional responsive launch missions like VICTUS SOL and VICTUS HAZE. Furthermore, Alpha is contracted for the DoD's MACH-TB program to provide hypersonic flight test capabilities, positioning it as a cost-effective platform for defense companies in this arena.
- Launch of the Eclipse Rocket: The Eclipse rocket, a reusable and scaled-up version of Alpha developed in partnership with Northrop Grumman, is in final development with its first launch expected as early as 2026. This vehicle is designed to deliver significantly larger payloads (16,000 kilograms to LEO, 16 times Alpha's capacity) and can access various orbits, supporting space station resupply, commercial spacecraft, national security missions, and scientific payloads. This new, higher-capacity offering will address a gap in the current launch market and is expected to attract substantial new business.
- Expansion of Spacecraft Solutions with Blue Ghost and Elytra Missions: Following the fully successful Blue Ghost Mission 1 in March 2025, which included carrying 10 NASA payloads and completing all mission objectives for a contract value of $102.1 million, Firefly is positioned for additional lunar missions and future interplanetary expeditions. The Elytra spacecraft, which proved its common technology during Blue Ghost Mission 1 by operating in various orbits, will directly support Blue Ghost Mission 2 in 2026 by providing data relay services. Elytra is also contracted for an NRO mission, technology missions for the SDA's Proliferated Warfighter Space Architecture, and a Space Maneuver Vehicle for the DoD’s DIU to perform Space Domain Awareness. Additionally, Firefly expects to offer a lunar imaging service, Ocula, through Elytra as early as 2026. These diverse spacecraft missions and services represent a significant growth area.
- Expansion of Launch Infrastructure: Firefly is enhancing its launch flexibility and responsiveness by expanding its launch site capabilities. In addition to the ongoing launches from Vandenberg Space Force Base, new launch sites are under construction at Virginia’s Mid-Atlantic Regional Spaceport on Wallops Island (expected for Eclipse's first launch) and the Esrange Space Center in Sweden. Future launch pad capacity will also be unlocked through expansion at Cape Canaveral SFS in Florida. This expanded infrastructure will support an increasing launch cadence and cater to a wider range of customer needs, thereby driving revenue growth.
AI Analysis | Feedback
Share Issuance
- Firefly Aerospace completed an initial public offering (IPO) in August 2025 on the Nasdaq stock exchange, raising $868 million and achieving a valuation of approximately $10 billion at the time. The S-1 filing for the IPO indicated an offering of 16,200,000 shares of common stock at an anticipated price between $35.00 and $39.00 per share.
- In May/June 2026, Firefly Aerospace priced a public offering of 12 million shares of common stock at $48.00 per share. The company issued 4 million new shares, generating approximately $192 million in primary gross proceeds, with net proceeds of $181.6 million intended for general corporate purposes, including supporting business growth and new programs.
Inbound Investments
- Firefly Aerospace completed a $75 million Series A investment round in May 2021, led by DADA Holdings.
- In March 2022, AE Industrial Partners led a $75 million Series B financing round and acquired a controlling stake in Firefly Aerospace.
- Firefly Aerospace conducted several Series C and Series D funding rounds, including its largest Series C round for $179 million in February 2023, and a Series D round of approximately $175 million in October/November 2024 led by RPM Ventures. Additionally, Northrop Grumman invested $50 million in Firefly's Series D in May 2025 to accelerate the production of the Eclipse medium-lift rocket.
Outbound Investments
- In the second quarter of 2026 (announced August 2026), Firefly Aerospace acquired Space-ng, a company specializing in AI-powered vision navigation and autonomous guidance systems, to enhance its capabilities for Blue Ghost landers and Elytra orbital vehicles.
Capital Expenditures
- Firefly Aerospace has expanded its campus, including a new headquarters, a more than quadrupled spacecraft cleanroom space, and additional workstations for manufacturing Alpha and Eclipse vehicles.
- A new cleanroom facility in Cedar Park, Texas, was completed in September 2026, significantly expanding spacecraft manufacturing capacity to support lunar lander and in-space vehicle production. This facility was supported by a grant from the Texas Space Commission.
- Firefly is actively developing new launch sites, with facilities under construction at Virginia’s Mid-Atlantic Regional Spaceport on Wallops Island and the Esrange Space Center in Sweden, and future expansion planned for Cape Canaveral SFS in Florida. The Esrange site development includes a launch control center, payload processing facility, integration building, and tracking systems, with the launch pad in final construction stages.
Peer Outperformance in Aerospace & Defense
null| Industry | Names | 1Y med | 3Y med | 5Y med | Top 3 by 5Y |
|---|---|---|---|---|---|
| Construction & Engineering | 30 | -3.0% | 106.8% | 172.7% | STRL 1832% · FIX 1781% · AGX 805% |
| Marine Transportation | 5 | 62.7% | 49.0% | 143.3% | MATX 205% · KEX 151% |
| Construction Machinery & Heavy Transportation Equipment | 13 | -4.0% | 45.4% | 88.9% | CAT 303% · ALSN 245% · WAB 221% |
| Aerospace & Defense ← | 52 | -12.7% | 53.6% | 59.6% | ATI 1001% · FTAI 821% · HWM 604% |
| Trading Companies & Distributors | 19 | 5.5% | 24.8% | 42.6% | DXPE 451% · AIT 265% · URI 212% |
| Rail Transportation | 7 | 25.4% | 61.7% | 42.2% | CSX 53% · UNP 42% · NSC 31% |
| Industrial Machinery & Supplies & Components | 72 | 9.2% | 46.2% | 40.3% | CRS 1097% · MLI 498% · SYM 284% |
| Cargo Ground Transportation | 16 | 39.4% | 3.0% | 28.7% | XPO 279% · R 223% · ARCB 60% |
| Diversified Support Services | 34 | 10.8% | 27.4% | 27.0% | CXW 232% · OPLN 134% · CACI 117% |
| Building Products | 33 | -13.9% | 6.3% | 18.5% | GFF 335% · TT 188% · JCI 129% |
| Electrical Components & Equipment | 38 | -12.8% | 51.9% | 13.6% | POWL 1974% · BE 1033% · VRT 877% |
| Industrial Conglomerates | 17 | 11.3% | 2.0% | -2.6% | CSW 115% · DD 64% · CSL 63% |
| Agricultural & Farm Machinery | 17 | 0.6% | -6.2% | -8.7% | DE 109% · TTC 9% · AGCO -4% |
| Environmental & Facilities Services | 30 | -36.7% | 19.6% | -10.1% | CECO 782% · GEO 253% · CLH 196% |
| Research & Consulting Services | 13 | -3.2% | -23.3% | -21.5% | HURN 242% · FCN 2% · BAH 2% |
| Data Processing & Outsourced Services | 6 | -25.0% | -8.5% | -21.5% | EXLS 57% · BR 6% · G -19% |
| Office Services & Supplies | 9 | 22.6% | 16.5% | -23.0% | PBI 197% · TILE 136% · HNI 45% |
| Passenger Ground Transportation | 3 | -26.7% | 55.0% | -23.5% | UBER 43% · CAR -23% · LYFT -68% |
| Security & Alarm Services | 9 | -56.1% | 10.3% | -27.8% | BCO 78% |
| Passenger Airlines | 11 | -3.3% | 5.9% | -36.8% | LTM 2989% · UAL 106% · DAL 98% |
| Air Freight & Logistics | 12 | -17.2% | -25.9% | -40.1% | EXPD 81% · FDX 78% · CHRW 71% |
| Human Resource & Employment Services | 22 | 11.8% | -19.5% | -42.0% | ADP 50% · PAYX 9% · FA 2% |
| Airport Services | 4 | -73.8% | -69.9% | -82.1% | JOBY -47% |
Latest Trefis Analyses
| Title | |
|---|---|
| ARTICLES |
Research & Analysis
Invest in Strategies
Wealth Management
Peer Comparisons
| Peers to compare with: |
Financials
| Median | |
|---|---|
| Name | |
| Mkt Price | 121.83 |
| Mkt Cap | 52.8 |
| Rev LTM | 21,831 |
| Op Inc LTM | -179 |
| FCF LTM | -203 |
| FCF 3Y Avg | -103 |
| CFO LTM | 1,756 |
| CFO 3Y Avg | -71 |
Growth & Margins
| Median | |
|---|---|
| Name | |
| Rev Chg LTM | 38.7% |
| Rev Chg 3Y Avg | 9.0% |
| Rev Chg Q | 36.2% |
| QoQ Delta Rev Chg LTM | 7.9% |
| Op Inc Chg LTM | 7.5% |
| Op Inc Chg 3Y Avg | -12.3% |
| Op Mgn LTM | -16.7% |
| Op Mgn 3Y Avg | -6.8% |
| QoQ Delta Op Mgn LTM | 3.1% |
| CFO/Rev LTM | -11.2% |
| CFO/Rev 3Y Avg | -3.2% |
| FCF/Rev LTM | -19.6% |
| FCF/Rev 3Y Avg | -6.4% |
Price Behavior
| Market Price | $17.02 | |
| Market Cap ($ Bil) | 2.8 | |
| First Trading Date | 08/07/2025 | |
| Distance from 52W High | -71.1% | |
| 50 Days | 200 Days | |
| DMA Price | $22.58 | $27.67 |
| DMA Trend | down | indeterminate |
| Distance from DMA | -24.6% | -38.5% |
| 3M | 1YR | |
| Volatility | 73.5% | 108.0% |
| Downside Capture | 360.08 | 443.83 |
| Upside Capture | 276.21 | 313.23 |
| Correlation (S&P 500) | 58.7% | 41.5% |
| 1M | 2M | 3M | 6M | 1Y | 3Y | |
|---|---|---|---|---|---|---|
| Beta | 3.93 | 4.12 | 3.88 | 3.84 | 3.46 | -0.66 |
| Up Beta | 4.59 | 5.16 | 6.91 | 5.15 | 4.56 | -0.66 |
| Down Beta | 5.26 | 5.11 | 3.33 | 2.97 | 2.07 | -0.13 |
| Up Capture | 468% | 454% | 260% | 398% | 822% | 66% |
| Bmk +ve Days | 6 | 16 | 27 | 66 | 132 | 424 |
| Stock +ve Days | 11 | 20 | 29 | 55 | 116 | 131 |
| Down Capture | 226% | 295% | 322% | 289% | 186% | 109% |
| Bmk -ve Days | 16 | 26 | 37 | 60 | 120 | 328 |
| Stock -ve Days | 11 | 21 | 34 | 70 | 134 | 155 |
[1] Upside and downside betas calculated using positive and negative benchmark daily returns respectively
Based On 1-Year Data
| Annualized Return | Annualized Volatility | Sharpe Ratio | Correlation with FLY | |
|---|---|---|---|---|
| FLY | -43.6% | 108.2% | -0.04 | - |
| Sector ETF (XLI) | 10.0% | 17.2% | 0.38 | 35.7% |
| Equity (SPY) | 17.6% | 12.7% | 0.99 | 41.6% |
| Gold (GLD) | 0.5% | 29.5% | 0.02 | 18.2% |
| Commodities (DBC) | 50.9% | 20.7% | 1.88 | -4.6% |
| Real Estate (VNQ) | 4.7% | 13.7% | 0.08 | 9.5% |
| Bitcoin (BTCUSD) | -28.1% | 43.7% | -0.63 | 29.8% |
Smart multi-asset allocation framework can stack odds in your favor. Learn How
Based On 5-Year Data
| Annualized Return | Annualized Volatility | Sharpe Ratio | Correlation with FLY | |
|---|---|---|---|---|
| FLY | -22.4% | 106.1% | -0.52 | - |
| Sector ETF (XLI) | 12.2% | 17.6% | 0.53 | 33.3% |
| Equity (SPY) | 13.4% | 17.1% | 0.60 | 38.8% |
| Gold (GLD) | 18.5% | 18.9% | 0.79 | 17.3% |
| Commodities (DBC) | 9.7% | 19.5% | 0.38 | -3.1% |
| Real Estate (VNQ) | 1.1% | 18.8% | -0.05 | 7.3% |
| Bitcoin (BTCUSD) | 8.7% | 51.8% | 0.35 | 28.6% |
Smart multi-asset allocation framework can stack odds in your favor. Learn How
Based On 10-Year Data
| Annualized Return | Annualized Volatility | Sharpe Ratio | Correlation with FLY | |
|---|---|---|---|---|
| FLY | -11.9% | 106.1% | -0.52 | - |
| Sector ETF (XLI) | 13.0% | 20.1% | 0.56 | 33.3% |
| Equity (SPY) | 15.4% | 17.9% | 0.73 | 38.8% |
| Gold (GLD) | 12.2% | 16.4% | 0.61 | 17.3% |
| Commodities (DBC) | 8.2% | 18.1% | 0.37 | -3.1% |
| Real Estate (VNQ) | 5.0% | 20.7% | 0.20 | 7.3% |
| Bitcoin (BTCUSD) | 63.1% | 66.2% | 1.03 | 28.6% |
Smart multi-asset allocation framework can stack odds in your favor. Learn How
Earnings Returns History
Updated 9/14/2026| Forward Returns | |||
|---|---|---|---|
| Earnings Date | 1D Returns | 5D Returns | 21D Returns |
| 8/11/2026 | 0.7% | -0.8% | -20.7% |
| 5/4/2026 | -5.5% | 14.6% | 19.2% |
| 3/19/2026 | 1.1% | 16.8% | 86.4% |
| 11/12/2025 | 17.0% | 6.1% | 11.2% |
| 9/22/2025 | -15.3% | -25.4% | -43.1% |
| SUMMARY STATS | |||
| # Positive | 3 | 3 | 3 |
| # Negative | 2 | 2 | 2 |
| Median Positive | 1.1% | 14.6% | 19.2% |
| Median Negative | -10.4% | -13.1% | -31.9% |
| Max Positive | 17.0% | 16.8% | 86.4% |
| Max Negative | -15.3% | -25.4% | -43.1% |
| Forward Returns | |||
|---|---|---|---|
| Earnings Date | 1D Returns | 5D Returns | 21D Returns |
| 8/11/2026 | 0.7% | -0.8% | -20.7% |
| 5/4/2026 | -5.5% | 14.6% | 19.2% |
| 3/19/2026 | 1.1% | 16.8% | 86.4% |
| 11/12/2025 | 17.0% | 6.1% | 11.2% |
| 9/22/2025 | -15.3% | -25.4% | -43.1% |
| SUMMARY STATS | |||
| # Positive | 3 | 3 | 3 |
| # Negative | 2 | 2 | 2 |
| Median Positive | 1.1% | 14.6% | 19.2% |
| Median Negative | -10.4% | -13.1% | -31.9% |
| Max Positive | 17.0% | 16.8% | 86.4% |
| Max Negative | -15.3% | -25.4% | -43.1% |
Recent Forward Guidance
Updated 10/4/2026Latest: Q2 2026 Earnings Reported 8/11/2026
| Forward Guidance | Guidance Change | |||||||
|---|---|---|---|---|---|---|---|---|
| Metric | Source | Low | Mid | High | % Chg | % Delta | Change | Prior |
| 2026 Revenue | Reported | 420.00 Mil | 435.00 Mil | 450.00 Mil | 0 | Affirmed | Guidance: 435.00 Mil for 2026 | |
Prior: Q1 2026 Earnings Reported 5/4/2026
| Forward Guidance | Guidance Change | |||||||
|---|---|---|---|---|---|---|---|---|
| Metric | Source | Low | Mid | High | % Chg | % Delta | Change | Prior |
| 2026 Revenue | Reported | 420.00 Mil | 435.00 Mil | 450.00 Mil | 0 | Affirmed | Guidance: 435.00 Mil for 2026 | |
Q4 2025 Earnings Reported 3/19/2026
| Forward Guidance | Guidance Change | |||||||
|---|---|---|---|---|---|---|---|---|
| Metric | Source | Low | Mid | High | % Chg | % Delta | Change | Prior |
| 2026 Revenue | Reported | 420.00 Mil | 435.00 Mil | 450.00 Mil | 182.5% | Higher New | Guidance: 154.00 Mil for 2025 | |
Q3 2025 Earnings Reported 11/12/2025
| Forward Guidance | Guidance Change | |||||||
|---|---|---|---|---|---|---|---|---|
| Metric | Source | Low | Mid | High | % Chg | % Delta | Change | Prior |
| 2025 Revenue | Reported | 150.00 Mil | 154.00 Mil | 158.00 Mil | 10.8% | Raised | Guidance: 139.00 Mil for 2025 | |
Insider Activity
Updated 10/7/2026| # | Owner | Title | Holding | Action | Filing Date | Price | Shares | Transacted Value | Value of Held Shares | Form |
|---|---|---|---|---|---|---|---|---|---|---|
| 1 | Aeroequity, Gp, Llc | See Footnotes | Sell | 6032026 | 48.00 | 8,000,000 | 384,000,000 | 849,065,136 | Form | |
| 2 | Wheeler, David Leigh | General Counsel | Direct | Sell | 5192026 | 45.12 | 3,765 | 169,885 | 6,441,541 | Form |
| 3 | Wheeler, David Leigh | General Counsel | Direct | Sell | 4202026 | 45.04 | 3,766 | 169,608 | 6,429,335 | Form |
| # | Owner | Title | Holding | Action | Filing Date | Price | Shares | Transacted Value | Value of Held Shares | Form |
|---|---|---|---|---|---|---|---|---|---|---|
| 1 | Aeroequity, Gp, Llc | See Footnotes | Sell | 6032026 | 48.00 | 8,000,000 | 384,000,000 | 849,065,136 | Form | |
| 2 | Wheeler, David Leigh | General Counsel | Direct | Sell | 5192026 | 45.12 | 3,765 | 169,885 | 6,441,541 | Form |
| 3 | Wheeler, David Leigh | General Counsel | Direct | Sell | 4202026 | 45.04 | 3,766 | 169,608 | 6,429,335 | Form |
Investor Activity (13F)
Updated Oct 16, 2026Active managers (13F portfolio over $250M, at least 3 holdings) with a position over $5M that is either over 10% of their portfolio or held in a concentrated book of 50 or fewer total positions. Index/ETF, sovereign, bank, community-bank and charitable/donor-advised filers are excluded.
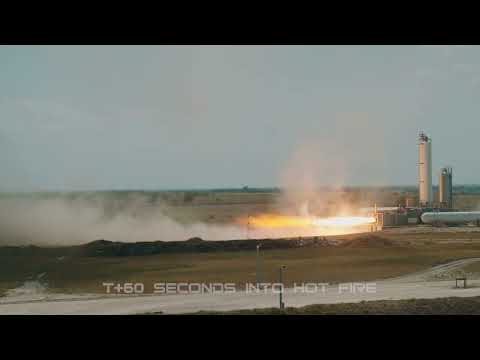
Firefly Aerospace — Investor Video Playlist


Industry Resources
| Industrials Resources |
| IndustryWeek |
| Manufacturing.net |
| Aviation Week |
| Aerospace & Defense Resources |
| Defense News |
| FlightGlobal |
External Quote Links
| Y Finance | Barrons |
| TradingView | Morningstar |
| SeekingAlpha | ValueLine |
| Motley Fool | Robinhood |
| CNBC | Etrade |
| MarketWatch | Unusual Whales |
| YCharts | Perplexity Finance |
| FinViz |
Prefer one of these to Trefis? Tell us why.