
Korn Ferry (KFY)
Market Price (10/20/2026): $71.86 | Market Cap: $-Sector: Industrials | Industry: Human Resource & Employment Services
Korn Ferry (KFY)
Market Price (10/20/2026): $71.86Market Cap: $-Sector: IndustrialsIndustry: Human Resource & Employment Services
Investment Highlights Why It Matters Detailed financial logic regarding cash flow yields vs trend-riding momentum.
Low stock price volatilityVol 12M is 29% | Weak multi-year price returns2Y Excs Rtn is -26%, 3Y Excs Rtn is -19% | Key risksKFY key risks include [1] significant dependence on third-party technology providers for strategic initiatives and [2] heavy revenue concentration in its Executive Search segment. |
| Low stock price volatilityVol 12M is 29% |
| Weak multi-year price returns2Y Excs Rtn is -26%, 3Y Excs Rtn is -19% |
| Key risksKFY key risks include [1] significant dependence on third-party technology providers for strategic initiatives and [2] heavy revenue concentration in its Executive Search segment. |
Qualitative Assessment
AI Analysis | Feedback
Korn Ferry (KFY) stock has gained about 10% since 6/30/2026 because of the following key factors:
1. Korn Ferry reported robust fiscal Q1 2027 results, surpassing analyst expectations for both earnings and revenue. The company announced fiscal Q1 2027 (ended July 31, 2026) adjusted diluted earnings per share of $1.43, beating the consensus estimate of $1.36 by $0.07. Fee revenue for the quarter reached $756.5 million, exceeding analyst estimates of $736.76 million to $737.66 million and representing a 7% increase year-over-year at both actual and constant currency. This marked the sixth consecutive quarter of top-line growth for the firm. The growth was broad-based, with fee revenue increasing across all regions and double-digit growth specifically in Search and Workforce Solutions, rising 10% and 11% respectively.
2. The strategic acquisition of AMS was completed, expanding Korn Ferry's service offerings and future growth potential. Korn Ferry completed the acquisition of UK-headquartered AMS by September 1, 2026, a move discussed with investors on June 29, 2026. This acquisition is expected to significantly enhance Korn Ferry's Workforce Solutions segment by integrating "technology-enabled talent solutions at scale" and leveraging AMS's long-term contracted client relationships. Management anticipates the integration to contribute an additional $40 million in incremental EBITDA within a year, reinforcing Korn Ferry's position as a global leader in talent and organizational consulting. The estimated remaining fees under existing contracts at the end of fiscal Q1 2027 also increased to $1.9 billion, a 14% year-over-year rise, partly attributable to the AMS deal.
Show more
Korn Ferry (KFY) stock has gained about 10% since 6/30/2026 because of the following key factors:
1. Korn Ferry reported robust fiscal Q1 2027 results, surpassing analyst expectations for both earnings and revenue. The company announced fiscal Q1 2027 (ended July 31, 2026) adjusted diluted earnings per share of $1.43, beating the consensus estimate of $1.36 by $0.07. Fee revenue for the quarter reached $756.5 million, exceeding analyst estimates of $736.76 million to $737.66 million and representing a 7% increase year-over-year at both actual and constant currency. This marked the sixth consecutive quarter of top-line growth for the firm. The growth was broad-based, with fee revenue increasing across all regions and double-digit growth specifically in Search and Workforce Solutions, rising 10% and 11% respectively.
2. The strategic acquisition of AMS was completed, expanding Korn Ferry's service offerings and future growth potential. Korn Ferry completed the acquisition of UK-headquartered AMS by September 1, 2026, a move discussed with investors on June 29, 2026. This acquisition is expected to significantly enhance Korn Ferry's Workforce Solutions segment by integrating "technology-enabled talent solutions at scale" and leveraging AMS's long-term contracted client relationships. Management anticipates the integration to contribute an additional $40 million in incremental EBITDA within a year, reinforcing Korn Ferry's position as a global leader in talent and organizational consulting. The estimated remaining fees under existing contracts at the end of fiscal Q1 2027 also increased to $1.9 billion, a 14% year-over-year rise, partly attributable to the AMS deal.
3. Positive analyst sentiment and increased price targets followed the strong fiscal Q1 2027 performance and the AMS acquisition. Several prominent brokerage firms raised their price targets for Korn Ferry's stock after the Q1 FY2027 earnings release and the completion of the AMS acquisition. Goldman Sachs increased its price target to $94 from $84 while maintaining a Buy rating on September 14, 2026. UBS raised its price target to $82 from $75 on September 10, 2026. Truist Financial reiterated a Buy rating and a $100 price target on September 10, 2026. The consensus among analysts shifted to a "Strong Buy" rating with an average 12-month price target of $90.25, indicating a significant potential upside of 25.82% from the stock's price on September 9, 2026.
Show less
Stock Movement Drivers
Fundamental Drivers
nullnull
Market Drivers
6/30/2026 to 10/19/2026| Return | Correlation | |
|---|---|---|
| KFY | 9.6% | |
| Market (SPY) | 2.6% | 5.6% |
| Sector (XLI) | -10.0% | 7.0% |
Fundamental Drivers
nullnull
Market Drivers
3/31/2026 to 10/19/2026| Return | Correlation | |
|---|---|---|
| KFY | 15.9% | |
| Market (SPY) | 18.2% | -4.4% |
| Sector (XLI) | 3.3% | -10.9% |
Fundamental Drivers
nullnull
Market Drivers
9/30/2025 to 10/19/2026| Return | Correlation | |
|---|---|---|
| KFY | 5.9% | |
| Market (SPY) | 16.0% | 11.8% |
| Sector (XLI) | 9.0% | 2.9% |
Fundamental Drivers
nullnull
Market Drivers
9/30/2023 to 10/19/2026| Return | Correlation | |
|---|---|---|
| KFY | 63.8% | |
| Market (SPY) | 85.5% | 40.1% |
| Sector (XLI) | 71.0% | 38.5% |
Price Returns Compared
| 2021 | 2022 | 2023 | 2024 | 2025 | 2026 | Total [1] | |
|---|---|---|---|---|---|---|---|
| Returns | |||||||
| KFY Return | 75% | -32% | 19% | 16% | 1% | 13% | 87% |
| Peers Return | 41% | -14% | 17% | -24% | -46% | 52% | -13% |
| S&P 500 Return | 27% | -19% | 24% | 23% | 16% | 12% | 104% |
Monthly Win Rates [3] | |||||||
| KFY Win Rate | 75% | 33% | 50% | 58% | 58% | 70% | |
| Peers Win Rate | 62% | 45% | 50% | 37% | 35% | 68% | |
| S&P 500 Win Rate | 75% | 42% | 67% | 75% | 67% | 50% | |
Max Drawdowns [4] | |||||||
| KFY Max Drawdown | -15% | -39% | -22% | -16% | -18% | -18% | |
| Peers Max Drawdown | -20% | -37% | -23% | -34% | -57% | -36% | |
| S&P 500 Max Drawdown | -5% | -25% | -10% | -8% | -19% | -9% | |
[1] Cumulative total returns since the beginning of 2021
[2] Peers: RHI, MAN, NSP, KELYA, KFRC. See KFY Returns vs. Peers.
[3] Win Rate = % of calendar months in which monthly returns were positive
[4] Max drawdown represents maximum peak-to-trough decline within a year
[5] 2026 data is for the year up to 10/19/2026 (YTD)
How Low Can It Go
| Event | KFY | S&P 500 |
|---|---|---|
| 2025 US Tariff Shock | ||
| % Loss | -10.2% | -18.8% |
| % Gain to Breakeven | 11.3% | 23.1% |
| Time to Breakeven | 17 days | 79 days |
| Summer-Fall 2023 Five Percent Yield Shock | ||
| % Loss | -15.3% | -9.5% |
| % Gain to Breakeven | 18.0% | 10.5% |
| Time to Breakeven | 32 days | 24 days |
| 2023 SVB Regional Banking Crisis | ||
| % Loss | -18.2% | -6.7% |
| % Gain to Breakeven | 22.2% | 7.1% |
| Time to Breakeven | 221 days | 31 days |
| 2022 Inflation Shock & Fed Tightening | ||
| % Loss | -38.1% | -24.5% |
| % Gain to Breakeven | 61.5% | 32.4% |
| Time to Breakeven | 670 days | 427 days |
| 2020 COVID-19 Crash | ||
| % Loss | -47.2% | -33.7% |
| % Gain to Breakeven | 89.4% | 50.9% |
| Time to Breakeven | 247 days | 140 days |
| Q4 2018 Fed Policy Error / Growth Scare | ||
| % Loss | -22.7% | -19.2% |
| % Gain to Breakeven | 29.3% | 23.8% |
| Time to Breakeven | 57 days | 105 days |
In The Past
Korn Ferry's stock fell -10.2% during the 2025 US Tariff Shock. Such a loss loss requires a 11.3% gain to breakeven.
Preserve Wealth
Limiting losses and compounding gains is essential to preserving wealth.
Asset Allocation
Actively managed asset allocation strategies protect wealth. Learn more.
| Event | KFY | S&P 500 |
|---|---|---|
| 2022 Inflation Shock & Fed Tightening | ||
| % Loss | -38.1% | -24.5% |
| % Gain to Breakeven | 61.5% | 32.4% |
| Time to Breakeven | 670 days | 427 days |
| 2020 COVID-19 Crash | ||
| % Loss | -47.2% | -33.7% |
| % Gain to Breakeven | 89.4% | 50.9% |
| Time to Breakeven | 247 days | 140 days |
| Q4 2018 Fed Policy Error / Growth Scare | ||
| % Loss | -22.7% | -19.2% |
| % Gain to Breakeven | 29.3% | 23.8% |
| Time to Breakeven | 57 days | 105 days |
| 2015-2016 China Devaluation / Global Growth Scare | ||
| % Loss | -27.3% | -12.2% |
| % Gain to Breakeven | 37.6% | 13.9% |
| Time to Breakeven | 467 days | 62 days |
| 2011 US Debt Ceiling Crisis & European Contagion | ||
| % Loss | -48.8% | -17.9% |
| % Gain to Breakeven | 95.4% | 21.8% |
| Time to Breakeven | 739 days | 123 days |
| 2010 Eurozone Sovereign Debt Crisis / Flash Crash | ||
| % Loss | -25.9% | -15.4% |
| % Gain to Breakeven | 34.9% | 18.2% |
| Time to Breakeven | 150 days | 125 days |
| 2008-2009 Global Financial Crisis | ||
| % Loss | -61.0% | -53.4% |
| % Gain to Breakeven | 156.4% | 114.4% |
| Time to Breakeven | 632 days | 1085 days |
| Summer 2007 Credit Crunch | ||
| % Loss | -35.3% | -8.6% |
| % Gain to Breakeven | 54.5% | 9.5% |
| Time to Breakeven | 2294 days | 47 days |
In The Past
Korn Ferry's stock fell -10.2% during the 2025 US Tariff Shock. Such a loss loss requires a 11.3% gain to breakeven.
Preserve Wealth
Limiting losses and compounding gains is essential to preserving wealth.
Asset Allocation
Actively managed asset allocation strategies protect wealth. Learn more.
About Korn Ferry (KFY)
Korn Ferry (KFY) is a global organizational consulting firm that helps companies optimize their talent and structure. It operates through various segments including Consulting, Digital, Executive Search, and Recruitment Process Outsourcing (RPO) & Professional Search. Essentially, Korn Ferry partners with organizations to address their most critical human capital challenges, from leadership acquisition to overall organizational effectiveness.
The company's core services revolve around talent acquisition and development. A significant offering is its executive search service, specializing in placing C-suite executives and board members across diverse industries. Beyond top-level recruitment, Korn Ferry provides a comprehensive suite of consulting services, including organizational strategy, talent assessment and succession planning, leadership development, and total reward services. It also offers broader recruitment solutions like RPO, project recruitment, and professional search, leveraging an artificial intelligence platform for advanced insights and recommendations.
Korn Ferry serves a wide array of clients globally, ranging from large public and private corporations to middle-market and emerging growth companies. Its customer base spans various market sectors, including industrial, financial services, life sciences/healthcare, consumer, technology, and educational/not-for-profit organizations. The firm's integrated approach allows it to cater to the specific human capital needs of diverse enterprises, government entities, and non-profit institutions.
AI Analysis | Feedback
It's like Deloitte's or Accenture's human capital consulting arm, specialized in executive search and leadership development.
AI Analysis | Feedback
- Executive Search: This service focuses on filling executive-level positions, such as C-suite roles and board directors, for clients across diverse market sectors.
- Organizational Consulting: Korn Ferry provides consulting services including organizational strategy, assessment and succession planning, leadership and professional development, and total reward services.
- Recruitment Process Outsourcing (RPO) & Professional Search: These services offer comprehensive recruitment solutions, encompassing RPO, project recruitment, and professional search for a wide range of roles.
- Digital Platform: The company offers an artificial intelligence machine-learning platform to identify optimal structures, roles, capabilities, and behaviors for organizational insight and action.
AI Analysis | Feedback
Korn Ferry (KFY) primarily sells its services to other companies and organizations, not to individuals.
Korn Ferry does not publicly disclose the names of specific major customer companies. This is typical for professional services firms like Korn Ferry, which serve a diverse client base across many industries and typically do not have a single customer or a few customers that account for a significant portion of their revenue, nor do they disclose client names due to confidentiality.
However, based on the company description, Korn Ferry serves a broad range of organizations across various types and sectors. Its major customer categories include:
- Public and private companies
- Middle market and emerging growth companies
- Government organizations
- Non-profit organizations
These clients come from diverse market sectors, such as:
- Industrial
- Financial services
- Life sciences/healthcare provider
- Consumer
- Technology
- Educational/not-for-profit
AI Analysis | Feedback
AI Analysis | Feedback
Gary Burnison, Chief Executive Officer
Gary Burnison joined Korn Ferry in 2002 as Chief Financial Officer and subsequently served as Chief Operating Officer from 2003 to 2007 before being appointed Chief Executive Officer in 2007. Prior to his time at Korn Ferry, he was the principal and Chief Financial Officer of Guidance Solutions, a technology services firm, from 1999 to 2001. He also held senior executive officer and director positions at Jefferies & Company, Inc., a global investment bank, from 1995 to 1999, and was a partner at KPMG Peat Marwick from 1984 to 1995. Mr. Burnison is a prolific author of numerous leadership and career development books. He holds a bachelor's degree in business administration from the University of Southern California and an honorary Doctor of Laws degree from Pepperdine University.
Robert Rozek, Executive Vice President, Chief Financial Officer and Chief Corporate Officer
Robert Rozek became Korn Ferry's Chief Financial Officer in February 2012. Before joining Korn Ferry, he served as Chief Financial Officer and Executive Vice President at Cushman & Wakefield, where he was responsible for global financial and accounting operations. His career also includes senior leadership roles, including Chief Financial Officer and Senior Vice President, at Las Vegas Sands Corporation, and high-level positions at Eastman Kodak Company. Earlier in his career, he was a partner at PricewaterhouseCoopers LLP for five years. Mr. Rozek is a Certified Public Accountant and earned a bachelor's degree in accounting from Canisius College.
Jeanne MacDonald, Chief Executive Officer, Recruitment Process Outsourcing (RPO)
Jeanne MacDonald serves as the Chief Executive Officer for Recruitment Process Outsourcing (RPO) at Korn Ferry. She joined the company in 1998 and has held various roles, including senior recruiter and business development director for North America, and previously served as President, Global RPO Solutions.
Michael Distefano, Chief Executive Officer, Professional Search & Interim
Michael Distefano holds the position of Chief Executive Officer for Professional Search & Interim at Korn Ferry.
Lesley Uren, Chief Executive Officer, Korn Ferry Consulting
Lesley Uren is the Chief Executive Officer for Korn Ferry Consulting.
AI Analysis | Feedback
The key risks to Korn Ferry's business include market volatility and economic uncertainty, technological disruption, and its dependence on the executive search segment.
The most significant risk stems from the inherently cyclical nature of the industries it serves, making Korn Ferry highly susceptible to market volatility and economic uncertainty. Economic downturns, geopolitical tensions, or broader industry disruptions can lead to reduced corporate spending on talent solutions, including executive search and consulting services, directly impacting Korn Ferry's revenue and profitability.
A second key risk is technological disruption, particularly from artificial intelligence (AI). While Korn Ferry offers a digital segment, rapid advancements in AI pose a potential threat by possibly automating aspects of consulting, recruitment process outsourcing (RPO), or executive search, or enabling clients to perform these functions internally using AI tools. This could fundamentally alter demand for traditional human capital services.
Finally, Korn Ferry faces a risk due to its dependence on the Executive Search segment. Despite offering a diversified portfolio of services, a substantial portion of its revenue is generated from executive search. This reliance exposes the company to specific downturns or increased competition within this segment, limiting its ability to mitigate overall market fluctuations through other business lines.
AI Analysis | Feedback
The rapid development and adoption of advanced Artificial Intelligence (AI) and Machine Learning (ML) platforms by independent technology providers pose a clear emerging threat. These platforms could automate or significantly streamline key services traditionally offered by Korn Ferry, specifically in:
- **Executive and Professional Talent Sourcing, Assessment, and Matching:** Highly sophisticated AI tools could allow companies to identify, vet, and recruit top talent more efficiently and at a lower cost directly, potentially reducing their reliance on executive search firms and Recruitment Process Outsourcing (RPO) providers.
- **Automated Organizational Consulting:** AI-driven analytics and recommendation engines could analyze organizational structures, talent data, and market trends to provide strategic insights and recommendations for organizational design, succession planning, leadership development, and total rewards. If these platforms become sufficiently advanced and widely adopted by clients, they could reduce the need for traditional human consultants.
This threat is analogous to historical disruptions where new technology and business models offered superior or more cost-effective alternatives to established services.
AI Analysis | Feedback
Korn Ferry (NYSE: KFY) operates within several significant addressable markets for its diverse range of organizational consulting services, executive search, recruitment process outsourcing (RPO), professional search, and digital talent solutions.
Executive Search
The global executive search services market is estimated to be between USD 10.0 billion and USD 30.0 billion by 2025. Other projections indicate the market size at USD 58.13 billion in 2025, with a forecast to reach USD 94.73 billion by 2030, growing at a compound annual growth rate (CAGR) of 10.26%. Another report places the global executive search market at USD 63.99 billion in 2026, growing from USD 58.13 billion in 2025, and is projected to reach USD 103.54 billion by 2031 with a CAGR of 10.11%. North America is a significant region in this market, holding 38.20% of the market share in 2025 and is projected to grow substantially. The U.S. market alone for executive search services is estimated at USD 12.3 billion in 2024.
Organizational Consulting
The broader global management consulting market is estimated to be around USD 240 billion to USD 280 billion. A more expansive view suggests the global management consultants market was USD 1.1 trillion in 2024 and is projected to remain at USD 1.1 trillion in 2025. Specifically, the organization and change management consulting market is projected to grow from USD 1.63 billion in 2025 to USD 1.75 billion in 2026, and is expected to reach USD 2.35 billion by 2030, growing at a CAGR of 7.7%.
Recruitment Process Outsourcing (RPO) & Professional Search
The global recruitment process outsourcing (RPO) market size reached USD 9.4 billion in 2024 and is expected to grow to USD 36.4 billion by 2033, demonstrating a CAGR of 15.48% during 2025-2033. Other estimates show the global RPO market at USD 10.04 billion in 2025, with a projected growth to USD 22.96 billion by 2032 at a CAGR of 12.9%. Another report indicates the recruitment outsourcing market size at USD 11.87 billion in 2025, anticipated to reach USD 32.22 billion by 2030, with a CAGR of 22.11%. North America holds the largest market share, while Asia-Pacific is projected to be the fastest-growing region.
Digital & AI Solutions (HR Technology and Talent Management Software)
The global human resource (HR) technology market was valued at USD 36.0 billion in 2024 and is projected to reach USD 69.6 billion by 2033, growing at a CAGR of 7.6% from 2025-2033. The global talent management software market, a component of HR tech, was over USD 12.37 billion in 2025 and is anticipated to cross USD 40.53 billion by 2035, with a CAGR of more than 12.6% during 2026-2035. Another source estimates the talent management software market size at USD 12.70 billion in 2025, predicted to increase to approximately USD 41.13 billion by 2035, expanding at a CAGR of 12.47% from 2026 to 2035. North America dominates the HR technology market, holding over 59.9% market share in 2024, and accounted for the largest revenue share in the talent management software market in 2023.
AI Analysis | Feedback
AI Analysis | Feedback
Share Repurchases
- In September 2025, Korn Ferry's Board of Directors authorized a $250 million increase to its existing share repurchase program, raising the total available capacity to $331.4 million.
- By the end of the third quarter of fiscal year 2026 (March 2026), the company had returned approximately $113 million to shareholders through combined share repurchases and dividends.
- The quarterly stock buyback amounted to $15.92 million for the period ending January 31, 2026.
Outbound Investments
- Korn Ferry acquired Trilogy International in November 2024.
- In January 2023, the company completed the acquisition of Salo.
- Other acquisitions include Infinity Consulting Solutions in August 2022, Patina Solutions in April 2022, and Lucas Group in October 2021.
Capital Expenditures
- By the end of the third quarter of fiscal year 2026 (March 2026), Korn Ferry had invested $64 million in capital expenditures.
- These capital expenditures were primarily directed towards the Talent Suite platform, productivity tools, and other solution and product enhancements.
- The company anticipates that capital expenditures will moderate in upcoming periods, with a greater emphasis on share buybacks as technology initiatives reach maturity.
Peer Outperformance in Human Resource & Employment Services
| Industry | Names | 1Y med | 3Y med | 5Y med | Top 3 by 5Y |
|---|---|---|---|---|---|
| Construction & Engineering | 30 | -0.2% | 113.7% | 164.2% | STRL 1759% · FIX 1743% · AGX 772% |
| Marine Transportation | 5 | 59.4% | 45.4% | 119.0% | MATX 199% · KEX 146% |
| Construction Machinery & Heavy Transportation Equipment | 13 | -3.1% | 50.6% | 85.7% | CAT 293% · ALSN 241% · WAB 221% |
| Aerospace & Defense | 52 | -10.6% | 55.0% | 63.9% | ATI 1052% · FTAI 783% · HWM 623% |
| Trading Companies & Distributors | 19 | 10.3% | 39.2% | 48.0% | DXPE 455% · AIT 259% · URI 201% |
| Industrial Machinery & Supplies & Components | 72 | 10.5% | 55.8% | 38.1% | CRS 1111% · MLI 468% · SYM 292% |
| Rail Transportation | 7 | 28.5% | 62.3% | 30.6% | CSX 50% · UNP 42% · NSC 31% |
| Cargo Ground Transportation | 16 | 32.6% | 4.2% | 23.4% | XPO 276% · R 209% · ARCB 55% |
| Diversified Support Services | 34 | 14.0% | 28.3% | 23.1% | CXW 227% · OPLN 145% · CACI 119% |
| Building Products | 32 | -11.7% | 11.9% | 19.2% | GFF 332% · TT 182% · JCI 126% |
| Electrical Components & Equipment | 37 | -8.5% | 72.8% | 13.2% | POWL 2005% · BE 944% · VRT 786% |
| Industrial Conglomerates | 17 | 10.8% | 3.6% | -8.5% | CSW 117% · DD 64% · CSL 62% |
| Agricultural & Farm Machinery | 16 | 3.5% | -4.6% | -14.0% | DE 95% · TTC 10% · AGCO -8% |
| Data Processing & Outsourced Services | 6 | -24.2% | -5.0% | -20.6% | EXLS 60% · BR 6% · G -20% |
| Security & Alarm Services | 9 | -58.0% | 12.6% | -24.5% | BCO 77% |
| Office Services & Supplies | 9 | 19.5% | 19.1% | -27.0% | PBI 197% · TILE 140% · HNI 42% |
| Research & Consulting Services | 13 | -2.5% | -19.0% | -29.8% | HURN 253% · FCN 2% · BAH 1% |
| Passenger Ground Transportation | 3 | -24.2% | 62.8% | -32.2% | UBER 49% · CAR -32% · LYFT -66% |
| Environmental & Facilities Services | 29 | -32.3% | 24.2% | -32.5% | GEO 232% · CLH 184% · RSG 90% |
| Air Freight & Logistics | 12 | -28.8% | -23.9% | -39.9% | FDX 77% · EXPD 76% · CHRW 60% |
| Passenger Airlines | 11 | -2.5% | 7.6% | -40.2% | LTM 3048% · UAL 107% · DAL 92% |
| Human Resource & Employment Services ← | 22 | 11.4% | -17.1% | -44.6% | ADP 50% · PAYX 6% · FA 1% |
| Airport Services | 4 | -70.6% | -67.9% | -83.0% | JOBY -49% |
Latest Trefis Analyses
| Title | |
|---|---|
| ARTICLES |
Research & Analysis
Invest in Strategies
Wealth Management
Peer Comparisons
| Peers to compare with: |
Financials
| Median | |
|---|---|
| Name | |
| Mkt Price | 45.27 |
| Mkt Cap | 1.9 |
| Rev LTM | 5,293 |
| Op Inc LTM | 11 |
| FCF LTM | 69 |
| FCF 3Y Avg | 96 |
| CFO LTM | 110 |
| CFO 3Y Avg | 152 |
Growth & Margins
| Median | |
|---|---|
| Name | |
| Rev Chg LTM | -1.3% |
| Rev Chg 3Y Avg | -5.8% |
| Rev Chg Q | 1.7% |
| QoQ Delta Rev Chg LTM | 0.4% |
| Op Inc Chg LTM | -79.7% |
| Op Inc Chg 3Y Avg | -19.2% |
| Op Mgn LTM | 0.3% |
| Op Mgn 3Y Avg | 1.4% |
| QoQ Delta Op Mgn LTM | 0.2% |
| CFO/Rev LTM | 2.7% |
| CFO/Rev 3Y Avg | 2.5% |
| FCF/Rev LTM | 1.7% |
| FCF/Rev 3Y Avg | 1.9% |
Valuation
| Median | |
|---|---|
| Name | |
| Mkt Cap | 1.9 |
| P/S | 0.3 |
| P/Op Inc | 15.6 |
| P/EBIT | 15.6 |
| P/E | 18.7 |
| P/CFO | 17.7 |
| Total Yield | 7.1% |
| Dividend Yield | 3.2% |
| FCF Yield 3Y Avg | 5.9% |
| D/E | 0.2 |
| Net D/E | 0.1 |
Returns
| Median | |
|---|---|
| Name | |
| 1M Rtn | -5.7% |
| 3M Rtn | -9.6% |
| 6M Rtn | 47.0% |
| 12M Rtn | 20.7% |
| 3Y Rtn | -21.2% |
| 1M Excs Rtn | -5.8% |
| 3M Excs Rtn | -11.3% |
| 6M Excs Rtn | 39.3% |
| 12M Excs Rtn | 1.5% |
| 3Y Excs Rtn | -100.0% |
Comparison Analyses
Segment Financials
Revenue by Segment| $ Mil | 2026 | 2025 | 2024 | 2023 | 2022 |
|---|---|---|---|---|---|
| Consulting | 704 | 674 | 707 | 687 | 654 |
| Executive Search North America | 589 | 542 | 514 | 568 | |
| Professional Search & Interim | 566 | 507 | 544 | 507 | 298 |
| Recruitment Process Outsourcing (RPO) | 372 | 362 | 363 | 431 | 402 |
| Digital | 364 | 364 | 367 | 355 | 349 |
| Executive Search EMEA | 217 | 195 | 186 | 188 | |
| Executive Search Asia Pacific | 98 | 88 | 86 | 96 | |
| Executive Search Latin America | 28 | 29 | 29 | 31 | |
| Corporate | 0 | 0 | 0 | 0 | 0 |
| Executive Search | 940 | ||||
| Total | 2,939 | 2,761 | 2,796 | 2,864 | 2,643 |
| $ Mil | 2024 | 2023 | 2022 | 2021 | 2020 |
|---|---|---|---|---|---|
| Executive Search | 171 | 206 | 258 | 128 | 157 |
| Consulting | 114 | 109 | 116 | 82 | 18 |
| Digital | 109 | 97 | 110 | 86 | 47 |
| Professional Search & Interim | 102 | 111 | 106 | 37 | |
| Recruitment Process Outsourcing (RPO) | 40 | 53 | 59 | 32 | |
| Impairment of fixed assets | -2 | -4 | -2 | 0 | |
| Impairment of right-of-use assets | -2 | -5 | -7 | 0 | |
| Integration/acquisition costs | -15 | -15 | -8 | -1 | |
| Other income, net | -31 | -5 | 12 | -37 | |
| Restructuring charges, net | -69 | -43 | 0 | -31 | |
| Depreciation and amortization | -78 | -68 | -64 | -62 | |
| Corporate | -128 | -118 | -110 | -79 | -96 |
| Recruitment Process Outsourcing (RPO) & Professional Search | 50 | ||||
| Total | 213 | 316 | 470 | 156 | 176 |
| $ Mil | 2019 | 2018 | 2017 | 2016 | 2015 |
|---|---|---|---|---|---|
| Advisory | 1,045 | 1,092 | 1,058 | ||
| Executive Search | 739 | 733 | 614 | 488 | |
| Corporate | 384 | 319 | 275 | 300 | 346 |
| Recruitment Process Outsourcing (RPO) & Professional Search | 166 | 144 | 117 | ||
| Futurestep | 104 | 104 | |||
| Hay Group | 1,005 | ||||
| Executive Recruitment | 603 | ||||
| LTC | 266 | ||||
| Total | 2,335 | 2,288 | 2,063 | 1,899 | 1,318 |
Price Behavior
| Market Price | $71.89 | |
| First Trading Date | 02/11/1999 | |
| Distance from 52W High | -16.1% | |
| 50 Days | 200 Days | |
| DMA Price | $77.93 | $69.79 |
| DMA Trend | down | up |
| Distance from DMA | -7.7% | 3.0% |
| 3M | 1YR | |
| Volatility | 24.1% | 29.1% |
| Downside Capture | 105.63 | 52.37 |
| Upside Capture | 60.59 | 54.88 |
| Correlation (S&P 500) | 12.2% | 9.5% |
| 1M | 2M | 3M | 6M | 1Y | 3Y | |
|---|---|---|---|---|---|---|
| Beta | 0.91 | 0.83 | 0.22 | -0.09 | 0.28 | 0.75 |
| Up Beta | 1.20 | 0.28 | -0.83 | -0.63 | -0.08 | 0.69 |
| Down Beta | 1.96 | 1.02 | -0.30 | -0.97 | 0.26 | 0.67 |
| Up Capture | -7% | 49% | 82% | 41% | 32% | 61% |
| Bmk +ve Days | 6 | 16 | 27 | 66 | 132 | 424 |
| Stock +ve Days | 3 | 15 | 31 | 66 | 125 | 390 |
| Down Capture | 259% | 186% | 42% | 27% | 52% | 95% |
| Bmk -ve Days | 16 | 26 | 37 | 60 | 120 | 328 |
| Stock -ve Days | 19 | 27 | 33 | 60 | 122 | 353 |
[1] Upside and downside betas calculated using positive and negative benchmark daily returns respectively
Based On 1-Year Data
| Annualized Return | Annualized Volatility | Sharpe Ratio | Correlation with KFY | |
|---|---|---|---|---|
| KFY | 8.6% | 29.1% | 0.28 | - |
| Sector ETF (XLI) | 11.0% | 17.2% | 0.43 | 0.1% |
| Equity (SPY) | 17.1% | 12.7% | 0.95 | 8.2% |
| Gold (GLD) | -4.2% | 29.3% | -0.15 | -11.4% |
| Commodities (DBC) | 52.6% | 20.7% | 1.93 | -15.1% |
| Real Estate (VNQ) | 3.9% | 13.7% | 0.03 | 34.7% |
| Bitcoin (BTCUSD) | -24.8% | 43.7% | -0.53 | 8.5% |
Smart multi-asset allocation framework can stack odds in your favor. Learn How
Based On 5-Year Data
| Annualized Return | Annualized Volatility | Sharpe Ratio | Correlation with KFY | |
|---|---|---|---|---|
| KFY | 1.3% | 29.6% | 0.06 | - |
| Sector ETF (XLI) | 12.4% | 17.6% | 0.53 | 51.5% |
| Equity (SPY) | 13.5% | 17.1% | 0.60 | 51.9% |
| Gold (GLD) | 18.3% | 18.9% | 0.78 | -3.1% |
| Commodities (DBC) | 9.8% | 19.5% | 0.38 | 9.9% |
| Real Estate (VNQ) | 1.3% | 18.8% | -0.04 | 48.7% |
| Bitcoin (BTCUSD) | 7.2% | 51.8% | 0.32 | 25.5% |
Smart multi-asset allocation framework can stack odds in your favor. Learn How
Based On 10-Year Data
| Annualized Return | Annualized Volatility | Sharpe Ratio | Correlation with KFY | |
|---|---|---|---|---|
| KFY | 14.8% | 34.8% | 0.49 | - |
| Sector ETF (XLI) | 13.1% | 20.0% | 0.57 | 61.4% |
| Equity (SPY) | 15.3% | 17.9% | 0.72 | 58.0% |
| Gold (GLD) | 12.2% | 16.4% | 0.61 | -3.2% |
| Commodities (DBC) | 8.3% | 18.1% | 0.37 | 19.7% |
| Real Estate (VNQ) | 5.1% | 20.7% | 0.21 | 50.9% |
| Bitcoin (BTCUSD) | 63.0% | 66.2% | 1.03 | 15.5% |
Smart multi-asset allocation framework can stack odds in your favor. Learn How
Returns Analyses
Earnings Returns History
Updated 10/12/2026| Forward Returns | |||
|---|---|---|---|
| Earnings Date | 1D Returns | 5D Returns | 21D Returns |
| 9/9/2026 | -1.1% | -5.1% | -13.4% |
| 6/23/2026 | 5.8% | 4.1% | 16.2% |
| 3/9/2026 | -1.5% | -4.6% | 0.4% |
| 12/9/2025 | 4.0% | 5.9% | 5.5% |
| 9/9/2025 | 0.6% | -0.1% | -1.9% |
| 6/18/2025 | 6.5% | 10.1% | 10.3% |
| 3/11/2025 | 7.6% | 7.9% | -2.9% |
| 12/5/2024 | -8.4% | -9.5% | -14.3% |
| ... | |||
| SUMMARY STATS | |||
| # Positive | 14 | 14 | 14 |
| # Negative | 9 | 9 | 9 |
| Median Positive | 5.3% | 6.1% | 5.9% |
| Median Negative | -3.1% | -4.6% | -4.2% |
| Max Positive | 10.8% | 10.9% | 18.9% |
| Max Negative | -11.6% | -14.1% | -15.4% |
| Forward Returns | |||
|---|---|---|---|
| Earnings Date | 1D Returns | 5D Returns | 21D Returns |
| 9/9/2026 | -1.1% | -5.1% | -13.4% |
| 6/23/2026 | 5.8% | 4.1% | 16.2% |
| 3/9/2026 | -1.5% | -4.6% | 0.4% |
| 12/9/2025 | 4.0% | 5.9% | 5.5% |
| 9/9/2025 | 0.6% | -0.1% | -1.9% |
| 6/18/2025 | 6.5% | 10.1% | 10.3% |
| 3/11/2025 | 7.6% | 7.9% | -2.9% |
| 12/5/2024 | -8.4% | -9.5% | -14.3% |
| 9/5/2024 | -4.7% | -2.6% | 1.6% |
| 6/13/2024 | 10.8% | 7.3% | 8.2% |
| 3/6/2024 | 1.3% | 0.6% | -0.8% |
| 12/6/2023 | -3.1% | 4.8% | 3.9% |
| 9/7/2023 | -2.2% | -3.6% | -3.6% |
| 3/8/2023 | 5.5% | -4.2% | -9.3% |
| 12/8/2022 | -5.4% | -5.1% | -4.2% |
| 9/7/2022 | -11.6% | -14.1% | -15.4% |
| 6/22/2022 | 5.2% | 6.4% | 18.9% |
| 3/9/2022 | 3.6% | 6.2% | 6.4% |
| 12/8/2021 | 0.9% | 1.5% | 3.2% |
| 9/8/2021 | -0.3% | 0.3% | 5.0% |
| 6/22/2021 | 9.7% | 10.9% | 2.7% |
| 2/22/2021 | 8.8% | 8.8% | 11.5% |
| 11/23/2020 | 1.2% | 4.7% | 13.9% |
| SUMMARY STATS | |||
| # Positive | 14 | 14 | 14 |
| # Negative | 9 | 9 | 9 |
| Median Positive | 5.3% | 6.1% | 5.9% |
| Median Negative | -3.1% | -4.6% | -4.2% |
| Max Positive | 10.8% | 10.9% | 18.9% |
| Max Negative | -11.6% | -14.1% | -15.4% |
SEC Filings
Expand for More| Report Date | Filing Date | Filing |
|---|---|---|
| 07/31/2026 | 09/09/2026 | 10-Q |
| 04/30/2026 | 06/26/2026 | 10-K |
| 01/31/2026 | 03/11/2026 | 10-Q |
| 10/31/2025 | 12/09/2025 | 10-Q |
| 07/31/2025 | 09/09/2025 | 10-Q |
| 04/30/2025 | 06/27/2025 | 10-K |
| 01/31/2025 | 03/11/2025 | 10-Q |
| 10/31/2024 | 12/09/2024 | 10-Q |
| 07/31/2024 | 09/06/2024 | 10-Q |
| 04/30/2024 | 06/28/2024 | 10-K |
| 01/31/2024 | 03/08/2024 | 10-Q |
| 10/31/2023 | 12/08/2023 | 10-Q |
| 07/31/2023 | 09/08/2023 | 10-Q |
| 04/30/2023 | 06/28/2023 | 10-K |
| 01/31/2023 | 03/10/2023 | 10-Q |
| 10/31/2022 | 12/09/2022 | 10-Q |
| Report Date | Filing Date | Filing |
|---|---|---|
| 07/31/2026 | 09/09/2026 | 10-Q |
| 04/30/2026 | 06/26/2026 | 10-K |
| 01/31/2026 | 03/11/2026 | 10-Q |
| 10/31/2025 | 12/09/2025 | 10-Q |
| 07/31/2025 | 09/09/2025 | 10-Q |
| 04/30/2025 | 06/27/2025 | 10-K |
| 01/31/2025 | 03/11/2025 | 10-Q |
| 10/31/2024 | 12/09/2024 | 10-Q |
| 07/31/2024 | 09/06/2024 | 10-Q |
| 04/30/2024 | 06/28/2024 | 10-K |
| 01/31/2024 | 03/08/2024 | 10-Q |
| 10/31/2023 | 12/08/2023 | 10-Q |
| 07/31/2023 | 09/08/2023 | 10-Q |
| 04/30/2023 | 06/28/2023 | 10-K |
| 01/31/2023 | 03/10/2023 | 10-Q |
| 10/31/2022 | 12/09/2022 | 10-Q |
| 07/31/2022 | 09/08/2022 | 10-Q |
| 04/30/2022 | 06/28/2022 | 10-K |
| 01/31/2022 | 03/11/2022 | 10-Q |
| 10/31/2021 | 12/09/2021 | 10-Q |
| 07/31/2021 | 09/08/2021 | 10-Q |
| 04/30/2021 | 06/28/2021 | 10-K |
| 01/31/2021 | 03/11/2021 | 10-Q |
| 10/31/2020 | 12/09/2020 | 10-Q |
| 07/31/2020 | 09/08/2020 | 10-Q |
| 04/30/2020 | 07/15/2020 | 10-K |
| 01/31/2020 | 03/11/2020 | 10-Q |
| 10/31/2019 | 12/06/2019 | 10-Q |
Recent Forward Guidance
Updated 10/4/2026Latest: Q1 2027 Earnings Reported 9/9/2026
| Forward Guidance | Guidance Change | |||||||
|---|---|---|---|---|---|---|---|---|
| Metric | Source | Low | Mid | High | % Chg | % Delta | Change | Prior |
| Q2 2027 Fee Revenue | Reported | 860.00 Mil | 869.00 Mil | 878.00 Mil | 18.2% | Higher New | Guidance: 735.00 Mil for Q1 2027 | |
| Q2 2027 Adjusted EBITDA Margin | Reported | 16.8% | 17.0% | 17.2% | ||||
| Q2 2027 Adjusted Diluted EPS | Reported | 1.3 | 1.35 | 1.4 | 0 | Same New | Guidance: 1.35 for Q1 2027 | |
Prior: Q4 2026 Earnings Reported 6/23/2026
| Forward Guidance | Guidance Change | |||||||
|---|---|---|---|---|---|---|---|---|
| Metric | Source | Low | Mid | High | % Chg | % Delta | Change | Prior |
| Q1 2027 Fee Revenue | Reported | 725.00 Mil | 735.00 Mil | 745.00 Mil | -0.7% | Lower New | Guidance: 740.00 Mil for Q4 2026 | |
| Q1 2027 Diluted Earnings Per Share | Reported | 1.32 | 1.35 | 1.38 | -1.5% | Lower New | Guidance: 1.37 for Q4 2026 | |
Q3 2026 Earnings Reported 3/9/2026
| Forward Guidance | Guidance Change | |||||||
|---|---|---|---|---|---|---|---|---|
| Metric | Source | Low | Mid | High | % Chg | % Delta | Change | Prior |
| Q4 2026 Fee Revenue | Reported | 730.00 Mil | 740.00 Mil | 750.00 Mil | 7.7% | Higher New | Guidance: 687.00 Mil for Q3 2026 | |
| Q4 2026 Diluted Earnings Per Share | Reported | 1.34 | 1.37 | 1.4 | 16.1% | Higher New | Guidance: 1.18 for Q3 2026 | |
Q2 2026 Earnings Reported 12/9/2025
| Forward Guidance | Guidance Change | |||||||
|---|---|---|---|---|---|---|---|---|
| Metric | Source | Low | Mid | High | % Chg | % Delta | Change | Prior |
| Q3 2026 Fee Revenue | Reported | 680.00 Mil | 687.00 Mil | 694.00 Mil | -1.9% | Lower New | Guidance: 700.00 Mil for Q2 2026 | |
| Q3 2026 Diluted EPS | Reported | 1.15 | 1.18 | 1.21 | 4.4% | Higher New | Guidance: 1.13 for Q2 2026 | |
| Q3 2026 Adjusted Diluted EPS | Reported | 1.19 | 1.22 | 1.25 | -4.7% | Lower New | Guidance: 1.28 for Q2 2026 | |
Insider Activity
Updated 9/25/2026| # | Owner | Title | Holding | Action | Filing Date | Price | Shares | Transacted Value | Value of Held Shares | Form |
|---|---|---|---|---|---|---|---|---|---|---|
| 1 | Rozek, Robert P | EVP, CFO & CCO | Direct | Sell | 9242026 | 75.03 | 3,709 | 278,283 | 11,648,552 | Form |
| 2 | Uren, Lesley | CEO of Consulting | Direct | Sell | 7162026 | 78.75 | 2,000 | 157,500 | 2,371,087 | Form |
| 3 | Distefano, Michael | See Remarks | Direct | Sell | 7162026 | 74.55 | 3,370 | 251,234 | 5,952,975 | Form |
| 4 | Robinson, Lori Jean | Direct | Sell | 10142025 | 69.44 | 2,000 | 138,889 | 1,565,279 | Form | |
| 5 | Burnison, Gary D | CEO | Direct | Sell | 10102025 | 70.01 | 16,864 | 1,180,635 | 13,892,766 | Form |
| # | Owner | Title | Holding | Action | Filing Date | Price | Shares | Transacted Value | Value of Held Shares | Form |
|---|---|---|---|---|---|---|---|---|---|---|
| 1 | Rozek, Robert P | EVP, CFO & CCO | Direct | Sell | 9242026 | 75.03 | 3,709 | 278,283 | 11,648,552 | Form |
| 2 | Uren, Lesley | CEO of Consulting | Direct | Sell | 7162026 | 78.75 | 2,000 | 157,500 | 2,371,087 | Form |
| 3 | Distefano, Michael | See Remarks | Direct | Sell | 7162026 | 74.55 | 3,370 | 251,234 | 5,952,975 | Form |
| 4 | Robinson, Lori Jean | Direct | Sell | 10142025 | 69.44 | 2,000 | 138,889 | 1,565,279 | Form | |
| 5 | Burnison, Gary D | CEO | Direct | Sell | 10102025 | 70.01 | 16,864 | 1,180,635 | 13,892,766 | Form |
| 6 | Burnison, Gary D | CEO | Direct | Sell | 10092025 | 70.59 | 31,784 | 2,243,772 | 15,199,398 | Form |
| 7 | Burnison, Gary D | CEO | Direct | Sell | 10092025 | 70.61 | 28,352 | 2,001,972 | 17,447,346 | Form |
Investor Activity (13F)
Updated Oct 20, 2026Active managers (13F portfolio over $250M, at least 3 holdings) with a position over $5M that is either over 10% of their portfolio or held in a concentrated book of 50 or fewer total positions. Index/ETF, sovereign, bank, community-bank and charitable/donor-advised filers are excluded.
Korn Ferry — Investor Video Playlist


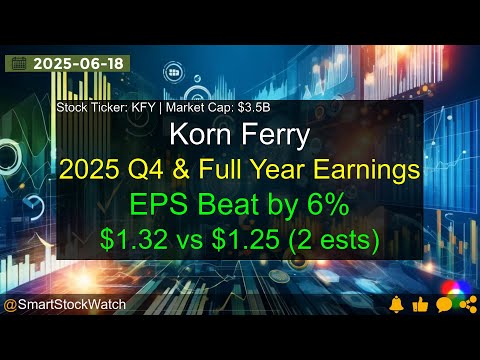

Industry Resources
| Industrials Resources |
| IndustryWeek |
| Manufacturing.net |
| Aviation Week |
| Human Resource & Employment Services Resources |
| HR Magazine (SHRM) |
| HR Dive |
| Personnel Today |
External Quote Links
| Y Finance | Barrons |
| TradingView | Morningstar |
| SeekingAlpha | ValueLine |
| Motley Fool | Robinhood |
| CNBC | Etrade |
| MarketWatch | Unusual Whales |
| YCharts | Perplexity Finance |
| FinViz |
Prefer one of these to Trefis? Tell us why.