
GE Vernova (GEV)
Market Price (10/30/2026): $863.14 | Market Cap: $228.5 BilInvestor Relations Sector: Industrials | Industry: Heavy Electrical Equipment
GE Vernova (GEV)
Market Price (10/30/2026): $863.14Market Cap: $228.5 BilSector: IndustrialsIndustry: Heavy Electrical Equipment
Investment Highlights Why It Matters Detailed financial logic regarding cash flow yields vs trend-riding momentum.
Attractive cash flow generationCFO/Rev LTMCash Flow from Operations / Revenue (Sales), Last Twelve Months (LTM) is 44%, FCF/Rev LTMFree Cash Flow / Revenue (Sales), Last Twelve Months (LTM) is 39%, CFO LTM is 19 Bil, FCF LTM is 17 Bil Valuation becoming less expensiveP/S 6M Chg %Price/Sales change over 6 months. Declining P/S indicates valuation has become less expensive. is -30% Attractive yieldFCF Yield is 7.2% Stock buyback supportStock Buyback 3Y Total is 8.7 Bil Megatrend and thematic driversMegatrends include Renewable Energy Transition, Offshore Wind Development, Sustainable Infrastructure, Hydrogen Economy, Show more. | Expensive valuation multiplesP/EBITPrice/EBIT or Price/(Operating Income) ratio is 83x Key risksGEV key risks include [1] its dependency on the pace of the energy transition and electricity demand from growth drivers like AI, Show more. |
| Attractive cash flow generationCFO/Rev LTMCash Flow from Operations / Revenue (Sales), Last Twelve Months (LTM) is 44%, FCF/Rev LTMFree Cash Flow / Revenue (Sales), Last Twelve Months (LTM) is 39%, CFO LTM is 19 Bil, FCF LTM is 17 Bil |
| Valuation becoming less expensiveP/S 6M Chg %Price/Sales change over 6 months. Declining P/S indicates valuation has become less expensive. is -30% |
| Attractive yieldFCF Yield is 7.2% |
| Stock buyback supportStock Buyback 3Y Total is 8.7 Bil |
| Megatrend and thematic driversMegatrends include Renewable Energy Transition, Offshore Wind Development, Sustainable Infrastructure, Hydrogen Economy, Show more. |
| Expensive valuation multiplesP/EBITPrice/EBIT or Price/(Operating Income) ratio is 83x |
| Key risksGEV key risks include [1] its dependency on the pace of the energy transition and electricity demand from growth drivers like AI, Show more. |
Qualitative Assessment
AI Analysis | Feedback
GE Vernova (GEV) stock has lost about 25% since 6/30/2026 because of the following key factors:
1. Macroeconomic Shift and "AI Trade" Concerns negatively impacted investor sentiment.
In August 2026, GE Vernova shares experienced a decline of approximately 12%, attributed to broader investor concerns surrounding the "AI trade". This reflected a market re-evaluation of how surging electricity demand from artificial intelligence data centers might influence the energy mix, potentially leading to perceptions of increased reliance on natural gas over some renewable energy projects in the short term, thus affecting companies in the electrification and renewable sectors like GE Vernova.
2. Persistent challenges and a negative outlook for the Wind segment weighed on performance.
GE Vernova's Wind segment continued to face significant headwinds, with management forecasting a full-year 2026 EBITDA loss of $400 million to $500 million. During fiscal Q3 2026, the U.S. onshore wind market remained soft due to factors such as permitting delays and tariff uncertainties, while offshore project execution presented ongoing risks into 2027. Analyst projections for fiscal Q3 2026 estimated an 11.9% year-over-year decline in total Wind revenues, with Wind Equipment revenues specifically anticipated to drop by 15%.
Show more
GE Vernova (GEV) stock has lost about 25% since 6/30/2026 because of the following key factors:
1. Macroeconomic Shift and "AI Trade" Concerns negatively impacted investor sentiment.
In August 2026, GE Vernova shares experienced a decline of approximately 12%, attributed to broader investor concerns surrounding the "AI trade". This reflected a market re-evaluation of how surging electricity demand from artificial intelligence data centers might influence the energy mix, potentially leading to perceptions of increased reliance on natural gas over some renewable energy projects in the short term, thus affecting companies in the electrification and renewable sectors like GE Vernova.
2. Persistent challenges and a negative outlook for the Wind segment weighed on performance.
GE Vernova's Wind segment continued to face significant headwinds, with management forecasting a full-year 2026 EBITDA loss of $400 million to $500 million. During fiscal Q3 2026, the U.S. onshore wind market remained soft due to factors such as permitting delays and tariff uncertainties, while offshore project execution presented ongoing risks into 2027. Analyst projections for fiscal Q3 2026 estimated an 11.9% year-over-year decline in total Wind revenues, with Wind Equipment revenues specifically anticipated to drop by 15%.
3. Broader renewable energy sector headwinds created an challenging operating environment.
The U.S. renewable energy sector encountered substantial challenges throughout 2026, including sweeping policy changes, compressed project timelines, and new supply chain restrictions. Additional pressures in fiscal Q3 2026 stemmed from permitting delays, elevated solar module pricing due to trade restrictions, and developers rushing to qualify for expiring tax credits, collectively impacting the market for GE Vernova's renewable energy operations.
4. Critical bottlenecks in grid infrastructure hindered growth opportunities.
Despite robust demand for electricity infrastructure driven by the expansion of AI and data centers, a significant bottleneck in grid capacity emerged as a critical issue. "Record levels" of grid connection queues were observed globally, slowing the deployment of new electricity generation and storage. This systemic issue meant that electric load was growing "faster than the grid can respond", potentially delaying GE Vernova's ability to capitalize on demand for its Electrification and Power segment offerings.
5. An analyst downgrade contributed to negative stock momentum.
In September 2026, GLJ Research downgraded GE Vernova's stock to a "Sell" rating, specifically citing "AI trade fears" as a key factor. This negative analyst action amplified investor concerns and contributed to the stock's downward trend during the specified period.
Show less
Stock Movement Drivers
Fundamental Drivers
The -24.4% change in GEV stock from 6/30/2026 to 10/29/2026 was primarily driven by a -32.4% change in the company's P/E Multiple.| (LTM values as of) | 6302026 | 10292026 | Change |
|---|---|---|---|
| Stock Price ($) | 1174.17 | 887.85 | -24.4% |
| Change Contribution By: | |||
| Total Revenues ($ Mil) | 39,374 | 44,040 | 11.9% |
| Net Income Margin (%) | 23.8% | 23.5% | -1.1% |
| P/E Multiple | 33.7 | 22.8 | -32.4% |
| Shares Outstanding (Mil) | 269 | 266 | 1.1% |
| Cumulative Contribution | -24.4% |
Market Drivers
6/30/2026 to 10/29/2026| Return | Correlation | |
|---|---|---|
| GEV | -24.4% | |
| Market (SPY) | 3.0% | 43.4% |
| Sector (XLI) | -8.2% | 62.2% |
Fundamental Drivers
The 1.8% change in GEV stock from 3/31/2026 to 10/29/2026 was primarily driven by a 83.5% change in the company's Net Income Margin (%).| (LTM values as of) | 3312026 | 10292026 | Change |
|---|---|---|---|
| Stock Price ($) | 871.94 | 887.85 | 1.8% |
| Change Contribution By: | |||
| Total Revenues ($ Mil) | 38,068 | 44,040 | 15.7% |
| Net Income Margin (%) | 12.8% | 23.5% | 83.5% |
| P/E Multiple | 48.0 | 22.8 | -52.6% |
| Shares Outstanding (Mil) | 269 | 266 | 1.1% |
| Cumulative Contribution | 1.8% |
Market Drivers
3/31/2026 to 10/29/2026| Return | Correlation | |
|---|---|---|
| GEV | 1.8% | |
| Market (SPY) | 18.6% | 48.2% |
| Sector (XLI) | 5.5% | 59.4% |
Fundamental Drivers
The 44.8% change in GEV stock from 9/30/2025 to 10/29/2026 was primarily driven by a 645.7% change in the company's Net Income Margin (%).| (LTM values as of) | 9302025 | 10292026 | Change |
|---|---|---|---|
| Stock Price ($) | 613.15 | 887.85 | 44.8% |
| Change Contribution By: | |||
| Total Revenues ($ Mil) | 36,614 | 44,040 | 20.3% |
| Net Income Margin (%) | 3.2% | 23.5% | 645.7% |
| P/E Multiple | 144.3 | 22.8 | -84.2% |
| Shares Outstanding (Mil) | 272 | 266 | 2.3% |
| Cumulative Contribution | 44.8% |
Market Drivers
9/30/2025 to 10/29/2026| Return | Correlation | |
|---|---|---|
| GEV | 44.8% | |
| Market (SPY) | 16.4% | 49.7% |
| Sector (XLI) | 11.3% | 59.6% |
Fundamental Drivers
nullnull
Market Drivers
9/30/2023 to 10/29/2026| Return | Correlation | |
|---|---|---|
| GEV | ||
| Market (SPY) | 86.2% | 54.8% |
| Sector (XLI) | 74.5% | 58.5% |
Price Returns Compared
| 2021 | 2022 | 2023 | 2024 | 2025 | 2026 | Total [1] | |
|---|---|---|---|---|---|---|---|
| Returns | |||||||
| GEV Return | - | - | - | 135% | 99% | 35% | 530% |
| Peers Return | 29% | 4% | 17% | 29% | 10% | 22% | 175% |
| S&P 500 Return | 27% | -19% | 24% | 23% | 16% | 13% | 106% |
Monthly Win Rates [3] | |||||||
| GEV Win Rate | - | - | - | 78% | 67% | 50% | |
| Peers Win Rate | 70% | 48% | 55% | 57% | 48% | 56% | |
| S&P 500 Win Rate | 75% | 42% | 67% | 75% | 67% | 50% | |
Max Drawdowns [4] | |||||||
| GEV Max Drawdown | - | - | - | - | -38% | -31% | |
| Peers Max Drawdown | -16% | -25% | -24% | -16% | -26% | -23% | |
| S&P 500 Max Drawdown | -5% | -25% | -10% | -8% | -19% | -9% | |
[1] Cumulative total returns since the beginning of 2021
[2] Peers: ETN, HON, NEE, EMR, PWR.
[3] Win Rate = % of calendar months in which monthly returns were positive
[4] Max drawdown represents maximum peak-to-trough decline within a year
[5] 2026 data is for the year up to 10/29/2026 (YTD)
How Low Can It Go
| Event | GEV | S&P 500 |
|---|---|---|
| 2025 US Tariff Shock | ||
| % Loss | -28.0% | -18.8% |
| % Gain to Breakeven | 38.9% | 23.1% |
| Time to Breakeven | 52 days | 79 days |
| 2024 Yen Carry Trade Unwind | ||
| % Loss | -11.0% | -7.8% |
| % Gain to Breakeven | 12.3% | 8.5% |
| Time to Breakeven | 20 days | 18 days |
In The Past
GE Vernova's stock fell -28.0% during the 2025 US Tariff Shock. Such a loss loss requires a 38.9% gain to breakeven.
Preserve Wealth
Limiting losses and compounding gains is essential to preserving wealth.
Asset Allocation
Actively managed asset allocation strategies protect wealth. Learn more.
| Event | GEV | S&P 500 |
|---|---|---|
| 2025 US Tariff Shock | ||
| % Loss | -28.0% | -18.8% |
| % Gain to Breakeven | 38.9% | 23.1% |
| Time to Breakeven | 52 days | 79 days |
In The Past
GE Vernova's stock fell -28.0% during the 2025 US Tariff Shock. Such a loss loss requires a 38.9% gain to breakeven.
Preserve Wealth
Limiting losses and compounding gains is essential to preserving wealth.
Asset Allocation
Actively managed asset allocation strategies protect wealth. Learn more.
About GE Vernova (GEV)
GE Vernova (GEV) is a recently established energy business focused on generating electricity and providing essential solutions for the global energy transition. The company helps power industries and communities worldwide by both producing electricity through diverse methods and developing technologies to modernize and decarbonize electrical grids.
GE Vernova operates through three key segments. Its Power segment generates and sells electricity using established sources such as hydro, gas, nuclear, and steam power, primarily serving utility companies and large industrial customers. The Wind segment is dedicated to the manufacturing and sale of wind turbine blades, catering to wind farm developers and utility companies aiming to expand their renewable energy capacity.
The Electrification segment provides critical infrastructure solutions including grid solutions, power conversion technologies, solar integration, and energy storage systems. This segment's offerings support utilities, industrial clients, and renewable energy project developers in enhancing grid stability, integrating various energy sources efficiently, and optimizing energy use and storage. In essence, GE Vernova delivers a broad spectrum of products and services, from power generation and renewable energy components to advanced grid technologies, to customers across the global energy sector.
AI Analysis | Feedback
A pure-play Siemens Energy, focused exclusively on electricity generation and grid solutions.
```AI Analysis | Feedback
- Electricity Generation: Generates and sells electricity through hydro, gas, nuclear, and steam power.
- Wind Turbine Blades: Manufactures and sells blades for wind turbines.
- Grid Solutions: Provides solutions for electrical grids.
- Power Conversion Solutions: Offers solutions for power conversion.
- Solar Solutions: Provides solutions related to solar energy.
- Storage Solutions: Offers solutions for energy storage.
AI Analysis | Feedback
GE Vernova (GEV) - Major Customers
GE Vernova (GEV) sells primarily to other companies, not individuals. While specific customer names are not disclosed in the provided company description, its major customers are typically large organizations within the energy sector. These include:
- Electric Utilities and Independent Power Producers (IPPs): These entities are responsible for generating, transmitting, and distributing electricity. They are major purchasers of power generation equipment (for hydro, gas, nuclear, steam, and wind power plants), grid solutions, and large-scale energy storage technologies.
- Renewable Energy Project Developers and Operators: Companies specializing in the development, construction, and operation of wind farms, solar power plants, and battery energy storage systems. They acquire wind turbines, solar components, and complete storage solutions from GE Vernova.
- Large Industrial and Commercial Customers: Businesses with significant energy needs that purchase power conversion, distributed solar, or energy storage solutions for their own operational efficiency, sustainability goals, or resilience requirements.
AI Analysis | Feedback
AI Analysis | Feedback
Scott Strazik Chief Executive Officer and President
Scott Strazik is the chief executive officer and president of GE Vernova, a company focused on electrifying and decarbonizing the world. He has more than 20 years of leadership, finance, and operations experience within GE, including over eight years in the company's power businesses. Strazik previously served for two years as CFO of GE Aviation's Commercial Engine Operations organization and three years as CFO of Gas Power Systems. He was named CEO of GE's Gas Power business in 2018 and expanded his role to leading the GE Power businesses in 2021. Under his leadership, GE Vernova became an independent entity in April 2024. He led the team that executed the turnaround of Gas Power and oversaw the launch and global scaling of the HA gas turbine platform.
Kenneth Parks Chief Financial Officer
Kenneth Parks is the chief financial officer of GE Vernova, a role he assumed in October 2023. He brings 38 years of comprehensive financial leadership and extensive public company CFO experience to GE Vernova. Most recently, Parks served as CFO for Owens Corning (NYSE: OC). Prior to that, he was a public company CFO at Mylan and Wesco International (NYSE: WCC). He also held the position of divisional CFO for United Technologies Corp (UTC) Fire & Security and served as Director of Investor Relations for UTC. Parks began his finance career with Coopers & Lybrand and is a Certified Public Accountant.
Jessica Uhl President
Jessica Uhl assumed the role of President at GE Vernova in January 2024, reporting directly to CEO Scott Strazik. In this role, she is responsible for overseeing Research and Development (R+D) and Business Development. Uhl served on the GE Board since 2023 and previously held the position of CFO and board member at Shell plc. She is also the Co-Chair of the Mission Possible Partnership and serves on the Board of Directors of Goldman Sachs.
Vic Abate Chief Executive Officer, Wind
Vic Abate is the chief executive officer of GE Vernova's Wind segment. He previously served as CEO of Gas Power Systems from 2013-2015, where his team launched the HA gas turbine product line, and as CEO of the Renewable Energy businesses from 2005-2013. Abate also serves as GE's Chief Technology Officer.
Eric Gray Chief Executive Officer, Power
Eric Gray is the chief executive officer of GE Vernova's Power segment. The Power segment offers a broad range of power generation solutions, including gas turbines, steam turbines, advanced and small modular reactors, and hydroelectric solutions.
AI Analysis | Feedback
The public company GE Vernova (symbol: GEV) faces several key risks to its business, primarily stemming from challenges within its Wind segment, broader macroeconomic volatility, and intense competitive pressures across its markets.
The most significant risk to GE Vernova is the **ongoing challenges and financial struggles within its Wind segment, particularly offshore wind**. The company has experienced substantial financial losses in this area, including a reported $300 million loss in the third quarter of 2024 and a $117 million loss in the second quarter of 2024 for its offshore wind business. This strain is attributed to widespread issues such as turbine blade damages and failures at major project sites like Vineyard Wind in the U.S. and the Dogger Bank project in the U.K., some linked to manufacturing flaws. Additionally, the offshore wind industry is grappling with escalating construction costs, supply chain disruptions, and unfavorable economics, leading GE Vernova to implement a restructuring plan to transform its offshore wind division into a "smaller, leaner, and more profitable" segment. The company has ceased pursuing new sales of its large offshore turbines and has not booked a single new sale for them in approximately three years due to the industry's grim prospects.
A second key risk is **exposure to macroeconomic and market volatility**. GE Vernova's operations are affected by broad economic factors, including rising costs, inflation, supply chain disruptions, and high interest rates. These factors have increased the costs of building and financing projects, impacting profitability across its segments. Volatile commodity prices and the overall economic climate can also influence investment in energy infrastructure, which is crucial for GE Vernova's demand.
Finally, **intense competition and potential pricing pressure** pose a significant risk to GE Vernova's business. The company operates in highly competitive markets within its Power, Wind, and Electrification segments. In the wind energy sector, competition is particularly fierce, with Asian competitors often offering lower prices and higher production capacity, impacting GE Vernova's market share and profitability. There is also a risk of oversupply and subsequent pricing pressure in the gas turbine market if the company and its competitors expand production capabilities faster than demand grows. The Electrification segment faces competition from major industrial conglomerates like Schneider Electric, Siemens AG, ABB, and Hitachi Energy.
AI Analysis | Feedback
The aggressive emergence and rapid global expansion of state-backed Chinese wind turbine manufacturers pose a significant threat. These manufacturers, often benefiting from subsidies and large domestic markets, are able to offer highly competitive pricing, severely pressuring the profitability and market share of established Western players like GE Vernova in the global wind energy market.
The accelerating decline in the cost of renewable energy sources (solar, wind) coupled with increasingly economical battery storage solutions threatens GE Vernova's traditional Power segment, which relies on gas, steam, and nuclear generation. As these renewable solutions become more cost-effective and widely adopted, they are actively displacing demand for new large-scale conventional power plants and accelerating the retirement of existing ones, potentially leading to reduced demand for GE Vernova's legacy power generation equipment and services.
AI Analysis | Feedback
GE Vernova (symbol: GEV) operates in significant global addressable markets across its three segments: Power, Wind, and Electrification. The company's overall total addressable market is estimated to be approximately $2 trillion globally.
Power Segment (Hydro, Gas, Nuclear, Steam Power)
- The global power generation market was valued at around USD 2.38 trillion in 2024 and is projected to grow to USD 4.93 trillion by 2033. Another estimate places the market at USD 2,300.00 billion in 2025, expected to reach USD 4,102.00 billion by 2033.
Wind Segment (Wind Turbine Blades)
- The global wind turbine market was valued at USD 170.9 billion in 2025 and is estimated to grow at a compound annual growth rate (CAGR) of 7.3% to reach USD 325.6 billion by 2034. Other reports indicate the global wind turbine market was valued at USD 66.9 billion in 2023, projected to reach USD 164.3 billion by 2033.
Electrification Segment (Grid Solutions, Power Conversion, Solar, Storage Solutions)
- Grid Solutions: The global grid modernization market was valued at USD 42,640.50 million in 2024 and is expected to reach USD 158,269.32 million by 2032. The digital grid solutions market is projected to grow from USD 36.73 billion in 2025 to USD 76.63 billion by 2030.
- Power Conversion: The global power converter market is projected to reach USD 22.3 billion by 2032. Another source indicates the global power converter market is expected to reach USD 35 billion by 2030.
- Solar: The global solar energy market was valued at USD 0.4 trillion in 2024 and is projected to reach USD 1.6 trillion by 2034.
- Storage Solutions: The global energy storage market is valued at approximately USD 660 billion, based on a five-year historical analysis. The global battery energy storage market size was valued at USD 32.62 billion in 2025 and is expected to reach USD 161.12 billion by 2034.
AI Analysis | Feedback
GE Vernova (NYSE: GEV) is poised for future revenue growth over the next 2-3 years, driven by several key factors:
- Growing Demand for Electrification and Decarbonization: The company is purpose-built to address the vital energy transition market, aiming to electrify and decarbonize the world. This overarching trend is expected to provide multi-decade growth opportunities, driving higher-margin orders and recurring service revenue.
- Increased Demand for Grid Solutions and Upgrades: GE Vernova's Electrification segment, which provides critical infrastructure for transmitting, distributing, and managing electricity, is experiencing robust demand. The company's electrification backlog has significantly expanded due to strong demand in key regions, indicating a positive outlook for revenue generation in the coming years.
- Surging AI-Related Power Demand and Data Center Growth: The rapid expansion of artificial intelligence and data centers is creating substantial electricity demand, which in turn drives growth opportunities for GE Vernova's gas turbines, grid solutions, and related power infrastructure. The company secured over $2 billion in data center-related Electrification orders last year, more than tripling the prior year's figures.
- Strong Backlog and Recurring Service Revenue in the Power Segment: The Power segment, which includes gas, steam, nuclear, and hydroelectric turbines, benefits from a substantial backlog of approximately $150 billion, effectively selling out its capacity for several years. Analysts anticipate mid-to-high-teens organic revenue growth in this segment. Additionally, recurring service revenue from this installed base contributes to sustained growth and earnings stability.
- Acquisition of Prolec GE: The acquisition of the remaining 50% stake in Prolec GE, which adds approximately $3 billion in annual grid transformer sales, is expected to be immediately accretive to EBITDA and will further establish the Electrification segment as a primary growth driver. This acquisition has also led to an upward revision in GE Vernova's 2026 financial guidance.
AI Analysis | Feedback
Share Repurchases
- GE Vernova approved an initial $6 billion share repurchase authorization in December 2024.
- The company increased its share repurchase authorization to $10 billion in December 2025.
- As of December 3, 2025, GE Vernova had spent $3.3 billion of the authorized amount on share repurchases.
Share Issuance
- Upon its spin-off from General Electric on April 2, 2024, GE Vernova distributed one share of GE Vernova common stock for every four shares of GE common stock held by shareholders as of March 19, 2024.
Outbound Investments
- GE Vernova is in the process of acquiring the remaining 50% stake in Prolec GE, with the closing expected by mid-2026.
- The acquisition of the remaining 50% stake in Prolec GE was partially financed by a $2.6 billion senior notes offering completed in February 2026.
Capital Expenditures
- GE Vernova announced plans for approximately $9 billion in cumulative global capital expenditures and research and development (R&D) investments through 2028, later updated to at least $10 billion from 2025 to 2028.
- The company plans to invest nearly $600 million in its U.S. factories and facilities over two years, focusing on gas power, grid, nuclear, and onshore wind manufacturing (announced January 2025).
- Reported capital expenditures for the fiscal year ending December 31, 2025, amounted to $1.3 billion.
Peer Outperformance in Heavy Electrical Equipment
null| Industry | Names | 1Y med | 3Y med | 5Y med | Top 3 by 5Y |
|---|---|---|---|---|---|
| Marine Transportation | 5 | 62.2% | 61.7% | 164.2% | MATX 190% · KEX 179% |
| Construction & Engineering | 29 | -9.1% | 124.5% | 157.5% | STRL 1454% · FIX 1380% · AGX 842% |
| Construction Machinery & Heavy Transportation Equipment | 13 | 6.7% | 60.8% | 105.7% | ALSN 255% · CAT 244% · WAB 224% |
| Aerospace & Defense | 52 | -9.5% | 68.1% | 70.7% | ATI 987% · FTAI 953% · HWM 604% |
| Trading Companies & Distributors | 19 | 18.7% | 47.0% | 61.3% | DXPE 435% · URI 228% · AIT 224% |
| Diversified Support Services | 34 | 19.8% | 45.3% | 38.9% | CXW 261% · OPLN 164% · CACI 134% |
| Industrial Machinery & Supplies & Components | 72 | 3.4% | 55.2% | 37.8% | CRS 919% · MLI 353% · SYM 274% |
| Electrical Components & Equipment | 37 | -8.1% | 92.5% | 36.3% | POWL 2017% · VRT 862% · BE 611% |
| Rail Transportation | 7 | 36.3% | 58.3% | 29.7% | CSX 55% · UNP 40% · NSC 30% |
| Building Products | 32 | -4.3% | 20.3% | 23.7% | GFF 371% · TT 154% · JCI 138% |
| Cargo Ground Transportation | 16 | 31.9% | 6.8% | 9.3% | R 273% · XPO 250% · ARCB 44% |
| Industrial Conglomerates | 17 | 13.6% | 8.5% | 2.0% | CSW 114% · DD 85% · CSL 76% |
| Security & Alarm Services | 9 | -51.0% | 25.8% | -14.8% | BCO 57% |
| Data Processing & Outsourced Services | 6 | -20.9% | 0.4% | -17.2% | EXLS 68% · BR 9% · G -15% |
| Agricultural & Farm Machinery | 16 | 5.1% | -5.6% | -19.6% | DE 106% · TTC 22% · AGCO 3% |
| Environmental & Facilities Services | 29 | -28.8% | 31.1% | -22.4% | GEO 249% · CLH 175% · RSG 87% |
| Office Services & Supplies | 9 | 21.5% | 17.4% | -22.5% | PBI 189% · TILE 161% · HNI 52% |
| Research & Consulting Services | 13 | 7.4% | -14.4% | -27.2% | HURN 285% · FCN 26% · BAH 7% |
| Passenger Airlines | 11 | 0.7% | 45.8% | -31.5% | LTM 2966% · UAL 128% · SKYW 124% |
| Passenger Ground Transportation | 3 | -22.2% | 53.8% | -34.3% | UBER 50% · CAR -34% · LYFT -64% |
| Air Freight & Logistics | 12 | -24.3% | -8.2% | -39.8% | FDX 80% · EXPD 71% · CHRW 48% |
| Human Resource & Employment Services | 22 | 17.5% | -7.3% | -42.9% | ADP 42% · FA 25% · PAYX 3% |
| Airport Services | 4 | -53.6% | -57.2% | -85.9% | JOBY -41% |
Latest Trefis Analyses
Research & Analysis
Invest in Strategies
Wealth Management
Peer Comparisons
| Peers to compare with: |
Financials
| Median | |
|---|---|
| Name | |
| Mkt Price | 304.70 |
| Mkt Cap | 122.9 |
| Rev LTM | 31,465 |
| Op Inc LTM | 4,586 |
| FCF LTM | 3,697 |
| FCF 3Y Avg | 3,797 |
| CFO LTM | 4,431 |
| CFO 3Y Avg | 4,846 |
Growth & Margins
| Median | |
|---|---|
| Name | |
| Rev Chg LTM | 16.2% |
| Rev Chg 3Y Avg | 10.9% |
| Rev Chg Q | 14.2% |
| QoQ Delta Rev Chg LTM | 3.5% |
| Op Inc Chg LTM | 26.9% |
| Op Inc Chg 3Y Avg | 16.2% |
| Op Mgn LTM | 18.7% |
| Op Mgn 3Y Avg | 18.2% |
| QoQ Delta Op Mgn LTM | 0.6% |
| CFO/Rev LTM | 18.7% |
| CFO/Rev 3Y Avg | 16.3% |
| FCF/Rev LTM | 13.6% |
| FCF/Rev 3Y Avg | 13.7% |
Segment Financials
Revenue by Segment| $ Mil | 2025 | 2024 | 2023 | 2022 |
|---|---|---|---|---|
| Power | 19,767 | 18,127 | 17,436 | 16,124 |
| Electrification | 9,642 | 7,550 | 6,378 | 5,076 |
| Wind | 9,110 | 9,701 | 9,826 | 8,905 |
| Other revenues and elimination of intersegment revenues | -451 | -442 | -401 | -451 |
| Total | 38,068 | 34,936 | 33,239 | 29,654 |
| $ Mil | 2025 | 2024 |
|---|---|---|
| Power | 26,663 | 24,161 |
| Other | 15,709 | 9,952 |
| Wind | 11,444 | 9,970 |
| Electrification | 9,201 | 7,402 |
| Total | 63,017 | 51,485 |
Price Behavior
| Market Price | $887.85 | |
| Market Cap ($ Bil) | 236.2 | |
| First Trading Date | 04/02/2024 | |
| Distance from 52W High | -24.4% | |
| 50 Days | 200 Days | |
| DMA Price | $936.65 | $942.68 |
| DMA Trend | down | up |
| Distance from DMA | -5.2% | -5.8% |
| 3M | 1YR | |
| Volatility | 46.8% | 53.6% |
| Downside Capture | 263.59 | 192.23 |
| Upside Capture | 149.33 | 218.57 |
| Correlation (S&P 500) | 45.9% | 49.9% |
| 1M | 2M | 3M | 6M | 1Y | 3Y | |
|---|---|---|---|---|---|---|
| Beta | 1.15 | 1.19 | 1.62 | 1.93 | 1.97 | 0.33 |
| Up Beta | -1.20 | 0.40 | 2.50 | 2.38 | 1.98 | 0.11 |
| Down Beta | 1.57 | 2.51 | 0.14 | 0.99 | 1.67 | 0.43 |
| Up Capture | 168% | 111% | 112% | 215% | 405% | 1378% |
| Bmk +ve Days | 6 | 16 | 27 | 66 | 132 | 424 |
| Stock +ve Days | 14 | 24 | 33 | 66 | 130 | 339 |
| Down Capture | 78% | 169% | 226% | 199% | 149% | 109% |
| Bmk -ve Days | 16 | 26 | 37 | 60 | 120 | 328 |
| Stock -ve Days | 7 | 17 | 30 | 59 | 119 | 284 |
[1] Upside and downside betas calculated using positive and negative benchmark daily returns respectively
Based On 1-Year Data
| Annualized Return | Annualized Volatility | Sharpe Ratio | Correlation with GEV | |
|---|---|---|---|---|
| GEV | 56.2% | 53.6% | 1.01 | - |
| Sector ETF (XLI) | 11.0% | 17.2% | 0.43 | 59.9% |
| Equity (SPY) | 13.0% | 12.7% | 0.67 | 49.7% |
| Gold (GLD) | 1.2% | 28.4% | 0.03 | 20.8% |
| Commodities (DBC) | 49.5% | 20.6% | 1.83 | -8.2% |
| Real Estate (VNQ) | 7.2% | 14.0% | 0.25 | -2.2% |
| Bitcoin (BTCUSD) | -29.5% | 43.4% | -0.69 | 22.6% |
Smart multi-asset allocation framework can stack odds in your favor. Learn How
Based On 5-Year Data
| Annualized Return | Annualized Volatility | Sharpe Ratio | Correlation with GEV | |
|---|---|---|---|---|
| GEV | 44.9% | 53.3% | 1.54 | - |
| Sector ETF (XLI) | 11.9% | 17.6% | 0.51 | 58.5% |
| Equity (SPY) | 12.6% | 17.1% | 0.55 | 54.8% |
| Gold (GLD) | 17.2% | 18.9% | 0.73 | 14.2% |
| Commodities (DBC) | 9.4% | 19.5% | 0.36 | 7.5% |
| Real Estate (VNQ) | 1.0% | 18.9% | -0.06 | 12.3% |
| Bitcoin (BTCUSD) | 5.1% | 51.6% | 0.28 | 23.9% |
Smart multi-asset allocation framework can stack odds in your favor. Learn How
Based On 10-Year Data
| Annualized Return | Annualized Volatility | Sharpe Ratio | Correlation with GEV | |
|---|---|---|---|---|
| GEV | 20.4% | 53.3% | 1.54 | - |
| Sector ETF (XLI) | 13.4% | 20.1% | 0.58 | 58.5% |
| Equity (SPY) | 15.4% | 17.9% | 0.73 | 54.8% |
| Gold (GLD) | 11.8% | 16.4% | 0.58 | 14.2% |
| Commodities (DBC) | 8.1% | 18.1% | 0.36 | 7.5% |
| Real Estate (VNQ) | 5.2% | 20.7% | 0.21 | 12.3% |
| Bitcoin (BTCUSD) | 62.3% | 66.2% | 1.02 | 23.9% |
Smart multi-asset allocation framework can stack odds in your favor. Learn How
Earnings Returns History
Updated 10/30/2026| Forward Returns | |||
|---|---|---|---|
| Earnings Date | 1D Returns | 5D Returns | 21D Returns |
| 10/28/2026 | -1.9% | ||
| 7/22/2026 | -8.7% | -12.6% | -8.5% |
| 4/22/2026 | 13.7% | 9.8% | 3.4% |
| 1/28/2026 | 2.7% | 12.6% | 26.5% |
| 10/22/2025 | -1.6% | -2.5% | 1.7% |
| 4/23/2025 | 3.1% | 13.8% | 38.9% |
| 1/22/2025 | 2.7% | -14.6% | -13.5% |
| 10/23/2024 | 1.3% | 8.1% | 24.0% |
| ... | |||
| SUMMARY STATS | |||
| # Positive | 6 | 5 | 7 |
| # Negative | 4 | 4 | 2 |
| Median Positive | 2.7% | 9.8% | 10.6% |
| Median Negative | -3.2% | -8.6% | -11.0% |
| Max Positive | 13.7% | 13.8% | 38.9% |
| Max Negative | -8.7% | -14.6% | -13.5% |
| Forward Returns | |||
|---|---|---|---|
| Earnings Date | 1D Returns | 5D Returns | 21D Returns |
| 10/28/2026 | -1.9% | ||
| 7/22/2026 | -8.7% | -12.6% | -8.5% |
| 4/22/2026 | 13.7% | 9.8% | 3.4% |
| 1/28/2026 | 2.7% | 12.6% | 26.5% |
| 10/22/2025 | -1.6% | -2.5% | 1.7% |
| 4/23/2025 | 3.1% | 13.8% | 38.9% |
| 1/22/2025 | 2.7% | -14.6% | -13.5% |
| 10/23/2024 | 1.3% | 8.1% | 24.0% |
| 7/24/2024 | -4.5% | -4.6% | 8.1% |
| 4/25/2024 | 1.5% | 3.8% | 10.6% |
| SUMMARY STATS | |||
| # Positive | 6 | 5 | 7 |
| # Negative | 4 | 4 | 2 |
| Median Positive | 2.7% | 9.8% | 10.6% |
| Median Negative | -3.2% | -8.6% | -11.0% |
| Max Positive | 13.7% | 13.8% | 38.9% |
| Max Negative | -8.7% | -14.6% | -13.5% |
SEC Filings
Expand for More| Report Date | Filing Date | Filing |
|---|---|---|
| 09/30/2026 | 10/28/2026 | 10-Q |
| 06/30/2026 | 07/22/2026 | 10-Q |
| 03/31/2026 | 04/22/2026 | 10-Q |
| 12/31/2025 | 01/29/2026 | 10-K |
| 09/30/2025 | 10/22/2025 | 10-Q |
| 06/30/2025 | 07/23/2025 | 10-Q |
| 03/31/2025 | 04/23/2025 | 10-Q |
| 12/31/2024 | 02/06/2025 | 10-K |
| 09/30/2024 | 10/23/2024 | 10-Q |
| 06/30/2024 | 07/24/2024 | 10-Q |
| 03/31/2024 | 04/30/2024 | 10-Q |
| 12/31/2023 | 03/13/2024 | S-1 |
| Report Date | Filing Date | Filing |
|---|---|---|
| 09/30/2026 | 10/28/2026 | 10-Q |
| 06/30/2026 | 07/22/2026 | 10-Q |
| 03/31/2026 | 04/22/2026 | 10-Q |
| 12/31/2025 | 01/29/2026 | 10-K |
| 09/30/2025 | 10/22/2025 | 10-Q |
| 06/30/2025 | 07/23/2025 | 10-Q |
| 03/31/2025 | 04/23/2025 | 10-Q |
| 12/31/2024 | 02/06/2025 | 10-K |
| 09/30/2024 | 10/23/2024 | 10-Q |
| 06/30/2024 | 07/24/2024 | 10-Q |
| 03/31/2024 | 04/30/2024 | 10-Q |
| 12/31/2023 | 03/13/2024 | S-1 |
Recent Forward Guidance
Updated 10/29/2026Latest: Q3 2026 Earnings Reported 10/28/2026
| Forward Guidance | Guidance Change | |||||||
|---|---|---|---|---|---|---|---|---|
| Metric | Source | Low | Mid | High | % Chg | % Delta | Change | Prior |
| Q4 2026 Backlog | Reported | 200.00 Bil | 200.00 Bil | |||||
| 2026 Gas Equipment Under Contract | Reported | 130 | 130 | |||||
| 2026 Revenue | Reported | 46.50 Bil | 47.00 Bil | 47.50 Bil | 2.2% | Raised | Guidance: 46.00 Bil for 2026 | |
| 2026 Power Organic Revenue Growth | Reported | 19.0% | 20.0% | 21.0% | 1.0% | Raised | Guidance: 19.0% for 2026 | |
| 2026 Electrification Revenue | Reported | 14.50 Bil | 14.75 Bil | 15.00 Bil | 0 | Affirmed | Guidance: 14.75 Bil for 2026 | |
| 2026 Wind Organic Revenue Growth | Reported | -5.0% | ||||||
| 2026 Adjusted EBITDA Margin | Reported | 13.5% | 14.0% | 14.5% | 1.0% | Raised | Guidance: 13.0% for 2026 | |
| 2026 Power Segment EBITDA Margin | Reported | 19.0% | 20.0% | 21.0% | 2.0% | Raised | Guidance: 18.0% for 2026 | |
| 2026 Electrification Segment EBITDA Margin | Reported | 18.0% | 19.0% | 20.0% | 0 | Affirmed | Guidance: 19.0% for 2026 | |
| 2026 Wind Segment EBITDA Loss | Reported | -500.00 Mil | -450.00 Mil | -400.00 Mil | 12.5% | Lowered | Guidance: -400.00 Mil for 2026 | |
| 2026 Free Cash Flow | Reported | 16.00 Bil | 16.50 Bil | 17.00 Bil | 37.5% | Raised | Guidance: 12.00 Bil for 2026 | |
Prior: Q2 2026 Earnings Reported 7/22/2026
| Forward Guidance | Guidance Change | |||||||
|---|---|---|---|---|---|---|---|---|
| Metric | Source | Low | Mid | High | % Chg | % Delta | Change | Prior |
| 2026 Revenue | Reported | 45.50 Bil | 46.00 Bil | 46.50 Bil | 2.2% | Raised | Guidance: 45.00 Bil for 2026 | |
| 2026 Power Organic Revenue Growth | Reported | 18.0% | 19.0% | 20.0% | 2.0% | Raised | Guidance: 17.0% for 2026 | |
| 2026 Electrification Revenue | Reported | 14.50 Bil | 14.75 Bil | 15.00 Bil | 3.5% | Raised | Guidance: 14.25 Bil for 2026 | |
| 2026 Adjusted EBITDA Margin | Reported | 12.0% | 13.0% | 14.0% | 0.0% | Affirmed | Guidance: 13.0% for 2026 | |
| 2026 Power Segment EBITDA Margin | Reported | 17.0% | 18.0% | 19.0% | 0.0% | Affirmed | Guidance: 18.0% for 2026 | |
| 2026 Electrification Segment EBITDA Margin | Reported | 18.0% | 19.0% | 20.0% | 0.0% | Affirmed | Guidance: 19.0% for 2026 | |
| 2026 Wind Segment EBITDA Losses | Reported | -400.00 Mil | -400.00 Mil | -400.00 Mil | 0.0% | Affirmed | Guidance: -400.00 Mil for 2026 | |
| 2026 Free Cash Flow | Reported | 11.50 Bil | 12.00 Bil | 12.50 Bil | 71.4% | Raised | Guidance: 7.00 Bil for 2026 | |
Q1 2026 Earnings Reported 4/22/2026
| Forward Guidance | Guidance Change | |||||||
|---|---|---|---|---|---|---|---|---|
| Metric | Source | Low | Mid | High | % Chg | % Delta | Change | Prior |
| 2026 Gas Power Backlog and Slot Reservation Agreements | Reported | 110.00 Bil | ||||||
| 2026 Revenue | Reported | 44.50 Bil | 45.00 Bil | 45.50 Bil | 1.1% | Raised | Guidance: 44.50 Bil for 2026 | |
| 2026 Power Organic Revenue Growth | Reported | 16.0% | 17.0% | 18.0% | ||||
| 2026 Electrification Revenue | Reported | 14.00 Bil | 14.25 Bil | 14.50 Bil | ||||
| 2026 Adjusted EBITDA Margin | Reported | 12.0% | 13.0% | 14.0% | 1.0% | Raised | Guidance: 12.0% for 2026 | |
| 2026 Power Segment EBITDA Margin | Reported | 17.0% | 18.0% | 19.0% | ||||
| 2026 Electrification Segment EBITDA Margin | Reported | 18.0% | 19.0% | 20.0% | ||||
| 2026 Wind Segment EBITDA Losses | Reported | -400.00 Mil | ||||||
| 2026 Free Cash Flow | Reported | 6.50 Bil | 7.00 Bil | 7.50 Bil | 33.3% | Raised | Guidance: 5.25 Bil for 2026 | |
Q4 2025 Earnings Reported 1/28/2026
| Forward Guidance | Guidance Change | |||||||
|---|---|---|---|---|---|---|---|---|
| Metric | Source | Low | Mid | High | % Chg | % Delta | Change | Prior |
| 2026 Revenue | Reported | 44.00 Bil | 44.50 Bil | 45.00 Bil | 21.9% | Higher New | Guidance: 36.50 Bil for 2025 | |
| 2026 Adjusted EBITDA Margin | Reported | 11.0% | 12.0% | 13.0% | 3.5% | Higher New | Guidance: 8.5% for 2025 | |
| 2026 Free Cash Flow | Reported | 5.00 Bil | 5.25 Bil | 5.50 Bil | 61.5% | Higher New | Guidance: 3.25 Bil for 2025 | |
| 2028 Revenue | Reported | 56.00 Bil | Higher New | |||||
| 2028 Adjusted EBITDA Margin | Reported | 20.0% | Higher New | |||||
| 2028 Cumulative Free Cash Flow | Reported | 24.00 Bil | Higher New | |||||
Insider Activity
Updated 6/3/2026| # | Owner | Title | Holding | Action | Filing Date | Price | Shares | Transacted Value | Value of Held Shares | Form |
|---|---|---|---|---|---|---|---|---|---|---|
| 1 | Abate, Victor | Chief Executive Officer, Wind | Direct | Sell | 6032026 | 948.08 | 4,819 | 4,568,798 | 1,739,727 | Form |
| 2 | Potvin, Matthew Joseph | Chief Accounting Officer | Direct | Sell | 5182026 | 1059.09 | 2,333 | 2,470,857 | 3,758,710 | Form |
| 3 | Baert, Steven | Chief People Officer | Direct | Sell | 3032026 | 850.00 | 5,300 | 4,505,000 | 10,749,100 | Form |
| 4 | Parks, Kenneth Scott | Chief Financial Officer | Direct | Sell | 8272025 | 620.00 | 3,300 | 2,046,000 | 4,705,800 | Form |
| # | Owner | Title | Holding | Action | Filing Date | Price | Shares | Transacted Value | Value of Held Shares | Form |
|---|---|---|---|---|---|---|---|---|---|---|
| 1 | Abate, Victor | Chief Executive Officer, Wind | Direct | Sell | 6032026 | 948.08 | 4,819 | 4,568,798 | 1,739,727 | Form |
| 2 | Potvin, Matthew Joseph | Chief Accounting Officer | Direct | Sell | 5182026 | 1059.09 | 2,333 | 2,470,857 | 3,758,710 | Form |
| 3 | Baert, Steven | Chief People Officer | Direct | Sell | 3032026 | 850.00 | 5,300 | 4,505,000 | 10,749,100 | Form |
| 4 | Parks, Kenneth Scott | Chief Financial Officer | Direct | Sell | 8272025 | 620.00 | 3,300 | 2,046,000 | 4,705,800 | Form |
Investor Activity (13F)
Updated Oct 30, 2026Active managers (13F portfolio over $250M, at least 3 holdings) with a position over $5M that is either over 10% of their portfolio or held in a concentrated book of 50 or fewer total positions. Index/ETF, sovereign, bank, community-bank and charitable/donor-advised filers are excluded.
| Active Manager | Value | % of Portfolio | Total Positions | QoQ | Filing |
|---|---|---|---|---|---|
| Sirios Capital Management L P | $107.3 Mil | 13.0% | 81 | TRIM -23.5% | 13F |
| Thames Capital Management LLC | $44.0 Mil | 7.9% | 43 | TRIM -7.4% | 13F |
| Codex Capital Asset Management L.L.C. | $18.5 Mil | 7.2% | 31 | Hold | 13F |
| Night Owl Capital Management, LLC | $56.3 Mil | 6.6% | 30 | TRIM -28.7% | 13F |
| Valiant Capital Management, L.P. | $82.5 Mil | 6.5% | 28 | TRIM -7.0% | 13F |
| Mark Asset Management LP | $48.8 Mil | 6.5% | 31 | TRIM -5.3% | 13F |
| One Madison Group LLC | $52.4 Mil | 6.0% | 28 | TRIM -9.1% | 13F |
| 11 Capital Partners LP | $17.3 Mil | 5.6% | 19 | TRIM -11.3% | 13F |
| Amanah Holdings Trust | $45.5 Mil | 5.0% | 20 | Hold | 13F |
| Pennant Investors, LP | $17.9 Mil | 5.0% | 17 | TRIM -9.3% | 13F |
| DSM Capital Partners LLC | $205.7 Mil | 3.6% | 44 | TRIM -16.8% | 13F |
| M37 Management LP | $8.7 Mil | 3.5% | 12 | Hold | 13F |
| First Washington CORP | $9.0 Mil | 2.6% | 50 | TRIM -24.1% | 13F |
| KADENSA CAPITAL Ltd | $16.1 Mil | 2.2% | 39 | TRIM -48.3% | 13F |
| Bender Robert & Associates | $9.2 Mil | 2.2% | 45 | ADD +45.2% | 13F |
| Mar Vista Investment Partners LLC | $20.2 Mil | 2.0% | 35 | ADD +353.8% | 13F |
| Slate Path Capital LP | $101.7 Mil | 1.5% | 44 | Hold | 13F |
| Kinetic Partners Management, LP | $26.5 Mil | 1.5% | 49 | ADD +239.2% | 13F |
| Varenne Capital Partners | $5.5 Mil | 1.4% | 27 | TRIM -19.6% | 13F |
| Parker Investment Management, LLC | $8.2 Mil | 1.3% | 37 | New | 13F |
| Archon Partners LLC | $9.6 Mil | 1.1% | 39 | Hold | 13F |
| Allen Operations LLC | $7.3 Mil | 1.1% | 36 | Hold | 13F |
| Electron Capital Partners, LLC | $12.5 Mil | 0.6% | 44 | TRIM -9.7% | 13F |
| Active Manager | Value | % of Portfolio | Total Positions | QoQ | As Of | Filing |
|---|---|---|---|---|---|---|
| Value Aligned Research Advisors, LLC | $177.3 Mil | 3.6% | 47 | Exited | Dec 31, 2025 | 13F |
| Anomaly Capital Management, LP | $41.0 Mil | 1.5% | 32 | Exited | Dec 31, 2025 | 13F |
| WT Asset Management Ltd | $39.0 Mil | 1.6% | 42 | Exited | Dec 31, 2025 | 13F |
| Goodlander Investment Management, LLC | $29.4 Mil | 11.2% | 11 | Exited | Dec 31, 2025 | 13F |
| Owl Creek Asset Management, L.P. | $18.4 Mil | 2.2% | 30 | Exited | Dec 31, 2025 | 13F |
| Incline Global Management LLC | $10.8 Mil | 3.7% | 30 | Exited | Dec 31, 2025 | 13F |
| VMS Asset Management Limited | $5.6 Mil | 2.2% | 42 | Exited | Dec 31, 2025 | 13F |
| KADENSA CAPITAL Ltd | $16.1 Mil | 2.2% | 39 | TRIM -48.3% | Mar 31, 2026 | 13F |
| Night Owl Capital Management, LLC | $56.3 Mil | 6.6% | 30 | TRIM -28.7% | Mar 31, 2026 | 13F |
| First Washington CORP | $9.0 Mil | 2.6% | 50 | TRIM -24.1% | Mar 31, 2026 | 13F |
| Sirios Capital Management L P | $107.3 Mil | 13.0% | 81 | TRIM -23.5% | Mar 31, 2026 | 13F |
| Varenne Capital Partners | $5.5 Mil | 1.4% | 27 | TRIM -19.6% | Mar 31, 2026 | 13F |
| DSM Capital Partners LLC | $205.7 Mil | 3.6% | 44 | TRIM -16.8% | Mar 31, 2026 | 13F |
| 11 Capital Partners LP | $17.3 Mil | 5.6% | 19 | TRIM -11.3% | Mar 31, 2026 | 13F |
| Electron Capital Partners, LLC | $12.5 Mil | 0.6% | 44 | TRIM -9.7% | Mar 31, 2026 | 13F |
| Pennant Investors, LP | $17.9 Mil | 5.0% | 17 | TRIM -9.3% | Mar 31, 2026 | 13F |
| One Madison Group LLC | $52.4 Mil | 6.0% | 28 | TRIM -9.1% | Mar 31, 2026 | 13F |
| Thames Capital Management LLC | $44.0 Mil | 7.9% | 43 | TRIM -7.4% | Mar 31, 2026 | 13F |
| Valiant Capital Management, L.P. | $82.5 Mil | 6.5% | 28 | TRIM -7.0% | Mar 31, 2026 | 13F |
| Mark Asset Management LP | $48.8 Mil | 6.5% | 31 | TRIM -5.3% | Mar 31, 2026 | 13F |
| Active Manager | Value | % of Portfolio | Total Positions | QoQ | Filing |
|---|---|---|---|---|---|
| DSM Capital Partners LLC | $205.7 Mil | 3.6% | 44 | TRIM -16.8% | 13F |
| Sirios Capital Management L P | $107.3 Mil | 13.0% | 81 | TRIM -23.5% | 13F |
| Slate Path Capital LP | $101.7 Mil | 1.5% | 44 | Hold | 13F |
| Valiant Capital Management, L.P. | $82.5 Mil | 6.5% | 28 | TRIM -7.0% | 13F |
| Night Owl Capital Management, LLC | $56.3 Mil | 6.6% | 30 | TRIM -28.7% | 13F |
| One Madison Group LLC | $52.4 Mil | 6.0% | 28 | TRIM -9.1% | 13F |
| Mark Asset Management LP | $48.8 Mil | 6.5% | 31 | TRIM -5.3% | 13F |
| Amanah Holdings Trust | $45.5 Mil | 5.0% | 20 | Hold | 13F |
| Thames Capital Management LLC | $44.0 Mil | 7.9% | 43 | TRIM -7.4% | 13F |
| Kinetic Partners Management, LP | $26.5 Mil | 1.5% | 49 | ADD +239.2% | 13F |
| Mar Vista Investment Partners LLC | $20.2 Mil | 2.0% | 35 | ADD +353.8% | 13F |
| Codex Capital Asset Management L.L.C. | $18.5 Mil | 7.2% | 31 | Hold | 13F |
| Pennant Investors, LP | $17.9 Mil | 5.0% | 17 | TRIM -9.3% | 13F |
| 11 Capital Partners LP | $17.3 Mil | 5.6% | 19 | TRIM -11.3% | 13F |
| KADENSA CAPITAL Ltd | $16.1 Mil | 2.2% | 39 | TRIM -48.3% | 13F |
| Electron Capital Partners, LLC | $12.5 Mil | 0.6% | 44 | TRIM -9.7% | 13F |
| Archon Partners LLC | $9.6 Mil | 1.1% | 39 | Hold | 13F |
| Bender Robert & Associates | $9.2 Mil | 2.2% | 45 | ADD +45.2% | 13F |
| First Washington CORP | $9.0 Mil | 2.6% | 50 | TRIM -24.1% | 13F |
| M37 Management LP | $8.7 Mil | 3.5% | 12 | Hold | 13F |
| Parker Investment Management, LLC | $8.2 Mil | 1.3% | 37 | New | 13F |
| Allen Operations LLC | $7.3 Mil | 1.1% | 36 | Hold | 13F |
| Varenne Capital Partners | $5.5 Mil | 1.4% | 27 | TRIM -19.6% | 13F |
GEV Trade Sentinel
High Conviction
CONVICTION RATIONALE
Conviction is high as GE Vernova is in the early stages of a multi-year electricity super cycle, evidenced by accelerating orders and a $197 billion backlog. The company is demonstrating significant pricing power, with 2026 gas orders priced 50% above 2025. This combination of volume and price is driving repeated guidance increases for revenue, margin, and cash flow.
STOCK ARCHETYPE
Long-cycle project manufacturing with a large, recurring services component.(Backlog Conversion Rate * Backlog Value) + (New Service Contract Value) + (Transactional Service Revenue) Margin expansion on new, higher-priced equipment orders as they are delivered, and the continued growth of the high-margin, installed-base services business.
INVESTMENT THESIS
Evidence points to a powerful inflection, with a massive backlog being converted into rapidly expanding margins and cash generation.
- Total backlog reached $197 billion in Q3 2026.
- Book-to-bill ratio was more than 2x in Q3 2026.
- Full year 2026 gas orders pricing is ~50% higher than 2025.
- Power segment EBITDA margin expanded to 21.4% in Q3.
PRIMARY RISK
The primary risk is that in a supply-constrained environment, the company fails to execute on its large, complex projects, leading to cost overruns, delays, and margin destruction, particularly in the Wind segment.
- The company operates in a 'supply-constrained environment'.
- Fixed-price contracts carry risk if costs exceed expectations.
- Wind segment is expected to post an EBITDA loss of $400-$500 million in 2026.
- The U.S. market for new onshore wind equipment remains 'soft'.
- Offshore wind project execution in the North Sea continues for another year.
| KPI | Status | Rationale |
|---|---|---|
| Total Backlog | $197 billion as of Q3 2026 - Accelerating | The sequential dollar additions to backlog are accelerating, with the increase in Q3 surpassing the $13 billion increase from Q2. This indicates strengthening future revenue visibility and a high-quality order book, as management notes the margin profile of the backlog continues to improve. |
| Total Orders Growth | 96% year-over-year growth in Q3 2026 - Accelerating | The consistent acceleration in year-over-year order growth demonstrates powerful demand momentum across the business, particularly in the Power segment where Gas Power equipment orders increased by approximately 4x year-over-year. |
| Gas Power Gigawatts Under Contract | 122 GW (Q3 2026) | This KPI tracks the pipeline of future gas turbine equipment sales and the corresponding expansion of the installed base for the high-margin services business. The company expects this to reach at least 130 GW by the end of 2026. |
| Remaining Performance Obligation (RPO) | $ 196,721 million (As of September 30, 2026) | RPO is the total value of contracted revenue that has not yet been recognized, serving as a formal accounting measure of future revenue visibility. It is comprised of $104,054 million for equipment, as well as revenue from services. |
| Book-to-Bill Ratio | >2x (Q3 2026) | A ratio greater than 1x indicates that new orders are being booked faster than revenue is being recognized, signaling accelerating demand and future revenue growth. |
Super Cycle Strength vs. Wind Segment Drag
BULL VIEW
Bulls believe the immense demand and pricing power in Power and Electrification, driven by data centers, will generate enough profit and cash flow to make the Wind segment's turnaround challenges immaterial to the overall story.
CORE TENSION
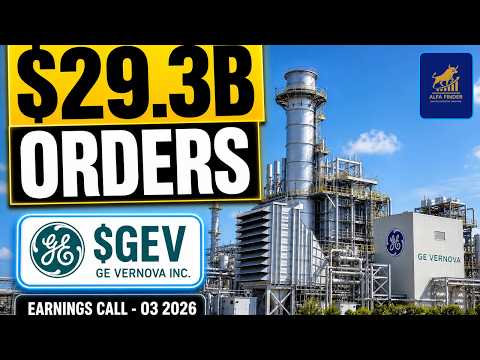
Can accelerating orders ($29.3B in Q3) and margins in Power (21.4%) fully offset the Wind segment's expected $400-$500 million annual loss, which caused a -4.0% stock drop after Q2 results?
PREVAILING SENTIMENT
The latest evidence strongly favors the bulls. Q3 results showed accelerating strength in the core businesses that far outweighs the contained weakness in Wind, accompanied by a significant guidance raise.
BEAR VIEW
Bears argue the market has previously punished the stock for Wind segment losses, and that execution risks on large, complex projects remain a significant threat to overall profitability, regardless of backlog size.
| Timeline | Event & Metric To Watch |
|---|---|
November 24, 2026 | Quarterly Dividend Payment Watch: A quarterly dividend of $0.50 per share will be paid to shareholders of record as of October 27, 2026. |
by the end of '26 | Gas Power Contract Target Watch: Company expects to have at least 130 gigawatts of Gas Power equipment under contract. |
1/25/2027 | Peer NextEra Energy Earnings Watch: Peer NextEra Energy (NEE) is scheduled to report earnings. |
1/26/2027 | Wind Segment Profitability Miss Watch: Wind segment EBITDA results and the initial 2027 outlook for the segment's profitability. |
1/27/2027 | Peer Honeywell International Earnings Watch: Peer Honeywell International (HON) is scheduled to report earnings. |
No set date | Adverse Tariff or Trade Policy Watch: U.S. government announcements on Section 232 tariffs or other trade policies affecting wind components or heavy electrical equipment. |
No set date | Gas Power Execution Bottlenecks Watch: Company or press reports on production rates, supply chain issues, or project delivery timelines for gas turbines. |
| Date | Event | Stock Impact |
|---|---|---|
2026-10-28 | Q3 Results and Strategic Actions Details: The company reported Q3 results, raised full-year guidance, announced the acquisition of Trench Group, and doubled its share repurchase authorization to $20 billion. | -1.9% $895.08 -> $878.03 |
2026-09-16 | Vineyard Wind Legal Settlement Details: The company and Vineyard Wind resolved a legal dispute concerning the wind farm project off the coast of Martha's Vineyard. | +4.8% $882.29 -> $924.39 |
2026-08-18 | Nuclear Fuel Recycling Partnership Details: SHINE Technologies joined a GE Vernova-led ARPA-E project to develop a modernized system for tracking spent nuclear fuel during recycling. | -8.5% $1078.37 -> $986.88 |
2026-07-22 | Negative Q2 Earnings Reaction Details: Following Q2 2026 results, the stock had a -4.0% two-day reaction as wind segment losses widened, overshadowing a raised outlook and record backlog. | -4.4% $1078.18 -> $1030.59 |
2026-05-19 | Third Quarter Dividend Declared Details: The Board of Directors declared a $0.50 per share quarterly dividend, payable on July 14, 2026. | +1.2% $1011.14 -> $1023.40 |
2026-04-22 | Positive Q1 Earnings Reaction Details: The company reported Q1 2026 earnings, after which the stock had a two-day reaction of 16.0%. | +16.0% $990.21 -> $1148.27 |
Position Sizing
2% - 4%
REDUCED POSITION
Sizing is volatility-based: GEV trades at roughly 51% annualized realized (three-month) volatility versus about 11% for the S&P 500 (4.7x the market). A 2% - 4% position keeps a single-name swing of that size within a diversified portfolio's risk budget.
Diversification Alternatives
ETN - Eaton
Pure-Play ElectrificationEaton offers more focused exposure to the electrical equipment cycle without the project execution risk of large-scale power generation or the drag from a wind turbine business. It also has substantially higher operating margins.
HON - Honeywell International
Diversified Industrial LeaderHoneywell provides exposure to similar industrial and energy transition trends but within a more diversified portfolio including aerospace and building technologies, offering lower volatility than a pure-play energy infrastructure company.
A long-cycle industrial pure-play on the global electricity super-cycle, converting a massive, high-margin backlog into predictable revenue and cash flow.
GE Vernova is capitalizing on unprecedented demand for electricity driven by data centers, grid modernization, and the energy transition. Its core Power and Electrification segments are booking multi-year backlogs at significantly higher prices, providing strong visibility into future growth. While the Wind segment is in a turnaround, the company's overall financial strength is driven by its dominant position in gas power and grid infrastructure, which are essential for both electrification and decarbonization.
Continued multi-billion dollar order announcements in Power and Electrification, sustained margin expansion in quarterly results, and successful conversion of the large backlog into revenue and free cash flow.
A significant slowdown in data center build-outs, major project cancellations, or a return to significant losses in the Wind segment due to execution issues.
Short-term stock price volatility unrelated to fundamental order and margin trends, as mentioned in news reports from October.
Repricing Catalyst
The ongoing conversion of its rapidly growing, higher-margin backlog into reported revenue and earnings, demonstrating the company's ability to execute and capture the benefits of the current strong demand cycle.
Power
$21.0B TTM (51% of Total)What It Is
The Power segment sells products and services for energy production to power generation, industrial, and government customers. Offerings include gas and steam turbines, nuclear reactor technology, and hydropower solutions, along with a full suite of upgrade and service solutions.
Who Pays & How
Utilities, independent power producers, and large power consumers like data centers pay for reliable and dispatchable power generation equipment and services. They choose GE Vernova for its technology, which supports grid stability and rising electricity demand, as well as its extensive installed base and service capabilities.
Competition
Electrification
$12.2B TTM (30% of Total)What It Is
The Electrification segment provides products and services for the transmission, distribution, conversion, storage, and orchestration of electricity. Offerings include grid solutions (like HVDC), power transformers, switchgear, and software sold to power utilities and industries.
Who Pays & How
Power utilities and industrial customers, including data centers, pay for equipment and software needed to expand and modernize grid infrastructure. They choose GE Vernova to manage electricity from generation to consumption, connect renewables, and improve grid reliability and efficiency.
Competition
Wind
$8.5B TTM (20% of Total)What It Is
The Wind segment engineers, manufactures, and commercializes wind generation technologies, including onshore and offshore wind turbines and blades. It also provides services to improve asset performance over their lifetime.
Who Pays & How
Utilities and project developers pay for wind turbines and services to generate carbon-free electricity. The company is focusing on 'workhorse products' in select geographies to improve reliability and profitability.
Competition
GE Vernova — Investor Video Playlist




Industry Resources
| Industrials Resources |
| IndustryWeek |
| Manufacturing.net |
| Aviation Week |
| Heavy Electrical Equipment Resources |
| Power Engineering |
| Electrical Review |
| IEEE Power & Energy Magazine |
External Quote Links
| Y Finance | Barrons |
| TradingView | Morningstar |
| SeekingAlpha | ValueLine |
| Motley Fool | Robinhood |
| CNBC | Etrade |
| MarketWatch | Unusual Whales |
| YCharts | Perplexity Finance |
| FinViz |
Prefer one of these to Trefis? Tell us why.