
Enovix (ENVX)
Market Price (10/23/2026): $2.535 | Market Cap: $553.9 MilSector: Industrials | Industry: Electrical Components & Equipment
Enovix (ENVX)
Market Price (10/23/2026): $2.535Market Cap: $553.9 MilSector: IndustrialsIndustry: Electrical Components & Equipment
Investment Highlights Why It Matters Detailed financial logic regarding cash flow yields vs trend-riding momentum.
Strong revenue growthRev Chg LTMRevenue Change % Last Twelve Months (LTM) is 35% Valuation becoming less expensiveP/S 6M Chg %Price/Sales change over 6 months. Declining P/S indicates valuation has become less expensive. is -60% Megatrend and thematic driversMegatrends include Battery Technology & Metals, and Advanced Materials. Themes include Advanced Battery Components, and Nanomaterials. | Weak multi-year price returns2Y Excs Rtn is -109%, 3Y Excs Rtn is -152% | Not profitable at operating income levelOp Inc LTMOperating Income, Last Twelve Months is -178 Mil, Op Mgn LTMOperating Margin = Operating Income / Revenue Reflects profitability before taxes and before impact of capital structure (interest payments). is -497% Expensive valuation multiplesP/SPrice/Sales ratio is 16x Significant share based compensationSBC/Rev LTMShare Based Compensation / Revenue (Sales), Last Twelve Months (LTM) is 134% Not cash flow generativeCFO/Rev LTMCash Flow from Operations / Revenue (Sales), Last Twelve Months (LTM) is -299%, FCF/Rev LTMFree Cash Flow / Revenue (Sales), Last Twelve Months (LTM) is -346% Yield minus risk free rate is negativeERPEquity Risk Premium (ERP) = Total Yield - Risk Free Rate, Reflects the premium above risk free assets offered by the investment. is -36% Significant short interestShort Interest % of Basic SharesShort Interest % of Basic Shares = (Short Interest Quantity) / (Basic Shares Outstanding). A high fraction of short interest can indicate potential risk of a short squeeze. is 24% Key risksENVX key risks include [1] successfully scaling mass manufacturing to achieve planned production rates and yields, Show more. |
| Strong revenue growthRev Chg LTMRevenue Change % Last Twelve Months (LTM) is 35% |
| Valuation becoming less expensiveP/S 6M Chg %Price/Sales change over 6 months. Declining P/S indicates valuation has become less expensive. is -60% |
| Megatrend and thematic driversMegatrends include Battery Technology & Metals, and Advanced Materials. Themes include Advanced Battery Components, and Nanomaterials. |
| Weak multi-year price returns2Y Excs Rtn is -109%, 3Y Excs Rtn is -152% |
| Not profitable at operating income levelOp Inc LTMOperating Income, Last Twelve Months is -178 Mil, Op Mgn LTMOperating Margin = Operating Income / Revenue Reflects profitability before taxes and before impact of capital structure (interest payments). is -497% |
| Expensive valuation multiplesP/SPrice/Sales ratio is 16x |
| Significant share based compensationSBC/Rev LTMShare Based Compensation / Revenue (Sales), Last Twelve Months (LTM) is 134% |
| Not cash flow generativeCFO/Rev LTMCash Flow from Operations / Revenue (Sales), Last Twelve Months (LTM) is -299%, FCF/Rev LTMFree Cash Flow / Revenue (Sales), Last Twelve Months (LTM) is -346% |
| Yield minus risk free rate is negativeERPEquity Risk Premium (ERP) = Total Yield - Risk Free Rate, Reflects the premium above risk free assets offered by the investment. is -36% |
| Significant short interestShort Interest % of Basic SharesShort Interest % of Basic Shares = (Short Interest Quantity) / (Basic Shares Outstanding). A high fraction of short interest can indicate potential risk of a short squeeze. is 24% |
| Key risksENVX key risks include [1] successfully scaling mass manufacturing to achieve planned production rates and yields, Show more. |
Qualitative Assessment
AI Analysis | Feedback
Enovix (ENVX) stock has lost about 60% since 6/30/2026 because of the following key factors:
1. CEO Transition and Leadership Uncertainty: Enovix experienced a significant leadership change with the unexpected resignation of President and CEO Dr. Raj Talluri effective August 13, 2026. While the company appointed CFO Ryan Benton as interim CEO and T.J. Rodgers as executive chairman, and reaffirmed its Q3 2026 guidance, the abrupt departure created uncertainty among investors and contributed to a negative market reaction.
2. Delayed Commercialization of Key Products and Manufacturing Challenges: The commercialization of Enovix's flagship AI-1 smartphone battery remains in the qualification phase, with the final accelerated cycle life test not expected until the end of fiscal year 2026. This means that a major anticipated revenue driver is still pre-revenue. Furthermore, the company continues to face production bottlenecks, specifically with Zone 1 dicing at its Fab2 facility, where yields are in the mid-80% range, indicating ongoing challenges in scaling its silicon-anode technology.
Show more
Enovix (ENVX) stock has lost about 60% since 6/30/2026 because of the following key factors:
1. CEO Transition and Leadership Uncertainty: Enovix experienced a significant leadership change with the unexpected resignation of President and CEO Dr. Raj Talluri effective August 13, 2026. While the company appointed CFO Ryan Benton as interim CEO and T.J. Rodgers as executive chairman, and reaffirmed its Q3 2026 guidance, the abrupt departure created uncertainty among investors and contributed to a negative market reaction.
2. Delayed Commercialization of Key Products and Manufacturing Challenges: The commercialization of Enovix's flagship AI-1 smartphone battery remains in the qualification phase, with the final accelerated cycle life test not expected until the end of fiscal year 2026. This means that a major anticipated revenue driver is still pre-revenue. Furthermore, the company continues to face production bottlenecks, specifically with Zone 1 dicing at its Fab2 facility, where yields are in the mid-80% range, indicating ongoing challenges in scaling its silicon-anode technology.
3. Persistent Losses and Concerns Over Capital Needs: Despite reporting better-than-expected revenue of $9.02 million for fiscal Q2 2026 (ended July 5, 2026), Enovix posted a substantial net loss of $43.1 million for the quarter, and a year-to-date net loss of $81.3 million. The company's guidance for fiscal Q3 2026 projects a non-GAAP operating loss between $29.0 million and $32.0 million. These significant and continuing losses highlight the capital-intensive nature of its development and manufacturing efforts, raising investor concerns about the path to profitability and potential future funding requirements.
4. Analyst Downgrades and Reduced Price Targets: Following the second-quarter earnings report and the CEO transition, several financial analysts lowered their price targets for Enovix stock. For example, StoneX reduced its price target to $10 from $15, citing a "more measured commercialization ramp," while BofA Securities lowered its target from $8.00 to $5.00, contributing to negative sentiment and downward pressure on the stock price.
5. Shortened Lease Renewal for Manufacturing Facility: Enovix renewed its lease for the Malaysia manufacturing facility for only one year, through July 31, 2027, instead of the previously assumed three-year renewal. This decision introduced questions about the company's long-term operational continuity at this key manufacturing site and could be interpreted by investors as a sign of uncertainty regarding its future large-scale production plans.
Show less
Stock Movement Drivers
Fundamental Drivers
The -58.0% change in ENVX stock from 6/30/2026 to 10/22/2026 was primarily driven by a -59.6% change in the company's P/S Multiple.| (LTM values as of) | 6302026 | 10222026 | Change |
|---|---|---|---|
| Stock Price ($) | 6.07 | 2.55 | -58.0% |
| Change Contribution By: | |||
| Total Revenues ($ Mil) | 34 | 36 | 4.5% |
| P/S Multiple | 38.4 | 15.5 | -59.6% |
| Shares Outstanding (Mil) | 217 | 219 | -0.5% |
| Cumulative Contribution | -58.0% |
Market Drivers
6/30/2026 to 10/22/2026| Return | Correlation | |
|---|---|---|
| ENVX | -58.0% | |
| Market (SPY) | 2.3% | 45.6% |
| Sector (XLI) | -10.0% | 33.3% |
Fundamental Drivers
The -50.8% change in ENVX stock from 3/31/2026 to 10/22/2026 was primarily driven by a -55.9% change in the company's P/S Multiple.| (LTM values as of) | 3312026 | 10222026 | Change |
|---|---|---|---|
| Stock Price ($) | 5.18 | 2.55 | -50.8% |
| Change Contribution By: | |||
| Total Revenues ($ Mil) | 32 | 36 | 12.8% |
| P/S Multiple | 35.2 | 15.5 | -55.9% |
| Shares Outstanding (Mil) | 216 | 219 | -1.0% |
| Cumulative Contribution | -50.8% |
Market Drivers
3/31/2026 to 10/22/2026| Return | Correlation | |
|---|---|---|
| ENVX | -50.8% | |
| Market (SPY) | 17.8% | 50.0% |
| Sector (XLI) | 3.3% | 32.6% |
Fundamental Drivers
The -74.4% change in ENVX stock from 9/30/2025 to 10/22/2026 was primarily driven by a -79.8% change in the company's P/S Multiple.| (LTM values as of) | 9302025 | 10222026 | Change |
|---|---|---|---|
| Stock Price ($) | 9.97 | 2.55 | -74.4% |
| Change Contribution By: | |||
| Total Revenues ($ Mil) | 27 | 36 | 34.9% |
| P/S Multiple | 76.8 | 15.5 | -79.8% |
| Shares Outstanding (Mil) | 205 | 219 | -6.3% |
| Cumulative Contribution | -74.4% |
Market Drivers
9/30/2025 to 10/22/2026| Return | Correlation | |
|---|---|---|
| ENVX | -74.4% | |
| Market (SPY) | 15.6% | 53.8% |
| Sector (XLI) | 9.0% | 42.0% |
Fundamental Drivers
The -79.7% change in ENVX stock from 9/30/2023 to 10/22/2026 was primarily driven by a -99.1% change in the company's P/S Multiple.| (LTM values as of) | 9302023 | 10222026 | Change |
|---|---|---|---|
| Stock Price ($) | 12.55 | 2.55 | -79.7% |
| Change Contribution By: | |||
| Total Revenues ($ Mil) | 1 | 36 | 2982.4% |
| P/S Multiple | 1,694.4 | 15.5 | -99.1% |
| Shares Outstanding (Mil) | 157 | 219 | -28.1% |
| Cumulative Contribution | -79.7% |
Market Drivers
9/30/2023 to 10/22/2026| Return | Correlation | |
|---|---|---|
| ENVX | -79.7% | |
| Market (SPY) | 84.8% | 46.2% |
| Sector (XLI) | 71.0% | 40.9% |
Price Returns Compared
| 2021 | 2022 | 2023 | 2024 | 2025 | 2026 | Total [1] | |
|---|---|---|---|---|---|---|---|
| Returns | |||||||
| ENVX Return | 117% | -54% | 1% | -13% | -33% | -65% | -80% |
| Peers Return | -44% | -50% | -17% | 11% | 147% | -3% | -39% |
| S&P 500 Return | 27% | -19% | 24% | 23% | 16% | 12% | 104% |
Monthly Win Rates [3] | |||||||
| ENVX Win Rate | 67% | 42% | 58% | 42% | 50% | 20% | |
| Peers Win Rate | 32% | 35% | 45% | 35% | 55% | 38% | |
| S&P 500 Win Rate | 75% | 42% | 67% | 75% | 67% | 50% | |
Max Drawdowns [4] | |||||||
| ENVX Max Drawdown | - | -72% | -61% | -58% | -62% | -74% | |
| Peers Max Drawdown | -72% | -74% | -66% | -65% | -52% | -68% | |
| S&P 500 Max Drawdown | -5% | -25% | -10% | -8% | -19% | -9% | |
[1] Cumulative total returns since the beginning of 2021
[2] Peers: AMPX, QS, SLDP, MVST, BE.
[3] Win Rate = % of calendar months in which monthly returns were positive
[4] Max drawdown represents maximum peak-to-trough decline within a year
[5] 2026 data is for the year up to 10/22/2026 (YTD)
How Low Can It Go
| Event | ENVX | S&P 500 |
|---|---|---|
| 2025 US Tariff Shock | ||
| % Loss | -51.2% | -18.8% |
| % Gain to Breakeven | 104.9% | 23.1% |
| Time to Breakeven | 90 days | 79 days |
In The Past
Enovix's stock fell -51.2% during the 2025 US Tariff Shock. Such a loss loss requires a 104.9% gain to breakeven.
Preserve Wealth
Limiting losses and compounding gains is essential to preserving wealth.
Asset Allocation
Actively managed asset allocation strategies protect wealth. Learn more.
| Event | ENVX | S&P 500 |
|---|---|---|
| 2025 US Tariff Shock | ||
| % Loss | -51.2% | -18.8% |
| % Gain to Breakeven | 104.9% | 23.1% |
| Time to Breakeven | 90 days | 79 days |
In The Past
Enovix's stock fell -51.2% during the 2025 US Tariff Shock. Such a loss loss requires a 104.9% gain to breakeven.
Preserve Wealth
Limiting losses and compounding gains is essential to preserving wealth.
Asset Allocation
Actively managed asset allocation strategies protect wealth. Learn more.
About Enovix (ENVX)
Enovix Corporation is an innovative company specializing in the design, development, and manufacture of advanced lithium-ion batteries. Headquartered in Fremont, California, the company is focused on revolutionizing battery technology to meet the increasing demands for higher performance and longer-lasting power solutions in various electronic devices.
The core of Enovix's offering is its unique 3D silicon-anode lithium-ion battery architecture. Unlike conventional batteries that use graphite, Enovix leverages silicon anodes to significantly increase energy density, allowing for smaller, lighter batteries that deliver substantially more power and faster charging capabilities. This proprietary technology aims to overcome the limitations of traditional battery designs, offering superior performance.
Enovix primarily targets high-growth markets that demand cutting-edge battery technology. Its main customers include manufacturers of premium consumer electronics such as smartphones, smartwatches, laptops, and augmented reality/virtual reality (AR/VR) devices, where space is at a premium and battery life is critical. The company's technology also holds potential for expansion into other high-performance applications, including electric vehicles and medical devices.
AI Analysis | Feedback
Here are 1-3 brief analogies for Enovix (ENVX):
- Enovix is like Intel for next-generation batteries.
- Enovix is like Qualcomm for advanced mobile device batteries.
- Enovix is like Corning for advanced battery technology.
AI Analysis | Feedback
- 3D Silicon-Anode Lithium-ion Batteries: These are high-energy-density batteries featuring a unique 3D cell architecture and a silicon anode, designed to deliver superior performance and safety for mobile devices and other demanding applications.
AI Analysis | Feedback
Enovix (ENVX) primarily sells its lithium-ion batteries to other companies (B2B), which integrate these batteries into their products.
Based on publicly available information and industry reports, its major identified customer and strategic partner is:
- Samsung Electronics Co., Ltd. (Symbol: 005930.KS)
Enovix has also publicly stated that it is engaged in development and qualification programs with multiple other "Tier 1" consumer electronics and automotive original equipment manufacturers (OEMs). However, the specific names of these additional customers are typically not disclosed due to confidentiality agreements.
AI Analysis | Feedback
AI Analysis | Feedback
Raj Talluri
President & Chief Executive Officer
Dr. Raj Talluri was appointed President and Chief Executive Officer in January 2023. He brings nearly 30 years of executive leadership and technical experience focused on the portable electronics market. Prior to Enovix, he served as Senior Vice President and General Manager of Micron Technology Inc.'s Mobile Business Unit, which had over $5 billion in worldwide revenue. Before Micron, he was Senior Vice President responsible for Qualcomm Inc.'s IoT business unit, growing it from an incubation stage to over $1 billion in product revenue. During his tenure at Qualcomm, he also led product management for the Snapdragon applications processor business, targeting smartphones, tablets, and automotive. He began his career at Texas Instruments, where he spent 16 years, ultimately becoming general manager of the OMAP wireless terminals business unit, an over $750 million revenue business. Dr. Talluri holds 13 patents.
Ryan Benton
Chief Financial Officer
Ryan Benton was appointed Chief Financial Officer on April 17, 2025. He has over three decades of financial leadership experience. Mr. Benton previously held key roles at ASM International and served as CFO for multiple public companies, including Silvaco and Exar Corporation.
Arthi Chakravarthy
Chief Legal Officer
Arthi Chakravarthy has served as Chief Legal Officer since April 2023. She has 20 years of experience as a business attorney for semiconductor and manufacturing companies. Prior to Enovix, Ms. Chakravarthy was the General Counsel of Lightning eMotors (NYSE: ZEV), a zero-emissions commercial vehicle manufacturing company. From March 2019 to July 2021, she served as Deputy General Counsel of Micron Technology, Inc. Before Micron, she was Vice President, Commercial Legal Affairs at TiVo, Inc. Ms. Chakravarthy began her career at law firms including Wilson Sonsini Goodrich & Rosati and Morrison & Foerster LLP. Since 2009, she has served as a Board Member and co-founder of Hospital for Hope India, a non-profit hospital in rural India.
Kristina Truong
Senior Vice President and Chief Accounting Officer
Kristina Truong was appointed Senior Vice President and Chief Accounting Officer on December 30, 2024, having joined Enovix in June 2022. She oversees accounting, controllership, financial reporting, and Sarbanes-Oxley controls. Ms. Truong brings over 25 years of experience guiding public and private technology, life science, and telecommunication companies worldwide. Before Enovix, she was a Senior Director, Corporate Controller at Spruce Biosciences. She is an active California Certified Public Accountant.
Dr. Hongwei Yan
Chief Technology Officer
Dr. Hongwei Yan joined Enovix in November 2024 as Chief Technology Officer. He possesses extensive experience in battery development, including material research, cell design, and manufacturing. Dr. Yan has a strong track record in new product design and development for Tier 1 customers in the consumer electronics market. From 2011 to 2015, he led the cell product design team at Amperex Technology Limited (ATL), where he delivered over 30 products with a 100% qualification pass rate. He later served as Vice President of the Technology Platform and Cell Product Design team at Samsung SDI. Dr. Yan holds 8 patents.
AI Analysis | Feedback
Key Risks to Enovix (ENVX)
- Manufacturing and Scale-Up Challenges: Enovix faces significant risks in scaling up its complex and innovative lithium-ion battery manufacturing processes to meet anticipated customer demand. The company's proprietary manufacturing process for its battery cells has not yet been proven at high volume, and recent reports highlight production delays and laser dicing issues affecting yields and battery qualification in its Malaysian facility. Achieving consistent quality and cost-effectiveness at scale is critical for the company's success but involves a high degree of risk and uncertainty.
- History of Financial Losses and Path to Profitability: Enovix has a history of significant financial losses and expects to continue incurring expenses and losses for the foreseeable future. The company's ability to achieve profitability is crucial for its long-term sustainability and investor confidence. This ongoing financial strain could impact its capacity to invest in research and development, further scale manufacturing lines, and effectively commercialize its products, leading to significant cash burn and a potential reliance on further capital raises.
- Intense Competition and Commercial Adoption: The battery market is highly competitive and rapidly evolving, requiring continuous innovation from Enovix to maintain its competitive advantage. The company faces challenges in securing widespread commercial adoption and major orders, particularly with leading smartphone and consumer electronics OEMs. Competition from deep-pocketed manufacturers, including Chinese silicon carbon battery makers who are closing the technology gap, puts pressure on Enovix to compete on price, which could impact its margins and market penetration.
AI Analysis | Feedback
The clear emerging threat for Enovix is the significant progress and impending commercialization of solid-state battery technology by numerous competitors and automotive OEMs. While Enovix specializes in advanced liquid-electrolyte lithium-ion batteries with silicon anodes, solid-state batteries promise superior energy density, faster charging, enhanced safety, and longer lifespan, potentially disrupting the market for high-performance applications that Enovix targets, such as premium consumer electronics and electric vehicles. Major players like Toyota, QuantumScape, and Solid Power are making rapid advancements and setting aggressive timelines for solid-state battery production, posing a direct threat to the long-term competitiveness of current lithium-ion battery architectures.
AI Analysis | Feedback
Enovix Corporation (ENVX) develops and manufactures advanced silicon-anode lithium-ion batteries, targeting various markets with its high-energy-density solutions. The addressable markets for Enovix's main products and services include:
- Silicon Anode Battery Market: The global silicon anode battery market was estimated at USD 357.3 million in 2024 and is projected to reach USD 3,618.5 million by 2030, with a compound annual growth rate (CAGR) of 50.1% from 2025 to 2030. Another projection estimates the global market at USD 536.53 million in 2025, growing to approximately USD 26,199.44 million by 2035 at a CAGR of 47.53% from 2026. The Asia-Pacific region dominated this market, holding over 54.34% of the revenue share in 2024 and 43.78% in 2025. The U.S. silicon anode battery market was valued at USD 63.90 million in 2024 and is projected to reach USD 1,732.36 million by 2032.
- Smartphone Battery Market: Six of the top eight smartphone original equipment manufacturers (OEMs) represent an approximate total addressable market of $7 billion for Enovix's offerings. The broader smartphone battery market is described as a multi-billion dollar market. One source estimates the smartphone battery market at $12 billion.
- IoT and Wearables Battery Market: The battery industry for Internet of Things (IoT) devices is estimated to be an $8 billion market. The <1,500 mAh segment of silicon anode batteries, which is primarily for wearables, medical devices, and other small consumer electronics, accounted for approximately 49% of the silicon anode battery market share in 2024.
- Computing Battery Market: The computing battery market is a $4 billion market.
- Electric Vehicle (EV) Battery Market: The electric vehicle battery market is estimated to be worth $101 billion globally in 2025.
- Defense Industry Battery Market: The battery category for the defense industry is a $3 billion market.
AI Analysis | Feedback
Enovix (NASDAQ: ENVX) anticipates several key drivers for its future revenue growth over the next two to three years:
- Mass Production and Commercialization of Silicon-Anode Batteries: A primary driver is the scaling of its Fab2 facility in Malaysia for high-volume manufacturing of advanced silicon-anode batteries, including the EX-1M and EX-2M cells. This expansion is crucial for transitioning from qualification to full commercialization and meeting anticipated customer demand.
- Penetration into the Smartphone Market: Enovix is actively pursuing design wins and aiming for mass production of its AI-1 platform batteries with leading smartphone original equipment manufacturers (OEMs) by late 2025 or 2026. The smartphone market represents a significant opportunity for the company.
- Expansion into Smart Eyewear (AR/VR) and IoT Markets: The company is targeting the rapidly growing smart eyewear (augmented reality/virtual reality) market, where its high energy density batteries offer a substantial competitive advantage. Enovix has already received initial production demand in this category, and the Internet of Things (IoT) sector has also shown strong performance.
- Growth in Defense and Industrial Applications: Enovix has demonstrated sustained revenue growth from its defense and industrial segments, particularly from its South Korean operations. Batteries for applications such as naval munitions and aerial drones have been significant contributors, and recent acquisitions aim to further bolster capacity for this increasing demand.
- Technological Advancement and New Product Introductions: Enovix maintains a robust technology roadmap with continuous improvements in energy density through its EX-1M, EX-2M, and upcoming EX-3M and EX-4M battery cells. These advancements are expected to lead to higher average selling prices (ASPs) and enable the company to access a broader market.
AI Analysis | Feedback
Share Repurchases
- Enovix authorized a share repurchase program of up to $60 million on July 2, 2025, which was effective from June 30, 2025, until December 31, 2026. Approximately $1.6 million remained under this plan as of December 28, 2025.
- On February 25, 2026, an additional share repurchase program of up to $75 million was authorized by the company's board of directors.
- The company executed share repurchases of $64.9 million in 2025, $7.1 million in 2024, and $4.0 million in 2023.
Share Issuance
- Enovix received approximately $107 million in net proceeds from an equity offering in the fourth quarter of 2024.
- In the second quarter of 2024, the company received cash proceeds of $34.2 million from an At-The-Market (ATM) offering.
Outbound Investments
- On October 31, 2023, Enovix acquired Routejade, a lithium-ion battery company, for approximately $10 million, net of cash acquired.
Capital Expenditures
- Capital expenditures for 2025 were $18.2 million, focused on disciplined and staged manufacturing expansion plans.
- In 2024, capital expenditures totaled $76.2 million, primarily allocated to the build-out of Fab2 in Malaysia and facilities in South Korea, including the Gen2 Agility Line and Autoline.
- In 2023, capital expenditures were $61.8 million, supporting manufacturing advancements.
Peer Outperformance in Electrical Components & Equipment
| Industry | Names | 1Y med | 3Y med | 5Y med | Top 3 by 5Y |
|---|---|---|---|---|---|
| Construction & Engineering | 30 | -2.5% | 102.3% | 139.8% | STRL 1538% · FIX 1451% · AGX 712% |
| Marine Transportation | 5 | 53.7% | 50.1% | 131.4% | MATX 188% · KEX 131% |
| Construction Machinery & Heavy Transportation Equipment | 13 | 2.1% | 58.8% | 94.9% | CAT 280% · ALSN 241% · WAB 208% |
| Aerospace & Defense | 52 | -12.6% | 59.4% | 57.0% | ATI 913% · FTAI 721% · HWM 544% |
| Trading Companies & Distributors | 19 | 12.5% | 32.3% | 51.1% | DXPE 382% · AIT 233% · URI 213% |
| Industrial Machinery & Supplies & Components | 72 | 5.8% | 55.2% | 38.4% | CRS 867% · MLI 375% · SYM 308% |
| Diversified Support Services | 34 | 11.3% | 38.9% | 36.6% | CXW 226% · OPLN 155% · CTAS 120% |
| Rail Transportation | 7 | 32.2% | 62.3% | 31.1% | CSX 56% · UNP 40% · NSC 31% |
| Building Products | 33 | -7.3% | 12.9% | 24.5% | GFF 344% · TT 164% · JCI 114% |
| Cargo Ground Transportation | 16 | 33.6% | 6.9% | 19.4% | XPO 262% · R 237% · ARCB 51% |
| Electrical Components & Equipment ← | 37 | -11.3% | 70.5% | 3.7% | POWL 1786% · BE 979% · VRT 717% |
| Industrial Conglomerates | 17 | 7.7% | 8.7% | -5.9% | CSW 121% · DD 72% · CSL 64% |
| Agricultural & Farm Machinery | 16 | 1.5% | -1.6% | -10.6% | DE 102% · TTC 15% · AGCO -6% |
| Data Processing & Outsourced Services | 6 | -21.6% | 0.4% | -15.0% | EXLS 73% · BR 11% · G -12% |
| Research & Consulting Services | 13 | 4.1% | -12.2% | -15.9% | HURN 290% · FCN 11% · BAH 5% |
| Security & Alarm Services | 9 | -52.1% | 12.7% | -21.3% | BCO 99% |
| Office Services & Supplies | 9 | 19.4% | 18.4% | -24.4% | PBI 201% · TILE 148% · HNI 43% |
| Environmental & Facilities Services | 29 | -26.4% | 32.4% | -32.4% | GEO 231% · CLH 180% · RSG 93% |
| Passenger Airlines | 11 | 5.1% | 20.4% | -34.2% | LTM 3130% · UAL 118% · DAL 107% |
| Passenger Ground Transportation | 3 | -25.1% | 60.5% | -36.4% | UBER 52% · CAR -36% · LYFT -64% |
| Air Freight & Logistics | 12 | -25.4% | -18.7% | -39.6% | FDX 80% · EXPD 69% · CHRW 61% |
| Human Resource & Employment Services | 22 | 17.2% | -9.0% | -42.0% | ADP 58% · PAYX 12% · FA 10% |
| Airport Services | 4 | -69.6% | -68.3% | -83.5% | JOBY -48% |
Latest Trefis Analyses
| Title | Date | |
|---|---|---|
| DASHBOARDS | ||
| Enovix Stock Up 14% in One Day, Now Is Not The Time To Buy The Stock | 04/07/2026 | |
| Is Enovix Stock Built to Withstand More Downside? | 01/21/2026 | |
| Enovix Earnings Notes | 12/16/2025 | |
| Does Enovix Stock Lead the Pack? | 08/13/2025 | |
| Enovix (ENVX) Debt Comparison | 08/08/2025 | |
| Enovix (ENVX) Net Income Comparison | 08/08/2025 | |
| Enovix (ENVX) Tax Expense Comparison | 08/08/2025 | |
| Enovix (ENVX) Operating Cash Flow Comparison | 08/08/2025 | |
| Enovix (ENVX) EBITDA Comparison | 08/08/2025 | |
| Enovix (ENVX) Operating Income Comparison | 08/08/2025 | |
| ARTICLES | ||
| Market Movers | Winners: NUAI, ENVX, ABTC | Losers: AVEX, TKNO, RCUS | 10/22/2026 | |
| 90 Stocks Hit 52-Week Lows On Monday | 10/20/2026 | |
| The 52-Week-Low List: 134 Names On Wednesday | 10/15/2026 | |
| Where The Selling Ran Deepest: 43 Stocks At 52-Week Lows | 07/24/2026 | |
| Stocks Trading At 52-Week Low | 03/09/2026 |
Research & Analysis
Invest in Strategies
Wealth Management
Peer Comparisons
| Peers to compare with: |
Financials
| Median | |
|---|---|
| Name | |
| Mkt Price | 3.37 |
| Mkt Cap | 0.8 |
| Rev LTM | 72 |
| Op Inc LTM | -71 |
| FCF LTM | -66 |
| FCF 3Y Avg | -64 |
| CFO LTM | -56 |
| CFO 3Y Avg | -51 |
Growth & Margins
| Median | |
|---|---|
| Name | |
| Rev Chg LTM | 34.9% |
| Rev Chg 3Y Avg | 37.8% |
| Rev Chg Q | 20.8% |
| QoQ Delta Rev Chg LTM | 4.5% |
| Op Inc Chg LTM | 4.0% |
| Op Inc Chg 3Y Avg | -0.0% |
| Op Mgn LTM | -16.2% |
| Op Mgn 3Y Avg | -148.8% |
| QoQ Delta Op Mgn LTM | 4.5% |
| CFO/Rev LTM | -48.9% |
| CFO/Rev 3Y Avg | -127.5% |
| FCF/Rev LTM | -54.0% |
| FCF/Rev 3Y Avg | -186.8% |
Valuation
| Median | |
|---|---|
| Name | |
| Mkt Cap | 0.8 |
| P/S | 15.7 |
| P/Op Inc | -4.6 |
| P/EBIT | -4.6 |
| P/E | -4.2 |
| P/CFO | -9.3 |
| Total Yield | -9.5% |
| Dividend Yield | 0.0% |
| FCF Yield 3Y Avg | -15.5% |
| D/E | 0.0 |
| Net D/E | -0.0 |
Price Behavior
| Market Price | $2.55 | |
| Market Cap ($ Bil) | 0.6 | |
| First Trading Date | 01/05/2021 | |
| Distance from 52W High | -79.3% | |
| 50 Days | 200 Days | |
| DMA Price | $3.02 | $5.30 |
| DMA Trend | down | down |
| Distance from DMA | -15.5% | -51.8% |
| 3M | 1YR | |
| Volatility | 91.3% | 86.2% |
| Downside Capture | 579.27 | 553.44 |
| Upside Capture | 218.27 | 288.24 |
| Correlation (S&P 500) | 43.3% | 54.1% |
| 1M | 2M | 3M | 6M | 1Y | 3Y | |
|---|---|---|---|---|---|---|
| Beta | 1.26 | 3.21 | 4.15 | 3.79 | 3.73 | 2.82 |
| Up Beta | 1.96 | -0.12 | 3.23 | 1.87 | 1.95 | 1.96 |
| Down Beta | 12.45 | 11.03 | 5.61 | 4.77 | 3.30 | 2.41 |
| Up Capture | -59% | 233% | 261% | 470% | 1289% | 17678% |
| Bmk +ve Days | 6 | 16 | 27 | 66 | 132 | 424 |
| Stock +ve Days | 9 | 18 | 27 | 59 | 118 | 359 |
| Down Capture | 172% | 483% | 457% | 324% | 193% | 113% |
| Bmk -ve Days | 16 | 26 | 37 | 60 | 120 | 328 |
| Stock -ve Days | 13 | 24 | 37 | 67 | 132 | 386 |
[1] Upside and downside betas calculated using positive and negative benchmark daily returns respectively
Based On 1-Year Data
| Annualized Return | Annualized Volatility | Sharpe Ratio | Correlation with ENVX | |
|---|---|---|---|---|
| ENVX | -78.6% | 86.2% | -1.39 | - |
| Sector ETF (XLI) | 8.6% | 17.2% | 0.31 | 42.4% |
| Equity (SPY) | 14.8% | 12.7% | 0.80 | 53.7% |
| Gold (GLD) | -2.2% | 28.4% | -0.09 | 28.8% |
| Commodities (DBC) | 52.1% | 20.7% | 1.91 | -4.0% |
| Real Estate (VNQ) | 4.7% | 13.9% | 0.08 | 6.3% |
| Bitcoin (BTCUSD) | -22.4% | 43.4% | -0.47 | 37.8% |
Smart multi-asset allocation framework can stack odds in your favor. Learn How
Based On 5-Year Data
| Annualized Return | Annualized Volatility | Sharpe Ratio | Correlation with ENVX | |
|---|---|---|---|---|
| ENVX | -35.9% | 94.1% | -0.04 | - |
| Sector ETF (XLI) | 12.0% | 17.6% | 0.51 | 40.5% |
| Equity (SPY) | 13.0% | 17.1% | 0.57 | 44.8% |
| Gold (GLD) | 17.1% | 18.9% | 0.72 | 13.2% |
| Commodities (DBC) | 9.3% | 19.5% | 0.36 | 8.5% |
| Real Estate (VNQ) | 1.1% | 18.9% | -0.05 | 29.2% |
| Bitcoin (BTCUSD) | 8.0% | 51.7% | 0.33 | 27.1% |
Smart multi-asset allocation framework can stack odds in your favor. Learn How
Based On 10-Year Data
| Annualized Return | Annualized Volatility | Sharpe Ratio | Correlation with ENVX | |
|---|---|---|---|---|
| ENVX | -14.6% | 93.1% | 0.13 | - |
| Sector ETF (XLI) | 13.2% | 20.0% | 0.57 | 38.5% |
| Equity (SPY) | 15.4% | 17.9% | 0.73 | 43.0% |
| Gold (GLD) | 11.9% | 16.4% | 0.59 | 13.8% |
| Commodities (DBC) | 8.3% | 18.1% | 0.37 | 9.8% |
| Real Estate (VNQ) | 5.2% | 20.7% | 0.21 | 28.3% |
| Bitcoin (BTCUSD) | 63.0% | 66.2% | 1.03 | 23.8% |
Smart multi-asset allocation framework can stack odds in your favor. Learn How
Returns Analyses
Earnings Returns History
Updated 10/22/2026| Forward Returns | |||
|---|---|---|---|
| Earnings Date | 1D Returns | 5D Returns | 21D Returns |
| 10/13/2026 | -3.1% | -9.3% | |
| 8/12/2026 | -6.3% | -28.1% | -34.5% |
| 5/13/2026 | -13.6% | -12.8% | -8.6% |
| 1/20/2026 | 1.9% | -2.2% | -18.3% |
| 11/5/2025 | 1.9% | -20.4% | -19.4% |
| 7/31/2025 | -20.1% | -17.9% | -28.2% |
| 4/30/2025 | -8.4% | -7.8% | 13.7% |
| 2/19/2025 | 0.3% | -15.4% | -27.2% |
| ... | |||
| SUMMARY STATS | |||
| # Positive | 9 | 6 | 8 |
| # Negative | 13 | 16 | 13 |
| Median Positive | 3.9% | 19.0% | 22.1% |
| Median Negative | -6.3% | -13.4% | -27.2% |
| Max Positive | 45.5% | 39.5% | 63.1% |
| Max Negative | -41.5% | -31.6% | -36.2% |
| Forward Returns | |||
|---|---|---|---|
| Earnings Date | 1D Returns | 5D Returns | 21D Returns |
| 10/13/2026 | -3.1% | -9.3% | |
| 8/12/2026 | -6.3% | -28.1% | -34.5% |
| 5/13/2026 | -13.6% | -12.8% | -8.6% |
| 1/20/2026 | 1.9% | -2.2% | -18.3% |
| 11/5/2025 | 1.9% | -20.4% | -19.4% |
| 7/31/2025 | -20.1% | -17.9% | -28.2% |
| 4/30/2025 | -8.4% | -7.8% | 13.7% |
| 2/19/2025 | 0.3% | -15.4% | -27.2% |
| 10/29/2024 | -1.4% | -14.0% | -13.2% |
| 7/31/2024 | -19.2% | -24.6% | -32.9% |
| 5/1/2024 | 45.5% | 39.5% | 63.1% |
| 2/20/2024 | -3.8% | -20.7% | -36.2% |
| 11/7/2023 | 0.5% | 2.1% | 12.5% |
| 7/26/2023 | -4.9% | -2.4% | -33.0% |
| 4/26/2023 | -15.7% | -7.8% | -1.6% |
| 2/22/2023 | 3.9% | 15.7% | 38.1% |
| 11/1/2022 | -41.5% | -31.6% | -31.7% |
| 8/10/2022 | 30.8% | 32.6% | 30.4% |
| 5/11/2022 | 9.6% | 22.2% | 55.1% |
| 3/3/2022 | -2.6% | -10.3% | -13.2% |
| 11/8/2021 | 4.8% | 14.3% | 12.2% |
| 8/10/2021 | -2.4% | -7.0% | 10.7% |
| SUMMARY STATS | |||
| # Positive | 9 | 6 | 8 |
| # Negative | 13 | 16 | 13 |
| Median Positive | 3.9% | 19.0% | 22.1% |
| Median Negative | -6.3% | -13.4% | -27.2% |
| Max Positive | 45.5% | 39.5% | 63.1% |
| Max Negative | -41.5% | -31.6% | -36.2% |
SEC Filings
Expand for More| Report Date | Filing Date | Filing |
|---|---|---|
| 06/30/2026 | 08/12/2026 | 10-Q |
| 03/31/2026 | 05/14/2026 | 10-Q |
| 12/31/2025 | 02/25/2026 | 10-K |
| 09/30/2025 | 11/05/2025 | 10-Q |
| 06/30/2025 | 07/31/2025 | 10-Q |
| 03/31/2025 | 05/02/2025 | 10-Q |
| 12/31/2024 | 02/25/2025 | 10-K |
| 09/30/2024 | 10/30/2024 | 10-Q |
| 06/30/2024 | 08/05/2024 | 10-Q |
| 03/31/2024 | 05/07/2024 | 10-Q |
| 12/31/2023 | 02/29/2024 | 10-K |
| 09/30/2023 | 11/09/2023 | 10-Q |
| 06/30/2023 | 08/09/2023 | 10-Q |
| 03/31/2023 | 05/05/2023 | 10-Q |
| 12/31/2022 | 03/01/2023 | 10-K |
| 09/30/2022 | 11/04/2022 | 10-Q |
| Report Date | Filing Date | Filing |
|---|---|---|
| 06/30/2026 | 08/12/2026 | 10-Q |
| 03/31/2026 | 05/14/2026 | 10-Q |
| 12/31/2025 | 02/25/2026 | 10-K |
| 09/30/2025 | 11/05/2025 | 10-Q |
| 06/30/2025 | 07/31/2025 | 10-Q |
| 03/31/2025 | 05/02/2025 | 10-Q |
| 12/31/2024 | 02/25/2025 | 10-K |
| 09/30/2024 | 10/30/2024 | 10-Q |
| 06/30/2024 | 08/05/2024 | 10-Q |
| 03/31/2024 | 05/07/2024 | 10-Q |
| 12/31/2023 | 02/29/2024 | 10-K |
| 09/30/2023 | 11/09/2023 | 10-Q |
| 06/30/2023 | 08/09/2023 | 10-Q |
| 03/31/2023 | 05/05/2023 | 10-Q |
| 12/31/2022 | 03/01/2023 | 10-K |
| 09/30/2022 | 11/04/2022 | 10-Q |
| 06/30/2022 | 08/16/2022 | 10-Q |
| 03/31/2022 | 05/18/2022 | 10-Q |
| 12/31/2021 | 03/25/2022 | 10-K |
| 09/30/2021 | 11/15/2021 | 10-Q |
| 06/30/2021 | 08/16/2021 | 10-Q |
Insider Activity
Updated 10/7/2026| # | Owner | Title | Holding | Action | Filing Date | Price | Shares | Transacted Value | Value of Held Shares | Form |
|---|---|---|---|---|---|---|---|---|---|---|
| 1 | Truong, Kristina | Chief Accounting Officer | Direct | Sell | 1052026 | 7.31 | 2,296 | 16,784 | 1,438,228 | Form |
| 2 | Marathe, Ajay | Chief Operating Officer | Direct | Sell | 10092025 | 13.00 | 18,614 | 241,982 | 13,034,892 | Form |
| 3 | Marathe, Ajay | Chief Operating Officer | Direct | Sell | 10062025 | 12.01 | 120,000 | 1,441,200 | 12,337,381 | Form |
| # | Owner | Title | Holding | Action | Filing Date | Price | Shares | Transacted Value | Value of Held Shares | Form |
|---|---|---|---|---|---|---|---|---|---|---|
| 1 | Truong, Kristina | Chief Accounting Officer | Direct | Sell | 1052026 | 7.31 | 2,296 | 16,784 | 1,438,228 | Form |
| 2 | Marathe, Ajay | Chief Operating Officer | Direct | Sell | 10092025 | 13.00 | 18,614 | 241,982 | 13,034,892 | Form |
| 3 | Marathe, Ajay | Chief Operating Officer | Direct | Sell | 10062025 | 12.01 | 120,000 | 1,441,200 | 12,337,381 | Form |
Investor Activity (13F)
Updated Oct 23, 2026Active managers (13F portfolio over $250M, at least 3 holdings) with a position over $5M that is either over 10% of their portfolio or held in a concentrated book of 50 or fewer total positions. Index/ETF, sovereign, bank, community-bank and charitable/donor-advised filers are excluded.
| Active Manager |
|---|
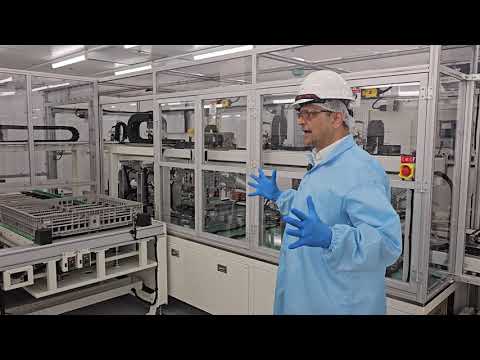
Enovix — Investor Video Playlist


Industry Resources
| Industrials Resources |
| IndustryWeek |
| Manufacturing.net |
| Aviation Week |
| Electrical Components & Equipment Resources |
| EC&M (Electrical Construction & Maintenance) |
| Electrical Contracting News (ECN) |
| EE Times |
External Quote Links
| Y Finance | Barrons |
| TradingView | Morningstar |
| SeekingAlpha | ValueLine |
| Motley Fool | Robinhood |
| CNBC | Etrade |
| MarketWatch | Unusual Whales |
| YCharts | Perplexity Finance |
| FinViz |
Prefer one of these to Trefis? Tell us why.