
Blue Bird (BLBD)
Market Price (11/10/2026): $60.3 | Market Cap: $2.1 BilSector: Industrials | Industry: Agricultural & Farm Machinery
Blue Bird (BLBD)
Market Price (11/10/2026): $60.3Market Cap: $2.1 BilSector: IndustrialsIndustry: Agricultural & Farm Machinery
Investment Highlights Why It Matters Detailed financial logic regarding cash flow yields vs trend-riding momentum.
Attractive yieldTotal YieldTotal Yield = Earnings Yield + Dividend Yield, Earnings Yield = Net Income / Market Cap Dividend Yield = Total Dividends / Market Cap is 14%, ERPEquity Risk Premium (ERP) = Total Yield - Risk Free Rate, Reflects the premium above risk free assets offered by the investment. is 8.0%, FCF Yield is 7.4% Attractive cash flow generationCFO/Rev LTMCash Flow from Operations / Revenue (Sales), Last Twelve Months (LTM) is 11% Low stock price volatilityVol 12M is 42% Megatrend and thematic driversMegatrends include Electric Vehicles & Autonomous Driving, Electrification of Everything, and Sustainable Infrastructure. Themes include Electric School Bus Manufacturing, Show more. | Meaningful short interestShort Interest Days-to-CoverDTC = (Short Interest Share Quantity) / (Average Daily Trading Volume). Reflects how many days it would take to cover (close out) the short interest based on average volumes. High DTC can signify an increased risk of a short squeeze. is 10.79, Short Interest % of Basic SharesShort Interest % of Basic Shares = (Short Interest Quantity) / (Basic Shares Outstanding). A high fraction of short interest can indicate potential risk of a short squeeze. is 12% | Key risksBLBD key risks include [1] its strategic dependency on government incentives for its electric and alternative-powered bus sales and [2] supply chain vulnerabilities from its reliance on single-source suppliers. |
| Attractive yieldTotal YieldTotal Yield = Earnings Yield + Dividend Yield, Earnings Yield = Net Income / Market Cap Dividend Yield = Total Dividends / Market Cap is 14%, ERPEquity Risk Premium (ERP) = Total Yield - Risk Free Rate, Reflects the premium above risk free assets offered by the investment. is 8.0%, FCF Yield is 7.4% |
| Attractive cash flow generationCFO/Rev LTMCash Flow from Operations / Revenue (Sales), Last Twelve Months (LTM) is 11% |
| Low stock price volatilityVol 12M is 42% |
| Megatrend and thematic driversMegatrends include Electric Vehicles & Autonomous Driving, Electrification of Everything, and Sustainable Infrastructure. Themes include Electric School Bus Manufacturing, Show more. |
| Meaningful short interestShort Interest Days-to-CoverDTC = (Short Interest Share Quantity) / (Average Daily Trading Volume). Reflects how many days it would take to cover (close out) the short interest based on average volumes. High DTC can signify an increased risk of a short squeeze. is 10.79, Short Interest % of Basic SharesShort Interest % of Basic Shares = (Short Interest Quantity) / (Basic Shares Outstanding). A high fraction of short interest can indicate potential risk of a short squeeze. is 12% |
| Key risksBLBD key risks include [1] its strategic dependency on government incentives for its electric and alternative-powered bus sales and [2] supply chain vulnerabilities from its reliance on single-source suppliers. |
Qualitative Assessment
AI Analysis | Feedback
Blue Bird (BLBD) stock has lost about 20% since 7/31/2026 because of the following key factors:
1. Negative Fiscal Year 2027 Earnings Per Share (EPS) Outlook.
Despite Blue Bird reporting better-than-expected fiscal Q3 2026 results on August 5, 2026, with an EPS of $1.28 that beat analysts' consensus estimates of $1.25, investor sentiment was likely impacted by a projected decline in future earnings. Analyst expectations for Blue Bird's normalized EPS anticipate a decrease from an estimated $4.80 in fiscal year 2026 to $4.46 in fiscal year 2027. This forecasted year-over-year earnings contraction, despite revenue growth, contributed to a cautious outlook for the stock.
2. Concerns over Quality of Revenue Growth in Fiscal Q3 2026.
While Blue Bird announced a nearly 30% increase in revenue for fiscal Q3 2026, reaching $517.2 million, the underlying composition of this growth raised concerns. A significant portion of the reported revenue increase, specifically $122.9 million, was attributed to the full consolidation of the Micro Bird acquisition. Conversely, revenue generated from Blue Bird's existing, legacy operations actually experienced a slight decline of approximately 1%, indicating a weaker organic performance from the core business.
Show more
Blue Bird (BLBD) stock has lost about 20% since 7/31/2026 because of the following key factors:
1. Negative Fiscal Year 2027 Earnings Per Share (EPS) Outlook.
Despite Blue Bird reporting better-than-expected fiscal Q3 2026 results on August 5, 2026, with an EPS of $1.28 that beat analysts' consensus estimates of $1.25, investor sentiment was likely impacted by a projected decline in future earnings. Analyst expectations for Blue Bird's normalized EPS anticipate a decrease from an estimated $4.80 in fiscal year 2026 to $4.46 in fiscal year 2027. This forecasted year-over-year earnings contraction, despite revenue growth, contributed to a cautious outlook for the stock.
2. Concerns over Quality of Revenue Growth in Fiscal Q3 2026.
While Blue Bird announced a nearly 30% increase in revenue for fiscal Q3 2026, reaching $517.2 million, the underlying composition of this growth raised concerns. A significant portion of the reported revenue increase, specifically $122.9 million, was attributed to the full consolidation of the Micro Bird acquisition. Conversely, revenue generated from Blue Bird's existing, legacy operations actually experienced a slight decline of approximately 1%, indicating a weaker organic performance from the core business.
3. Broad Macroeconomic Headwinds Impacting the Automotive Sector.
The automotive industry as a whole has faced substantial macroeconomic challenges since July 2026, creating a difficult operating environment for companies like Blue Bird. Global production of motor vehicles and parts is expected to decrease by 0.2% in 2026, with U.S. automotive output forecast to decline by 2.8%. These declines are driven by factors such as ongoing trade uncertainty and tariffs (25% on imported autos and parts, up to 50% on steel and aluminum), which have led to elevated input costs and compressed OEM margins. Additionally, new vehicle prices have sharply increased, rising by an average of 15-25% since 2020, and average monthly finance payments reached a record high of $808 in July 2026, dampening consumer demand and affordability.
4. Intensifying Competition and Execution Risks.
Blue Bird faces increasing competitive pressures, particularly within the expanding electric school bus market, where both larger established rivals and emerging EV startups could erode pricing power and market share. Furthermore, the company contends with execution risks associated with the successful launch of new products, the scaling up of alternative-powered bus production, potential warranty costs, and broader supply chain or labor challenges. These factors introduce a degree of uncertainty regarding the durability of future earnings.
Show less
Stock Movement Drivers
Fundamental Drivers
The -18.9% change in BLBD stock from 7/31/2026 to 11/9/2026 was primarily driven by a -58.6% change in the company's P/E Multiple.| (LTM values as of) | 7312026 | 11092026 | Change |
|---|---|---|---|
| Stock Price ($) | 74.39 | 60.32 | -18.9% |
| Change Contribution By: | |||
| Total Revenues ($ Mil) | 1,493 | 1,612 | 8.0% |
| Net Income Margin (%) | 8.9% | 17.5% | 96.2% |
| P/E Multiple | 17.7 | 7.3 | -58.6% |
| Shares Outstanding (Mil) | 32 | 34 | -7.6% |
| Cumulative Contribution | -18.9% |
Market Drivers
7/31/2026 to 11/9/2026| Return | Correlation | |
|---|---|---|
| BLBD | -18.9% | |
| Market (SPY) | 0.8% | 31.0% |
| Sector (XLI) | -6.1% | 38.7% |
Fundamental Drivers
The -5.9% change in BLBD stock from 4/30/2026 to 11/9/2026 was primarily driven by a -53.3% change in the company's P/E Multiple.| (LTM values as of) | 4302026 | 11092026 | Change |
|---|---|---|---|
| Stock Price ($) | 64.11 | 60.32 | -5.9% |
| Change Contribution By: | |||
| Total Revenues ($ Mil) | 1,499 | 1,612 | 7.5% |
| Net Income Margin (%) | 8.7% | 17.5% | 102.0% |
| P/E Multiple | 15.7 | 7.3 | -53.3% |
| Shares Outstanding (Mil) | 32 | 34 | -7.2% |
| Cumulative Contribution | -5.9% |
Market Drivers
4/30/2026 to 11/9/2026| Return | Correlation | |
|---|---|---|
| BLBD | -5.9% | |
| Market (SPY) | 5.0% | 34.2% |
| Sector (XLI) | -3.0% | 38.6% |
Fundamental Drivers
The 20.7% change in BLBD stock from 10/31/2025 to 11/9/2026 was primarily driven by a 114.3% change in the company's Net Income Margin (%).| (LTM values as of) | 10312025 | 11092026 | Change |
|---|---|---|---|
| Stock Price ($) | 49.96 | 60.32 | 20.7% |
| Change Contribution By: | |||
| Total Revenues ($ Mil) | 1,421 | 1,612 | 13.5% |
| Net Income Margin (%) | 8.2% | 17.5% | 114.3% |
| P/E Multiple | 13.6 | 7.3 | -46.1% |
| Shares Outstanding (Mil) | 32 | 34 | -7.8% |
| Cumulative Contribution | 20.7% |
Market Drivers
10/31/2025 to 11/9/2026| Return | Correlation | |
|---|---|---|
| BLBD | 20.7% | |
| Market (SPY) | 11.3% | 34.7% |
| Sector (XLI) | 9.9% | 40.1% |
Fundamental Drivers
The 231.2% change in BLBD stock from 10/31/2023 to 11/9/2026 was primarily driven by a 138.5% change in the company's P/S Multiple.| (LTM values as of) | 10312023 | 11092026 | Change |
|---|---|---|---|
| Stock Price ($) | 18.21 | 60.32 | 231.2% |
| Change Contribution By: | |||
| Total Revenues ($ Mil) | 1,088 | 1,612 | 48.3% |
| P/S Multiple | 0.5 | 1.3 | 138.5% |
| Shares Outstanding (Mil) | 32 | 34 | -6.3% |
| Cumulative Contribution | 231.2% |
Market Drivers
10/31/2023 to 11/9/2026| Return | Correlation | |
|---|---|---|
| BLBD | 231.2% | |
| Market (SPY) | 86.2% | 37.1% |
| Sector (XLI) | 78.6% | 40.1% |
Price Returns Compared
| 2021 | 2022 | 2023 | 2024 | 2025 | 2026 | Total [1] | |
|---|---|---|---|---|---|---|---|
| Returns | |||||||
| BLBD Return | -14% | -32% | 152% | 43% | 22% | 28% | 230% |
| Peers Return | -14% | -10% | 27% | -32% | -1% | 25% | -18% |
| S&P 500 Return | 27% | -19% | 24% | 23% | 16% | 8% | 96% |
Monthly Win Rates [3] | |||||||
| BLBD Win Rate | 50% | 42% | 58% | 33% | 50% | 64% | |
| Peers Win Rate | 38% | 44% | 54% | 38% | 54% | 42% | |
| S&P 500 Win Rate | 75% | 42% | 67% | 75% | 67% | 36% | |
Max Drawdowns [4] | |||||||
| BLBD Max Drawdown | -48% | -66% | -37% | -37% | -26% | -32% | |
| Peers Max Drawdown | -40% | -41% | -38% | -53% | -41% | -39% | |
| S&P 500 Max Drawdown | -5% | -25% | -10% | -8% | -19% | -9% | |
[1] Cumulative total returns since the beginning of 2021
[2] Peers: PLOW, FSTR, SRI, CVGI, GP. See BLBD Returns vs. Peers.
[3] Win Rate = % of calendar months in which monthly returns were positive
[4] Max drawdown represents maximum peak-to-trough decline within a year
[5] 2026 data is for the year up to 11/9/2026 (YTD)
How Low Can It Go
| Event | BLBD | S&P 500 |
|---|---|---|
| 2025 US Tariff Shock | ||
| % Loss | -11.1% | -18.8% |
| % Gain to Breakeven | 12.5% | 23.1% |
| Time to Breakeven | 6 days | 79 days |
| Summer-Fall 2023 Five Percent Yield Shock | ||
| % Loss | -15.9% | -9.5% |
| % Gain to Breakeven | 18.9% | 10.5% |
| Time to Breakeven | 28 days | 24 days |
| 2023 SVB Regional Banking Crisis | ||
| % Loss | -13.7% | -6.7% |
| % Gain to Breakeven | 15.9% | 7.1% |
| Time to Breakeven | 16 days | 31 days |
| 2022 Inflation Shock & Fed Tightening | ||
| % Loss | -53.4% | -24.5% |
| % Gain to Breakeven | 114.4% | 32.4% |
| Time to Breakeven | 90 days | 427 days |
| 2020 COVID-19 Crash | ||
| % Loss | -53.2% | -33.7% |
| % Gain to Breakeven | 113.6% | 50.9% |
| Time to Breakeven | 265 days | 140 days |
| Q4 2018 Fed Policy Error / Growth Scare | ||
| % Loss | -36.6% | -19.2% |
| % Gain to Breakeven | 57.8% | 23.8% |
| Time to Breakeven | 793 days | 105 days |
In The Past
Blue Bird's stock fell -11.1% during the 2025 US Tariff Shock. Such a loss loss requires a 12.5% gain to breakeven.
Preserve Wealth
Limiting losses and compounding gains is essential to preserving wealth.
Asset Allocation
Actively managed asset allocation strategies protect wealth. Learn more.
| Event | BLBD | S&P 500 |
|---|---|---|
| 2022 Inflation Shock & Fed Tightening | ||
| % Loss | -53.4% | -24.5% |
| % Gain to Breakeven | 114.4% | 32.4% |
| Time to Breakeven | 90 days | 427 days |
| 2020 COVID-19 Crash | ||
| % Loss | -53.2% | -33.7% |
| % Gain to Breakeven | 113.6% | 50.9% |
| Time to Breakeven | 265 days | 140 days |
| Q4 2018 Fed Policy Error / Growth Scare | ||
| % Loss | -36.6% | -19.2% |
| % Gain to Breakeven | 57.8% | 23.8% |
| Time to Breakeven | 793 days | 105 days |
| 2015-2016 China Devaluation / Global Growth Scare | ||
| % Loss | -34.7% | -12.2% |
| % Gain to Breakeven | 53.1% | 13.9% |
| Time to Breakeven | 149 days | 62 days |
In The Past
Blue Bird's stock fell -11.1% during the 2025 US Tariff Shock. Such a loss loss requires a 12.5% gain to breakeven.
Preserve Wealth
Limiting losses and compounding gains is essential to preserving wealth.
Asset Allocation
Actively managed asset allocation strategies protect wealth. Learn more.
About Blue Bird (BLBD)
Blue Bird Corporation (BLBD) is a long-established manufacturer specializing in the design, engineering, manufacturing, and sale of school buses and their related parts. Headquartered in Macon, Georgia, and founded in 1927, the company operates across the United States, Canada, and other international markets through its Bus and Parts segments.
The company's core product line includes various types of school buses, such as Type C, Type D, and specialty buses. A key differentiator for Blue Bird is its strong emphasis on alternative fuel applications, offering models powered by propane, gasoline, compressed natural gas (CNG), and electricity, catering to growing demands for more sustainable transportation solutions. Additionally, Blue Bird maintains a parts distribution center to support its vehicle fleet.
Blue Bird serves a diverse customer base, distributing its products through an established network of dealers, as well as engaging in direct sales to large fleet operators, the United States government, and various state governments.
AI Analysis | Feedback
- The John Deere of school buses.
- A focused Ford or General Motors, but exclusively for school buses.
AI Analysis | Feedback
- School Buses: Blue Bird designs, engineers, manufactures, and sells various types of school buses, including Type C, Type D, and specialty models, available with alternative fuel options such as propane, gasoline, compressed natural gas, and electric power.
- Related Parts: The company provides a range of parts for its school buses, which are distributed through its dedicated parts distribution center.
AI Analysis | Feedback
Blue Bird Corporation (BLBD) sells its products primarily to other companies, organizations, and governmental entities, rather than to individuals. The provided background information does not list specific customer companies by name or symbol. Instead, it describes the channels and types of entities through which Blue Bird sells its school buses and related parts:
- Network of Dealers: Blue Bird sells its products to a network of independent dealerships. These dealers then resell the buses to end-users such as school districts, private schools, and other organizations requiring fleet transportation.
- Fleet Operators: This category includes organizations that operate their own fleets of vehicles. This can encompass private companies providing student transportation services, charter bus companies, and public entities like school districts directly managing their bus fleets.
- The United States Government: Blue Bird sells its buses directly to various agencies or departments within the federal government.
- State Governments: The company also sells directly to state-level governmental bodies, which may procure buses for state-operated services or for distribution to local entities.
AI Analysis | Feedback
- Cummins Inc. (CMI)
- Ford Motor Company (F)
AI Analysis | Feedback
John Wyskiel, President & Chief Executive Officer
John Wyskiel was appointed President & Chief Executive Officer of Blue Bird Corporation effective February 17, 2025. He brings over 35 years of experience in manufacturing leadership, operational excellence, and global sales and supply chain management within the automotive and manufacturing industries. Prior to his current role, Mr. Wyskiel had a 20-year career at Magna International, where he most recently served as President of Magna Seating, overseeing a $6 billion business with 33,000 employees across more than 60 manufacturing facilities in 15 countries. He also held various senior roles at Magna, Dana Corporation, and Borg Warner and previously served as general manager of Blue Bird Coach in Canada from 2002 to 2004.
Razvan Radulescu, Chief Financial Officer
Razvan Radulescu was appointed Chief Financial Officer of Blue Bird Corporation effective October 1, 2021. He possesses over 20 years of financial and operating experience, primarily gained at Daimler Trucks, where he held various roles of increasing responsibility in Finance, Controlling, and Procurement, including IT, compliance, and investor relations. Most recently at Daimler Trucks, Mr. Radulescu served as General Manager of Procurement for Daimler Trucks North America. His previous roles also include CFO of the Global Powertrain Daimler Truck Business Unit in Stuttgart, Germany (2017-2020), and Controller for Freightliner Trucks within Daimler Trucks North America (2013-2017).
Jeff Sanfrey, Chief Operating Officer
Jeff Sanfrey serves as the Chief Operating Officer of Blue Bird Corporation. He has over 20 years of experience in manufacturing and operations leadership, with a background in lean manufacturing and strategic deployment. Before joining Blue Bird, Mr. Sanfrey held senior leadership roles including Senior Vice President of Manufacturing at GE Hitachi Nuclear Energy and Vice President of Operations at ECI. His experience spans multiple manufacturing environments, encompassing responsibility for safety, quality, cost, and operational performance.
Ted M. Scartz, Senior Vice President, General Counsel and Corporate Secretary
Ted M. Scartz serves as Senior Vice President, General Counsel, and Corporate Secretary for Blue Bird Corporation. No specific background details meeting the requested criteria were found in the provided search results.
David M. Pasternak, Senior Vice President and Chief Human Resources Officer
David M. Pasternak holds the position of Senior Vice President and Chief Human Resources Officer at Blue Bird Corporation. No specific background details meeting the requested criteria were found in the provided search results.
AI Analysis | Feedback
-
Reliance on Government Subsidies and Funding for Electric Vehicles: Blue Bird's growth strategy is heavily dependent on government incentives and funding programs, such as the U.S. Environmental Protection Agency's Clean School Bus Program, which support the adoption of electric school buses (ESBs). There is a significant risk that these subsidies could be reduced or eliminated due to shifting political priorities or tightening state and federal budgets. Such a reduction could lead to a substantial decrease in demand for ESBs, impact the company's revenue, and negatively affect its profitability and long-term growth narrative, as school districts might revert to purchasing cheaper traditional diesel buses.
-
Intense Competition in the Electric Vehicle Market: Although Blue Bird has established itself as an early leader in the electric school bus market, it faces increasing competition from larger, better-funded rivals who are also significantly investing in electric vehicle technology. If competitors develop and bring to market more advanced or cost-effective electric school bus models, Blue Bird's market share and pricing power could be eroded.
-
Supply Chain Disruptions and Input Cost Volatility: The company is vulnerable to disruptions in its supply chain, which have historically led to production delays and impacted revenue. Additionally, Blue Bird's profitability is sensitive to fluctuations in input costs, such as raw materials like steel and labor, as well as the unpredictable nature of tariffs and supplier inflation. These factors can lead to higher manufacturing costs and pressure on profit margins, even with pricing adjustments.
AI Analysis | Feedback
AI Analysis | Feedback
Addressable Markets for Blue Bird (BLBD)

The addressable market for Blue Bird Corporation's main products, school buses and related services, is substantial, particularly within North America, where the company holds a significant position.

North American School Bus Market
The North American school bus market was valued at approximately USD 6.98 billion in 2025 and is projected to reach USD 10.19 billion by 2030, growing at a Compound Annual Growth Rate (CAGR) of 7.87% from 2025 to 2030. Within this region, the United States accounted for 86.36% of the North American school bus market share in 2024. Other estimates place the U.S. school bus market size at USD 5.6 billion in 2024, expected to reach USD 8.3 billion by 2030, with a CAGR of 6.50%.

Blue Bird manufactures Type C and Type D school buses, among others. In North America, Type C buses captured 43.24% of the market share in 2024, while Type D buses are expected to expand at an 8.02% CAGR through 2030. Globally, Type C buses held a dominant share of the market revenue in 2024.

Alternative Fuel and Electric School Bus Markets
Blue Bird is a key player in the alternative fuel segment, offering propane, gasoline, compressed natural gas, and electric-powered school buses. The shift towards electric school buses is a significant driver in the market. The global electric school bus market was valued at approximately USD 45.6 billion in 2025 and is projected to reach USD 389.3 billion by 2034, exhibiting a robust CAGR of 26.91% during 2026-2034. Another report estimates the global electric school bus market at USD 22.92 billion in 2025, forecasted to grow to USD 73.88 billion by 2034 at a CAGR of 13.83%. In the USA, the electric school bus market is projected to reach USD 4.77 billion in 2025.
While internal combustion engines (primarily diesel) controlled the majority (92.82% in North America in 2024) of the school bus market share, battery-electric buses are forecast to post the fastest growth with a 7.92% CAGR between 2025 and 2030 in North America.
AI Analysis | Feedback
Expected Revenue Growth Drivers for Blue Bird (BLBD)
- Accelerating Electric School Bus (ESB) Sales: Blue Bird is strategically positioned to capitalize on the increasing demand for electric school buses, significantly driven by federal and state funding initiatives, such as the Environmental Protection Agency's (EPA) Clean School Bus Program. The company aims to substantially increase its electric school bus sales, targeting approximately 1,150 units by fiscal year 2025 and 5,000 units annually post-2027. This growth in ESB sales, which are priced significantly higher than traditional diesel buses, is expected to be a primary revenue driver.
- Continued Leadership in Alternative Fuel Buses: Blue Bird maintains a leading market position in alternative power school buses, including propane, compressed natural gas (CNG), and gasoline-powered vehicles. Over 60% of Blue Bird's unit sales are non-diesel. The company recently extended its exclusive collaboration with Ford Component Sales and ROUSH CleanTech to 2030, ensuring its unique offering of propane- and gasoline-powered buses that meet stringent emission standards taking effect in 2027. This sustained leadership and product differentiation in the alternative fuel segment will continue to drive revenue.
- Favorable Pricing Actions and Product Mix: Blue Bird has successfully implemented pricing strategies and benefited from a product mix shift towards higher-value alternative fuel and electric buses. This has led to an increase in average revenue per bus and improved gross margins. The company's ability to align pricing with market economics and effectively pass through cost increases, including tariffs, is expected to continue supporting revenue growth.
- Replacement Demand from an Aging School Bus Fleet: A significant portion of the U.S. school bus fleet, approximately 45%, is 11 years or older. This aging fleet creates a consistent and healthy underlying replacement demand cycle, providing a steady volume driver for Blue Bird's bus sales over the next several years.
- Expansion into the EV Commercial Chassis Market: Blue Bird is diversifying its product portfolio by introducing an Electric Vehicle (EV) commercial chassis offering. Production for this new platform is anticipated to commence in late 2026 and is expected to contribute incremental revenue through fiscal year 2027 and beyond, helping to broaden the company's revenue base.
AI Analysis | Feedback
Share Repurchases
- Blue Bird Corporation's Board of Directors authorized a share repurchase program of up to $60 million in aggregate of its outstanding common stock for 24 months, announced on February 1, 2024.
- On August 5, 2025, Blue Bird's Board approved a new share repurchase program for up to $100 million of common stock, effective until January 1, 2028. The company has repurchased $15 million in shares during the first quarter of fiscal year 2026.
- As of September 29, 2025, Blue Bird had repurchased $49.9 million in shares from a previous $60 million program, including $9.9 million in late fiscal year 2024 and $39 million year-to-date in fiscal year 2025.
Share Issuance
- In February 2024, an affiliate of American Securities LLC, a selling stockholder, intended to offer 4,042,650 shares of Blue Bird common stock in a secondary public offering.
- In June 2023, affiliates of Coliseum Capital Management LLC and American Securities LLC, as selling stockholders, launched an underwritten secondary public offering of Blue Bird common stock.
- As of March 11, 2026, shareholders approved amendments to the 2015 Omnibus Equity Incentive Plan, increasing the common shares reserved for awards from 5,200,000 to 6,100,000, and raising the number of shares for Full Value Awards from 2,500,000 to 3,400,000.
Outbound Investments
- Blue Bird announced an agreement to acquire Girardin Group's 50% stake in the Micro Bird joint venture for approximately $200 million, with 30% paid in cash and 70% in Blue Bird common stock. This transaction is expected to close in the first half of 2026.
- The Micro Bird acquisition aims to consolidate Blue Bird's North American operations, unify its brands, and expand its presence in the Buy America Act-compliant shuttle bus market.
Capital Expenditures
- Blue Bird's capital expenditures averaged 1.2% of revenue for fiscal years ending October 2021 to 2025.
- The company plans significant strategic investments in growth starting in fiscal year 2024, including approximately $25 million for R&D/Engineering expenses and $25 million for CAPEX/Tooling.
- Blue Bird is undertaking a significant capital investment for a new plant, with its portion being around $200 million over two years, and is also increasing regular capital expenditure spending and investing in engineering projects related to emissions regulations. Additionally, Blue Bird plans to invest $50 million in capital expenditures for growth and maintenance through fiscal year 2027.
Peer Outperformance in Agricultural & Farm Machinery
| Industry | Names | 1Y med | 3Y med | 5Y med | Top 3 by 5Y |
|---|---|---|---|---|---|
| Construction & Engineering | 28 | -13.7% | 106.4% | 114.2% | FIX 1047% · STRL 907% · AGX 633% |
| Marine Transportation | 5 | 34.7% | 32.6% | 113.6% | MATX 140% · KEX 117% |
| Construction Machinery & Heavy Transportation Equipment | 14 | 13.2% | 69.5% | 98.2% | ALSN 278% · WAB 218% · CAT 210% |
| Aerospace & Defense | 54 | 3.9% | 57.7% | 65.2% | FTAI 963% · ATI 954% · HWM 563% |
| Industrial Machinery & Supplies & Components | 71 | 4.3% | 53.9% | 33.5% | CRS 853% · MLI 306% · SYM 276% |
| Trading Companies & Distributors | 19 | 15.2% | 35.5% | 28.4% | DXPE 338% · AIT 199% · URI 199% |
| Rail Transportation | 7 | 36.9% | 71.5% | 27.2% | CSX 52% · UNP 38% · NSC 27% |
| Diversified Support Services | 34 | 19.2% | 46.7% | 18.5% | CXW 205% · OPLN 140% · CACI 124% |
| Building Products | 34 | -3.3% | 8.5% | 16.5% | MOD 813% · GFF 365% · TT 136% |
| Cargo Ground Transportation | 16 | 33.6% | 16.2% | 5.2% | XPO 299% · R 262% · ARCB 22% |
| Electrical Components & Equipment | 39 | 0.2% | 61.0% | 0.6% | POWL 1531% · VRT 647% · BE 465% |
| Office Services & Supplies | 10 | 22.4% | 27.1% | -1.2% | PBI 146% · HNI 45% · MSA 19% |
| Industrial Conglomerates | 17 | 19.2% | 12.4% | -3.3% | CSW 109% · CSL 78% · DD 76% |
| Data Processing & Outsourced Services | 6 | -8.1% | 2.7% | -13.8% | EXLS 60% · BR 18% · G -10% |
| Agricultural & Farm Machinery ← | 16 | 23.0% | -0.4% | -22.9% | BLBD 147% · DE 107% · TTC 16% |
| Research & Consulting Services | 13 | 1.9% | -15.6% | -23.5% | HURN 209% · FCN 36% · BAH 9% |
| Security & Alarm Services | 9 | -39.6% | 45.7% | -24.9% | BCO 83% |
| Environmental & Facilities Services | 29 | -20.7% | 33.3% | -26.4% | GEO 222% · CLH 168% · RSG 97% |
| Passenger Airlines | 11 | 11.0% | 85.0% | -29.1% | LTM 3253% · UAL 128% · DAL 114% |
| Human Resource & Employment Services | 22 | 23.8% | -5.4% | -36.3% | ADP 47% · FA 20% · PAYX 10% |
| Air Freight & Logistics | 12 | -29.9% | -5.7% | -39.9% | FDX 76% · EXPD 60% · CHRW 54% |
| Passenger Ground Transportation | 3 | -22.6% | 38.0% | -46.2% | UBER 56% · CAR -46% · LYFT -70% |
| Airport Services | 4 | -38.1% | -57.1% | -85.7% | JOBY -35% |
Latest Trefis Analyses
| Title | Date | |
|---|---|---|
| DASHBOARDS | ||
| How Low Can BLBD Really Go In A Market Crash? | 05/20/2026 | |
| Blue Bird Stock (-7%): Ex-CEO Departure Triggers Profit-Taking | 12/31/2026 | |
| Blue Bird Earnings Notes | 12/16/2025 | |
| How Low Can Blue Bird Stock Really Go? | 10/17/2025 | |
| BLBD Dip Buy Analysis | 07/10/2025 | |
| Blue Bird Total Shareholder Return (TSR): 20.8% in 2025 and ...% 3-yr compounded annual returns (below peer average) | 03/07/2025 | |
| Blue Bird (BLBD) Operating Cash Flow Comparison | 02/17/2025 | |
| Blue Bird (BLBD) Net Income Comparison | 02/15/2025 | |
| Blue Bird (BLBD) Operating Income Comparison | 02/14/2025 | |
| Blue Bird (BLBD) Revenue Comparison | 02/13/2025 | |
| ARTICLES | ||
| Blue Bird Stock To $84? | 05/20/2026 | |
| Stress Testing BLBD: Historical Drawdowns and Macro Risks | 05/20/2026 |
Research & Analysis
Invest in Strategies
Wealth Management
Peer Comparisons
| Peers to compare with: |
Financials
| Median | |
|---|---|
| Name | |
| Mkt Price | 21.40 |
| Mkt Cap | 0.4 |
| Rev LTM | 742 |
| Op Inc LTM | 16 |
| FCF LTM | 17 |
| FCF 3Y Avg | 19 |
| CFO LTM | 32 |
| CFO 3Y Avg | 35 |
Growth & Margins
| Median | |
|---|---|
| Name | |
| Rev Chg LTM | 14.6% |
| Rev Chg 3Y Avg | 2.1% |
| Rev Chg Q | 25.7% |
| QoQ Delta Rev Chg LTM | 6.7% |
| Op Inc Chg LTM | 47.7% |
| Op Inc Chg 3Y Avg | 22.4% |
| Op Mgn LTM | 3.7% |
| Op Mgn 3Y Avg | 1.9% |
| QoQ Delta Op Mgn LTM | 0.4% |
| CFO/Rev LTM | 4.2% |
| CFO/Rev 3Y Avg | 5.4% |
| FCF/Rev LTM | 2.3% |
| FCF/Rev 3Y Avg | 3.1% |
Valuation
| Median | |
|---|---|
| Name | |
| Mkt Cap | 0.4 |
| P/S | 0.7 |
| P/Op Inc | 10.9 |
| P/EBIT | 8.9 |
| P/E | 7.3 |
| P/CFO | 9.6 |
| Total Yield | 3.2% |
| Dividend Yield | 0.0% |
| FCF Yield 3Y Avg | 5.1% |
| D/E | 0.4 |
| Net D/E | 0.4 |
Returns
| Median | |
|---|---|
| Name | |
| 1M Rtn | 1.2% |
| 3M Rtn | -9.7% |
| 6M Rtn | -21.4% |
| 12M Rtn | 22.4% |
| 3Y Rtn | 7.4% |
| 1M Excs Rtn | 6.8% |
| 3M Excs Rtn | -5.5% |
| 6M Excs Rtn | -20.9% |
| 12M Excs Rtn | 11.7% |
| 3Y Excs Rtn | -65.0% |
Comparison Analyses
Price Behavior
| Market Price | $60.32 | |
| Market Cap ($ Bil) | 2.1 | |
| First Trading Date | 03/20/2014 | |
| Distance from 52W High | -26.0% | |
| 50 Days | 200 Days | |
| DMA Price | $58.52 | $63.47 |
| DMA Trend | down | up |
| Distance from DMA | 3.1% | -5.0% |
| 3M | 1YR | |
| Volatility | 33.6% | 42.4% |
| Downside Capture | 107.07 | 110.74 |
| Upside Capture | 57.94 | 115.08 |
| Correlation (S&P 500) | 26.9% | 33.2% |
| 1M | 2M | 3M | 6M | 1Y | 3Y | |
|---|---|---|---|---|---|---|
| Beta | 0.29 | 0.27 | 0.89 | 1.11 | 1.08 | 1.10 |
| Up Beta | -0.34 | -1.84 | -0.01 | 0.78 | 1.32 | 1.12 |
| Down Beta | 0.06 | -0.45 | -1.51 | 0.72 | 0.32 | 0.70 |
| Up Capture | 51% | 66% | 103% | 116% | 142% | 296% |
| Bmk +ve Days | 12 | 18 | 28 | 62 | 130 | 427 |
| Stock +ve Days | 13 | 20 | 29 | 64 | 129 | 395 |
| Down Capture | 35% | 91% | 244% | 146% | 118% | 106% |
| Bmk -ve Days | 10 | 25 | 36 | 64 | 121 | 325 |
| Stock -ve Days | 8 | 22 | 34 | 61 | 121 | 353 |
[1] Upside and downside betas calculated using positive and negative benchmark daily returns respectively
Based On 1-Year Data
| Annualized Return | Annualized Volatility | Sharpe Ratio | Correlation with BLBD | |
|---|---|---|---|---|
| BLBD | 19.4% | 42.4% | 0.53 | - |
| Sector ETF (XLI) | 11.7% | 18.2% | 0.45 | 40.2% |
| Equity (SPY) | 13.3% | 13.7% | 0.65 | 34.3% |
| Gold (GLD) | 3.7% | 28.8% | 0.12 | 15.5% |
| Commodities (DBC) | 38.2% | 21.3% | 1.42 | -22.8% |
| Real Estate (VNQ) | 13.7% | 14.3% | 0.65 | 19.3% |
| Bitcoin (BTCUSD) | -25.3% | 43.6% | -0.55 | 5.4% |
Smart multi-asset allocation framework can stack odds in your favor. Learn How
Based On 5-Year Data
| Annualized Return | Annualized Volatility | Sharpe Ratio | Correlation with BLBD | |
|---|---|---|---|---|
| BLBD | 23.5% | 56.4% | 0.58 | - |
| Sector ETF (XLI) | 11.6% | 17.8% | 0.49 | 35.7% |
| Equity (SPY) | 11.8% | 17.3% | 0.51 | 34.1% |
| Gold (GLD) | 17.8% | 19.1% | 0.75 | 7.4% |
| Commodities (DBC) | 8.0% | 19.6% | 0.29 | 0.4% |
| Real Estate (VNQ) | 1.5% | 18.9% | -0.03 | 26.8% |
| Bitcoin (BTCUSD) | 4.4% | 51.6% | 0.27 | 14.0% |
Smart multi-asset allocation framework can stack odds in your favor. Learn How
Based On 10-Year Data
| Annualized Return | Annualized Volatility | Sharpe Ratio | Correlation with BLBD | |
|---|---|---|---|---|
| BLBD | 15.2% | 51.7% | 0.47 | - |
| Sector ETF (XLI) | 13.3% | 20.1% | 0.58 | 40.2% |
| Equity (SPY) | 15.3% | 18.0% | 0.72 | 35.5% |
| Gold (GLD) | 12.1% | 16.5% | 0.60 | 2.8% |
| Commodities (DBC) | 7.6% | 18.1% | 0.33 | 10.3% |
| Real Estate (VNQ) | 6.1% | 20.7% | 0.25 | 30.9% |
| Bitcoin (BTCUSD) | 60.0% | 66.3% | 1.00 | 10.7% |
Smart multi-asset allocation framework can stack odds in your favor. Learn How
Returns Analyses
Earnings Returns History
Updated 9/8/2026| Forward Returns | |||
|---|---|---|---|
| Earnings Date | 1D Returns | 5D Returns | 21D Returns |
| 8/5/2026 | -14.2% | -16.4% | -17.2% |
| 5/6/2026 | 8.9% | 9.2% | 7.1% |
| 2/4/2026 | 11.8% | 16.3% | 10.2% |
| 11/24/2025 | -5.5% | -7.0% | -8.7% |
| 8/6/2025 | 18.5% | 28.0% | 33.3% |
| 5/7/2025 | -1.4% | 5.6% | 7.5% |
| 2/5/2025 | 4.2% | -0.1% | -5.1% |
| 11/25/2024 | -5.0% | -2.6% | -6.6% |
| ... | |||
| SUMMARY STATS | |||
| # Positive | 12 | 13 | 15 |
| # Negative | 12 | 11 | 9 |
| Median Positive | 10.8% | 16.3% | 13.7% |
| Median Negative | -5.3% | -7.0% | -7.5% |
| Max Positive | 36.3% | 48.4% | 50.1% |
| Max Negative | -16.7% | -18.3% | -25.1% |
| Forward Returns | |||
|---|---|---|---|
| Earnings Date | 1D Returns | 5D Returns | 21D Returns |
| 8/5/2026 | -14.2% | -16.4% | -17.2% |
| 5/6/2026 | 8.9% | 9.2% | 7.1% |
| 2/4/2026 | 11.8% | 16.3% | 10.2% |
| 11/24/2025 | -5.5% | -7.0% | -8.7% |
| 8/6/2025 | 18.5% | 28.0% | 33.3% |
| 5/7/2025 | -1.4% | 5.6% | 7.5% |
| 2/5/2025 | 4.2% | -0.1% | -5.1% |
| 11/25/2024 | -5.0% | -2.6% | -6.6% |
| 8/7/2024 | 0.3% | -2.9% | -4.4% |
| 5/8/2024 | 24.5% | 41.1% | 50.1% |
| 2/7/2024 | -2.9% | 1.9% | 3.7% |
| 12/11/2023 | 10.5% | 17.9% | 13.7% |
| 8/9/2023 | -3.9% | -1.9% | 3.5% |
| 5/11/2023 | 36.3% | 28.8% | 12.1% |
| 2/8/2023 | 29.9% | 48.4% | 49.3% |
| 12/12/2022 | -16.7% | -13.4% | 21.0% |
| 8/10/2022 | -2.7% | 4.2% | -7.5% |
| 5/12/2022 | -7.6% | -14.4% | -25.1% |
| 2/9/2022 | 11.1% | 30.4% | 29.1% |
| 12/15/2021 | -3.6% | -7.8% | -1.4% |
| 8/12/2021 | -8.8% | -18.3% | -22.1% |
| 5/12/2021 | 8.2% | 4.0% | 3.5% |
| 2/10/2021 | -10.1% | -6.8% | 20.4% |
| 12/16/2020 | 0.4% | 13.1% | 48.8% |
| SUMMARY STATS | |||
| # Positive | 12 | 13 | 15 |
| # Negative | 12 | 11 | 9 |
| Median Positive | 10.8% | 16.3% | 13.7% |
| Median Negative | -5.3% | -7.0% | -7.5% |
| Max Positive | 36.3% | 48.4% | 50.1% |
| Max Negative | -16.7% | -18.3% | -25.1% |
SEC Filings
Expand for More| Report Date | Filing Date | Filing |
|---|---|---|
| 06/30/2026 | 08/05/2026 | 10-Q |
| 03/31/2026 | 05/06/2026 | 10-Q |
| 12/31/2025 | 02/04/2026 | 10-Q |
| 09/30/2025 | 11/24/2025 | 10-K |
| 06/30/2025 | 08/06/2025 | 10-Q |
| 03/31/2025 | 05/07/2025 | 10-Q |
| 12/31/2024 | 02/05/2025 | 10-Q |
| 09/30/2024 | 11/25/2024 | 10-K |
| 06/30/2024 | 08/07/2024 | 10-Q |
| 03/31/2024 | 05/08/2024 | 10-Q |
| 12/31/2023 | 02/07/2024 | 10-Q |
| 09/30/2023 | 12/11/2023 | 10-K |
| 06/30/2023 | 08/09/2023 | 10-Q |
| 03/31/2023 | 05/11/2023 | 10-Q |
| 12/31/2022 | 02/08/2023 | 10-Q |
| 09/30/2022 | 12/12/2022 | 10-K |
| Report Date | Filing Date | Filing |
|---|---|---|
| 06/30/2026 | 08/05/2026 | 10-Q |
| 03/31/2026 | 05/06/2026 | 10-Q |
| 12/31/2025 | 02/04/2026 | 10-Q |
| 09/30/2025 | 11/24/2025 | 10-K |
| 06/30/2025 | 08/06/2025 | 10-Q |
| 03/31/2025 | 05/07/2025 | 10-Q |
| 12/31/2024 | 02/05/2025 | 10-Q |
| 09/30/2024 | 11/25/2024 | 10-K |
| 06/30/2024 | 08/07/2024 | 10-Q |
| 03/31/2024 | 05/08/2024 | 10-Q |
| 12/31/2023 | 02/07/2024 | 10-Q |
| 09/30/2023 | 12/11/2023 | 10-K |
| 06/30/2023 | 08/09/2023 | 10-Q |
| 03/31/2023 | 05/11/2023 | 10-Q |
| 12/31/2022 | 02/08/2023 | 10-Q |
| 09/30/2022 | 12/12/2022 | 10-K |
| 06/30/2022 | 08/10/2022 | 10-Q |
| 03/31/2022 | 05/12/2022 | 10-Q |
| 12/31/2021 | 02/09/2022 | 10-Q |
| 09/30/2021 | 12/15/2021 | 10-K |
| 06/30/2021 | 08/12/2021 | 10-Q |
| 03/31/2021 | 05/12/2021 | 10-Q |
| 12/31/2020 | 02/11/2021 | 10-Q |
| 09/30/2020 | 12/17/2020 | 10-K |
| 06/30/2020 | 08/13/2020 | 10-Q |
| 03/31/2020 | 05/14/2020 | 10-Q |
| 12/31/2019 | 02/13/2020 | 10-Q |
| 09/30/2019 | 12/12/2019 | 10-K |
Recent Forward Guidance
Updated 11/2/2026Latest: Q3 2026 Earnings Reported 8/5/2026
| Forward Guidance | Guidance Change | |||||||
|---|---|---|---|---|---|---|---|---|
| Metric | Source | Low | Mid | High | % Chg | % Delta | Change | Prior |
| 2026 Revenue | Reported | 1.75 Bil | 0 | Affirmed | Guidance: 1.75 Bil for 2026 | |||
| 2026 Adjusted EBITDA | Reported | 247.00 Mil | 0.8% | Raised | Guidance: 245.00 Mil for 2026 | |||
| 2030 Revenue | Reported | 3.30 Bil | ||||||
| 2030 Adjusted EBITDA | Reported | 500.00 Mil | ||||||
| 2030 Adjusted EBITDA Margin | Reported | 15.0% | ||||||
Prior: Q2 2026 Earnings Reported 5/6/2026
| Forward Guidance | Guidance Change | |||||||
|---|---|---|---|---|---|---|---|---|
| Metric | Source | Low | Mid | High | % Chg | % Delta | Change | Prior |
| 2026 Revenue | Reported | 2.50 Bil | 66.7% | Raised | Guidance: 1.50 Bil for 2026 | |||
| 2026 Adjusted EBITDA | Reported | 375.00 Mil | 66.7% | Raised | Guidance: 225.00 Mil for 2026 | |||
| 2026 Adjusted EBITDA Margin | Reported | 15.0% | ||||||
Q1 2026 Earnings Reported 2/4/2026
| Forward Guidance | Guidance Change | |||||||
|---|---|---|---|---|---|---|---|---|
| Metric | Source | Low | Mid | High | % Chg | % Delta | Change | Prior |
| 2026 Revenue | Reported | 1.50 Bil | 0 | Affirmed | Guidance: 1.50 Bil for 2026 | |||
| 2026 Adjusted EBITDA | Reported | 225.00 Mil | 2.3% | Raised | Guidance: 220.00 Mil for 2026 | |||
| 2027 Revenue | Reported | 2.00 Bil | ||||||
| 2027 Adjusted EBITDA Margin | Reported | 16.0% | ||||||
Q4 2025 Earnings Reported 11/24/2025
| Forward Guidance | Guidance Change | |||||||
|---|---|---|---|---|---|---|---|---|
| Metric | Source | Low | Mid | High | % Chg | % Delta | Change | Prior |
| 2026 Revenue | Reported | 2.00 Bil | 37.9% | Higher New | Guidance: 1.45 Bil for 2025 | |||
| 2026 Adjusted EBITDA | Reported | 220.00 Mil | 4.8% | Affirmed | Guidance: 210.00 Mil for 2025 | |||
| 2026 Adjusted EBITDA Margin | Reported | 16.0% | 1.5% | Higher New | Guidance: 14.5% for 2025 | |||
Insider Activity
Updated 9/18/2026| # | Owner | Title | Holding | Action | Filing Date | Price | Shares | Transacted Value | Value of Held Shares | Form |
|---|---|---|---|---|---|---|---|---|---|---|
| 1 | Sanfrey, Jeffrey Scott | Chief Operating Officer | Direct | Sell | 9182026 | 62.40 | 4,000 | 249,600 | 2,184,686 | Form |
| 2 | Thau, Daniel Mark | Direct | Buy | 8132026 | 64.37 | 350 | 22,530 | 582,291 | Form | |
| 3 | Thau, Daniel Mark | Direct | Buy | 5202026 | 65.09 | 300 | 19,527 | 566,023 | Form | |
| 4 | Sanfrey, Jeffrey Scott | Chief Operating Officer | Direct | Sell | 3052026 | 58.54 | 5,192 | 303,940 | 2,283,704 | Form |
| 5 | Radulescu, Razvan | Chief Financial Officer | Direct | Sell | 2202026 | 60.98 | 3,925 | 239,346 | 2,576,710 | Form |
| # | Owner | Title | Holding | Action | Filing Date | Price | Shares | Transacted Value | Value of Held Shares | Form |
|---|---|---|---|---|---|---|---|---|---|---|
| 1 | Sanfrey, Jeffrey Scott | Chief Operating Officer | Direct | Sell | 9182026 | 62.40 | 4,000 | 249,600 | 2,184,686 | Form |
| 2 | Thau, Daniel Mark | Direct | Buy | 8132026 | 64.37 | 350 | 22,530 | 582,291 | Form | |
| 3 | Thau, Daniel Mark | Direct | Buy | 5202026 | 65.09 | 300 | 19,527 | 566,023 | Form | |
| 4 | Sanfrey, Jeffrey Scott | Chief Operating Officer | Direct | Sell | 3052026 | 58.54 | 5,192 | 303,940 | 2,283,704 | Form |
| 5 | Radulescu, Razvan | Chief Financial Officer | Direct | Sell | 2202026 | 60.98 | 3,925 | 239,346 | 2,576,710 | Form |
| 6 | Radulescu, Razvan | Chief Financial Officer | Direct | Sell | 12172025 | 51.58 | 7,006 | 361,369 | 2,381,964 | Form |
| 7 | Horlock, Phil | Direct | Sell | 12162025 | 50.42 | 15,381 | 775,489 | 11,363,609 | Form | |
| 8 | Radulescu, Razvan | Chief Financial Officer | Direct | Sell | 12102025 | 50.39 | 7,984 | 402,314 | 2,473,494 | Form |
| 9 | Thau, Daniel Mark | Direct | Buy | 12052025 | 51.05 | 400 | 20,420 | 311,354 | Form | |
| 10 | Horlock, Phil | Direct | Sell | 9152025 | 58.00 | 13,578 | 787,524 | 13,964,428 | Form | |
| 11 | Radulescu, Razvan | Chief Financial Officer | Direct | Sell | 9032025 | 57.41 | 6,709 | 385,164 | 2,341,984 | Form |
| 12 | Horlock, Phil | Direct | Sell | 9022025 | 59.02 | 13,000 | 767,260 | 14,210,009 | Form |
Investor Activity (13F)
Updated Nov 10, 2026Active managers (13F portfolio over $250M, at least 3 holdings) with a position over $5M that is either over 10% of their portfolio or held in a concentrated book of 50 or fewer total positions. Index/ETF, sovereign, bank, community-bank and charitable/donor-advised filers are excluded.
| Active Manager |
|---|
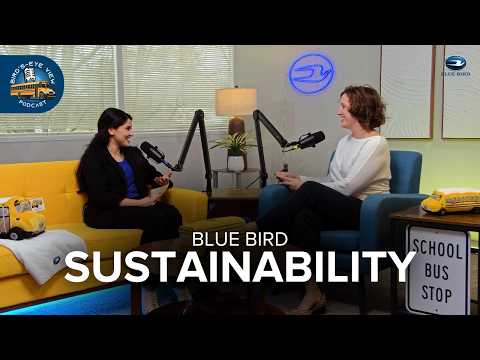
Blue Bird — Investor Video Playlist


Industry Resources
| Industrials Resources |
| IndustryWeek |
| Manufacturing.net |
| Aviation Week |
| Agricultural & Farm Machinery Resources |
| Farm Equipment |
| AgEquipment Intelligence |
| Implement & Tractor |
External Quote Links
| Y Finance | Barrons |
| TradingView | Morningstar |
| SeekingAlpha | ValueLine |
| Motley Fool | Robinhood |
| CNBC | Etrade |
| MarketWatch | Unusual Whales |
| YCharts | Perplexity Finance |
| FinViz |
Prefer one of these to Trefis? Tell us why.