
Rivian Automotive (RIVN)
Market Price (8/23/2026): $16.96 | Market Cap: $22.5 BilSector: Consumer Discretionary | Industry: Automobile Manufacturers
Rivian Automotive (RIVN)
Market Price (8/23/2026): $16.96Market Cap: $22.5 BilSector: Consumer DiscretionaryIndustry: Automobile Manufacturers
Investment Highlights Why It Matters Detailed financial logic regarding cash flow yields vs trend-riding momentum.
Strong revenue growthRev Chg LTMRevenue Change % Last Twelve Months (LTM) is 14% Megatrend and thematic driversMegatrends include Electric Vehicles & Autonomous Driving. Themes include EV Manufacturing, EV Charging Infrastructure, and Autonomous Driving Technology. | Weak multi-year price returns2Y Excs Rtn is -9.7%, 3Y Excs Rtn is -94% Meaningful short interestShort Interest % of Basic SharesShort Interest % of Basic Shares = (Short Interest Quantity) / (Basic Shares Outstanding). A high fraction of short interest can indicate potential risk of a short squeeze. is 12% | Not profitable at operating income levelOp Inc LTMOperating Income, Last Twelve Months is -3.5 Bil, Op Mgn LTMOperating Margin = Operating Income / Revenue Reflects profitability before taxes and before impact of capital structure (interest payments). is -60% Expensive valuation multiplesP/SPrice/Sales ratio is 3.8x Significant share based compensationSBC/Rev LTMShare Based Compensation / Revenue (Sales), Last Twelve Months (LTM) is 14% Not cash flow generativeCFO/Rev LTMCash Flow from Operations / Revenue (Sales), Last Twelve Months (LTM) is -31%, FCF/Rev LTMFree Cash Flow / Revenue (Sales), Last Twelve Months (LTM) is -59% Yield minus risk free rate is negativeERPEquity Risk Premium (ERP) = Total Yield - Risk Free Rate, Reflects the premium above risk free assets offered by the investment. is -19% Key risksRIVN key risks include [1] a history of significant financial losses and high cash burn as it scales operations, Show more. |
| Strong revenue growthRev Chg LTMRevenue Change % Last Twelve Months (LTM) is 14% |
| Megatrend and thematic driversMegatrends include Electric Vehicles & Autonomous Driving. Themes include EV Manufacturing, EV Charging Infrastructure, and Autonomous Driving Technology. |
| Weak multi-year price returns2Y Excs Rtn is -9.7%, 3Y Excs Rtn is -94% |
| Meaningful short interestShort Interest % of Basic SharesShort Interest % of Basic Shares = (Short Interest Quantity) / (Basic Shares Outstanding). A high fraction of short interest can indicate potential risk of a short squeeze. is 12% |
| Not profitable at operating income levelOp Inc LTMOperating Income, Last Twelve Months is -3.5 Bil, Op Mgn LTMOperating Margin = Operating Income / Revenue Reflects profitability before taxes and before impact of capital structure (interest payments). is -60% |
| Expensive valuation multiplesP/SPrice/Sales ratio is 3.8x |
| Significant share based compensationSBC/Rev LTMShare Based Compensation / Revenue (Sales), Last Twelve Months (LTM) is 14% |
| Not cash flow generativeCFO/Rev LTMCash Flow from Operations / Revenue (Sales), Last Twelve Months (LTM) is -31%, FCF/Rev LTMFree Cash Flow / Revenue (Sales), Last Twelve Months (LTM) is -59% |
| Yield minus risk free rate is negativeERPEquity Risk Premium (ERP) = Total Yield - Risk Free Rate, Reflects the premium above risk free assets offered by the investment. is -19% |
| Key risksRIVN key risks include [1] a history of significant financial losses and high cash burn as it scales operations, Show more. |
Qualitative Assessment
AI Analysis | Feedback
Rivian Automotive (RIVN) stock has gained about 5% since 4/30/2026 because of the following key factors:
1. Outperforming Fiscal Q2 2026 Financial Results. Rivian reported an adjusted Earnings Per Share (EPS) of -$0.47 for fiscal Q2 2026, which ended June 30, 2026, significantly beating analyst consensus estimates of -$0.66 by $0.19. The company's revenue for the quarter reached $1.66 billion, a 27.2% increase year-over-year, surpassing analyst expectations of $1.52 billion. Notably, Rivian achieved its first-ever positive consolidated gross profit of $179 million, driven by strong performance in its software and services segment.
2. Exceeding Fiscal Q2 2026 Delivery Guidance and Raising Full-Year Outlook. On July 2, 2026, Rivian announced it delivered 12,194 vehicles during fiscal Q2 2026, exceeding its previously issued guidance of 9,000 to 11,000 vehicles. This strong delivery performance, attributed to growth in R1 and EDV models alongside the initial introduction of R2 deliveries, prompted the company to raise its full-year 2026 delivery guidance from an original range of 62,000-67,000 vehicles to a new range of 65,000-70,000 vehicles.
Show more
Rivian Automotive (RIVN) stock has gained about 5% since 4/30/2026 because of the following key factors:
1. Outperforming Fiscal Q2 2026 Financial Results. Rivian reported an adjusted Earnings Per Share (EPS) of -$0.47 for fiscal Q2 2026, which ended June 30, 2026, significantly beating analyst consensus estimates of -$0.66 by $0.19. The company's revenue for the quarter reached $1.66 billion, a 27.2% increase year-over-year, surpassing analyst expectations of $1.52 billion. Notably, Rivian achieved its first-ever positive consolidated gross profit of $179 million, driven by strong performance in its software and services segment.
2. Exceeding Fiscal Q2 2026 Delivery Guidance and Raising Full-Year Outlook. On July 2, 2026, Rivian announced it delivered 12,194 vehicles during fiscal Q2 2026, exceeding its previously issued guidance of 9,000 to 11,000 vehicles. This strong delivery performance, attributed to growth in R1 and EDV models alongside the initial introduction of R2 deliveries, prompted the company to raise its full-year 2026 delivery guidance from an original range of 62,000-67,000 vehicles to a new range of 65,000-70,000 vehicles.
3. Successful Initial R2 Model Deliveries and Production Momentum. The introduction of the R2 model, with initial customer deliveries commencing in June 2026, contributed to the positive Q2 delivery figures (an estimated 789 units). The R2 is projected to be a significant future profit driver, with Rivian aiming for an annual production capacity exceeding 400,000 R2 vehicles. Reports in August also indicated strong R2 order conversion rates and a production milestone of over 5,000 units, fueling investor optimism.
4. Enhanced Liquidity Position. Rivian bolstered its financial liquidity, ending fiscal Q2 2026 with $5.3 billion in cash and equivalents. The company further strengthened its balance sheet in July 2026 by completing a follow-on equity offering that generated approximately $1.3 billion in net proceeds. Additionally, Rivian is targeting significant future funding, including $1 billion in non-recourse debt from Volkswagen and a $250 million equity investment from Uber.
5. Positive Analyst Sentiment and Increased Price Targets. Following the strong Q2 performance and updated guidance, several financial analysts upgraded their ratings or raised price targets for Rivian. For example, Piper Sandler upgraded Rivian from "neutral" to "overweight" with a revised price target of $20.00, while TD Cowen increased its price target from $20.00 to $21.00.
Show less
Stock Movement Drivers
Fundamental Drivers
The 3.5% change in RIVN stock from 4/30/2026 to 8/22/2026 was primarily driven by a 6.4% change in the company's Total Revenues ($ Mil).| (LTM values as of) | 4302026 | 8222026 | Change |
|---|---|---|---|
| Stock Price ($) | 16.40 | 16.97 | 3.5% |
| Change Contribution By: | |||
| Total Revenues ($ Mil) | 5,528 | 5,883 | 6.4% |
| P/S Multiple | 3.7 | 3.8 | 3.1% |
| Shares Outstanding (Mil) | 1,249 | 1,325 | -5.7% |
| Cumulative Contribution | 3.5% |
Market Drivers
4/30/2026 to 8/22/2026| Return | Correlation | |
|---|---|---|
| RIVN | 3.5% | |
| Market (SPY) | 6.5% | 43.4% |
| Sector (XLY) | -0.3% | 30.2% |
Fundamental Drivers
The 15.1% change in RIVN stock from 1/31/2026 to 8/22/2026 was primarily driven by a 23.9% change in the company's P/S Multiple.| (LTM values as of) | 1312026 | 8222026 | Change |
|---|---|---|---|
| Stock Price ($) | 14.75 | 16.97 | 15.1% |
| Change Contribution By: | |||
| Total Revenues ($ Mil) | 5,835 | 5,883 | 0.8% |
| P/S Multiple | 3.1 | 3.8 | 23.9% |
| Shares Outstanding (Mil) | 1,220 | 1,325 | -7.9% |
| Cumulative Contribution | 15.1% |
Market Drivers
1/31/2026 to 8/22/2026| Return | Correlation | |
|---|---|---|
| RIVN | 15.1% | |
| Market (SPY) | 11.0% | 41.1% |
| Sector (XLY) | -2.4% | 32.3% |
Fundamental Drivers
The 31.9% change in RIVN stock from 7/31/2025 to 8/22/2026 was primarily driven by a 30.8% change in the company's P/S Multiple.| (LTM values as of) | 7312025 | 8222026 | Change |
|---|---|---|---|
| Stock Price ($) | 12.87 | 16.97 | 31.9% |
| Change Contribution By: | |||
| Total Revenues ($ Mil) | 5,006 | 5,883 | 17.5% |
| P/S Multiple | 2.9 | 3.8 | 30.8% |
| Shares Outstanding (Mil) | 1,137 | 1,325 | -14.2% |
| Cumulative Contribution | 31.9% |
Market Drivers
7/31/2025 to 8/22/2026| Return | Correlation | |
|---|---|---|
| RIVN | 31.9% | |
| Market (SPY) | 22.2% | 35.7% |
| Sector (XLY) | 7.2% | 33.5% |
Fundamental Drivers
The -38.6% change in RIVN stock from 7/31/2023 to 8/22/2026 was primarily driven by a -66.9% change in the company's P/S Multiple.| (LTM values as of) | 7312023 | 8222026 | Change |
|---|---|---|---|
| Stock Price ($) | 27.64 | 16.97 | -38.6% |
| Change Contribution By: | |||
| Total Revenues ($ Mil) | 2,224 | 5,883 | 164.5% |
| P/S Multiple | 11.6 | 3.8 | -66.9% |
| Shares Outstanding (Mil) | 930 | 1,325 | -29.8% |
| Cumulative Contribution | -38.6% |
Market Drivers
7/31/2023 to 8/22/2026| Return | Correlation | |
|---|---|---|
| RIVN | -38.6% | |
| Market (SPY) | 73.2% | 34.0% |
| Sector (XLY) | 38.9% | 40.3% |
Price Returns Compared
| 2021 | 2022 | 2023 | 2024 | 2025 | 2026 | Total [1] | |
|---|---|---|---|---|---|---|---|
| Returns | |||||||
| RIVN Return | 3% | -82% | 27% | -43% | 48% | -19% | -84% |
| Peers Return | 127% | -58% | 22% | 18% | 11% | -13% | 31% |
| S&P 500 Return | 27% | -19% | 24% | 23% | 16% | 12% | 103% |
Monthly Win Rates [3] | |||||||
| RIVN Win Rate | 50% | 42% | 58% | 42% | 58% | 50% | |
| Peers Win Rate | 65% | 29% | 46% | 52% | 56% | 50% | |
| S&P 500 Win Rate | 75% | 42% | 67% | 75% | 67% | 50% | |
Max Drawdowns [4] | |||||||
| RIVN Max Drawdown | - | -83% | -45% | -64% | -36% | -36% | |
| Peers Max Drawdown | -38% | -67% | -44% | -37% | -39% | -33% | |
| S&P 500 Max Drawdown | -5% | -25% | -10% | -8% | -19% | -9% | |
[1] Cumulative total returns since the beginning of 2021
[2] Peers: TSLA, F, GM, LCID.
[3] Win Rate = % of calendar months in which monthly returns were positive
[4] Max drawdown represents maximum peak-to-trough decline within a year
[5] 2026 data is for the year up to 8/21/2026 (YTD)
How Low Can It Go
| Event | RIVN | S&P 500 |
|---|---|---|
| 2025 US Tariff Shock | ||
| % Loss | -23.8% | -18.8% |
| % Gain to Breakeven | 31.3% | 23.1% |
| Time to Breakeven | 57 days | 79 days |
| 2024 Yen Carry Trade Unwind | ||
| % Loss | -19.3% | -7.8% |
| % Gain to Breakeven | 23.9% | 8.5% |
| Time to Breakeven | 140 days | 18 days |
| 2023 SVB Regional Banking Crisis | ||
| % Loss | -36.6% | -6.7% |
| % Gain to Breakeven | 57.7% | 7.1% |
| Time to Breakeven | 69 days | 31 days |
In The Past
Rivian Automotive's stock fell -23.8% during the 2025 US Tariff Shock. Such a loss loss requires a 31.3% gain to breakeven.
Preserve Wealth
Limiting losses and compounding gains is essential to preserving wealth.
Asset Allocation
Actively managed asset allocation strategies protect wealth. Learn more.
| Event | RIVN | S&P 500 |
|---|---|---|
| 2025 US Tariff Shock | ||
| % Loss | -23.8% | -18.8% |
| % Gain to Breakeven | 31.3% | 23.1% |
| Time to Breakeven | 57 days | 79 days |
| 2023 SVB Regional Banking Crisis | ||
| % Loss | -36.6% | -6.7% |
| % Gain to Breakeven | 57.7% | 7.1% |
| Time to Breakeven | 69 days | 31 days |
In The Past
Rivian Automotive's stock fell -23.8% during the 2025 US Tariff Shock. Such a loss loss requires a 31.3% gain to breakeven.
Preserve Wealth
Limiting losses and compounding gains is essential to preserving wealth.
Asset Allocation
Actively managed asset allocation strategies protect wealth. Learn more.
About Rivian Automotive (RIVN)
Rivian Automotive, Inc. (RIVN) is an electric vehicle (EV) manufacturer that designs, develops, and produces a range of electric vehicles and associated accessories. Founded in 2009, the company operates with a direct-to-customer sales model, serving both individual consumers and large commercial clients.
The company's product portfolio includes premium electric five-passenger pickup trucks and sports utility vehicles, primarily targeting the consumer market. Additionally, Rivian has developed a specialized Rivian Commercial Vehicle platform, notably collaborating with Amazon.com to produce electric Delivery Vans, serving the significant commercial fleet market.
AI Analysis | Feedback
Tesla for trucks and SUVs.
The Tesla of electric trucks and commercial vans.
AI Analysis | Feedback
- Electric Pickup Trucks: Rivian offers five-passenger electric pickup trucks.
- Electric Sports Utility Vehicles (SUVs): Rivian provides five-passenger electric sports utility vehicles.
- Electric Delivery Vans (EDVs): Rivian develops electric delivery vans as part of its commercial vehicle platform, notably in collaboration with Amazon.
- Vehicle Accessories: Rivian sells various accessories designed for its electric vehicles.
AI Analysis | Feedback
Rivian Automotive (RIVN) serves both commercial and consumer markets. Its major customers can be identified as follows:
Commercial Market Customers:
- Amazon.com (AMZN): Amazon is a significant commercial customer for Rivian. Rivian provides electric Delivery Vans (EDVs) based on its Rivian Commercial Vehicle platform, developed in collaboration with Amazon.com.
Consumer Market Customers (Categories):
Rivian sells its R1T pickup trucks and R1S SUVs directly to individual consumers. These customers generally fall into the following categories:
- Early Adopters and Technology Enthusiasts: Individuals eager to embrace advanced electric vehicle technology and innovative design, often with a willingness to invest in premium, cutting-edge products.
- Adventure and Outdoor Lifestyle Enthusiasts: Consumers who value the off-road capabilities, utility, and rugged design of Rivian's vehicles, aligning with an active outdoor lifestyle and a need for versatile, adventure-ready transportation.
- Environmentally Conscious Premium Buyers: Individuals committed to sustainability and reducing their environmental impact, who are looking for a high-performance, luxury electric vehicle that offers a compelling alternative to traditional gasoline-powered trucks and SUVs.
AI Analysis | Feedback
Major suppliers for Rivian Automotive (RIVN) include:
- LG Energy Solution (KRX: 373220)
- Infineon Technologies (FWB: IFX)
- NXP Semiconductors (NASDAQ: NXPI)
- CATL (SZSE: 300750)
- Magna International (NYSE: MGA, TSX: MG)
- BorgWarner (NYSE: BWA)
AI Analysis | Feedback
RJ Scaringe - Founder and Chief Executive Officer
RJ Scaringe founded the company, originally named Mainstream Motors, in 2009. He holds a bachelor's degree in mechanical engineering from Rensselaer Polytechnic Institute and a master's degree and doctorate in mechanical engineering from MIT's Sloan Automotive Lab. In November 2023, he took on an expanded role, directly overseeing all product-related functions, including software, autonomy, and design. Rivian secured over $15 billion in private funding before its initial public offering in November 2021.
Claire McDonough - Chief Financial Officer
Claire McDonough has served as Rivian's Chief Financial Officer since January 2021. She earned a B.A. from Duke University and an M.B.A. from the University of Chicago Booth School of Business. Before joining Rivian, she was the co-head of Disruptive Commerce Investment Banking at JP Morgan.
Javier Varela - Chief Operations Officer
Javier Varela was appointed as Rivian's Chief Operations Officer and is set to begin in August. He previously served as Chief Operating Officer and Deputy CEO at Volvo Cars for eight years, where he led engineering, program management, manufacturing, supply chain, and procurement organizations across 14 industrial sites worldwide. At Rivian, he will oversee procurement, manufacturing, logistics, and quality.
Mike Callahan - Chief Administrative Officer and Secretary
Mike Callahan joined Rivian in February 2023 as Chief Legal Officer. He has since been appointed Chief Administrative Officer, a role in which he leads Rivian's Legal, Public Policy and Regulatory, Communications, People, and Sustainability teams. Prior to Rivian, he was the Executive Director of the Arthur and Toni Rembe Rock Center for Corporate Governance and a Professor of the Practice of Law at Stanford University. He also held roles as Senior Vice President and General Counsel at LinkedIn, Executive Vice President and Chief Legal Officer at Ten-X, and Executive Vice President and General Counsel at Yahoo! Inc.
Greg Revelle - Chief Customer Officer
Greg Revelle was appointed Chief Customer Officer in January 2026. He founded Revatek, a startup focused on energy storage solutions for off-grid outdoor use. His prior executive experience includes leadership positions at Kohl's, Best Buy, AutoNation, and Expedia, and he currently serves on the board of Cars.com. In his role at Rivian, Revelle oversees the entire customer journey, including sales, marketing, and operations.
AI Analysis | Feedback
Here are the key risks to Rivian Automotive:
-
Persistent Financial Losses and High Cash Burn: Rivian has consistently reported significant net losses and is burning through billions in cash, raising concerns about its long-term financial viability and path to profitability. The company's cash and investment position, while currently providing a runway, is being diminished by substantial capital expenditures for ramping up production, such as the R2 platform, and ongoing operating costs. This aggressive cash consumption also exposes shareholders to potential dilution through future capital raises.
-
Intense Competition and Market Headwinds: The electric vehicle (EV) market is highly competitive, with Rivian facing established automotive giants like Tesla, Ford, and General Motors, along with other emerging EV manufacturers. These competitors often have greater scale, profitability, and established supply chains. Rivian's ability to differentiate its premium, adventure-oriented electric trucks and SUVs, and maintain market share, is challenged by this intense competition. Furthermore, the loss of federal EV tax credits can directly impact consumer demand for its vehicles, while broader macroeconomic factors like high interest rates and inflation could further dampen consumer spending on expensive items.
-
Production Challenges, Supply Chain Issues, and Execution Risk: Rivian has experienced inconsistencies in production output, often due to underutilized automation systems and labor shortages. The company has also contended with supply chain disruptions, particularly regarding semiconductors and battery materials, and has faced product quality issues leading to vehicle recalls. The successful execution of its cost-cutting strategies and the efficient ramp-up of new platforms like the R2 are critical to its operational efficiency and investor confidence. Any delays in production or unexpected cost overruns could significantly impact its financial performance and market perception.
AI Analysis | Feedback
Increased competition from established legacy automakers and other major electric vehicle manufacturers rapidly entering and scaling production in the electric pickup truck and SUV segments.
AI Analysis | Feedback
Rivian Automotive, Inc. (RIVN) operates in the electric vehicle market, offering five-passenger pickup trucks, sports utility vehicles (SUVs), and electric Delivery Vans (EDVs) through a collaboration with Amazon.com. The addressable markets for these main products are substantial globally.
Electric Pickup Trucks
The global electric pickup truck market is estimated to be valued at USD 24.6 billion in 2025 and is expected to reach USD 127 billion by 2032, exhibiting a compound annual growth rate (CAGR) of 19.6% from 2025 to 2032. Another projection indicates the Electric Pickup Vehicle market size was an estimated USD 22.3 billion in 2024 and is projected to grow to USD 152.81 billion by 2035, with a CAGR of 19.12% during the 2025-2035 forecast period. North America is a dominant region within this market, expected to hold a 43.8% share in 2025.
Electric Sports Utility Vehicles (SUVs)
The global electric SUV market size was estimated at USD 558.34 billion in 2023 and is projected to reach USD 4.33 trillion by 2030, growing at a CAGR of 31.9% from 2024 to 2030.
Electric Delivery Vans
The global electric delivery vans market size is projected to grow significantly, with the market estimated at USD 4.5 billion in 2023 and expected to reach approximately USD 27 billion by 2032, reflecting a compound annual growth rate (CAGR) of 22.2%.
AI Analysis | Feedback
Here are the expected drivers of future revenue growth for Rivian Automotive (RIVN) over the next 2-3 years:
- Launch and Ramp-up of R2 and R3 Models: Rivian's strategic shift towards a mass-market audience with the introduction of the R2 SUV, priced around or below $50,000, is a significant revenue driver. Deliveries of the R2 are anticipated to begin in the second quarter of 2026, with production expected to be between 20,000 and 25,000 units in 2026, experiencing a substantial ramp-up towards the end of the year. This new vehicle, along with the subsequent R3 and R3X models, is projected to significantly expand Rivian's customer base by addressing a larger, more affordable market segment, similar to how Tesla's Model 3 and Y boosted its sales. Rivian expects total vehicle deliveries to increase from approximately 42,000 in 2025 to a range of 62,000 to 67,000 in 2026, with the R2 accounting for most of this incremental volume.
- Growth in Software and Services Revenue: The company anticipates substantial growth in its software and services segment, significantly bolstered by its joint venture with Volkswagen Group. This segment saw revenue increase by over 100% in the fourth quarter of 2025, with about 60% directly attributable to the Volkswagen partnership. This growth is expected to continue at approximately 60% year-over-year, contributing meaningfully to Rivian's gross profit with anticipated margins in the mid-30% range.
- Increased Production Efficiency and Cost Reductions: Rivian is actively focused on improving manufacturing efficiency and reducing costs per vehicle to achieve positive automotive gross profit by 2027. Efforts have already resulted in a $7,000 cost reduction per vehicle in the past year, primarily through material cost optimizations. The R2 platform is specifically designed to cut production costs in half compared to the R1 models, which is expected to be a major factor in driving margin improvement and, consequently, revenue growth through improved profitability per unit. Ongoing factory upgrades and the addition of a supplier park are also contributing to these efficiency gains.
- Expansion of Production Capacity and Volume: While the Georgia plant, with a planned capacity of 400,000 vehicles annually for R2 and R3, is a longer-term growth driver expected to begin operations in 2028, the immediate growth will come from maximizing the existing Normal, Illinois plant. This facility has an upgraded annual production capacity of 215,000 vehicles, providing ample room to increase output as demand for the R2 and other models grows and efficiency improves. The planned production ramp for the R2 in Illinois is crucial for meeting the projected delivery increases in the next 2-3 years.
AI Analysis | Feedback
Share Repurchases
- Rivian reported quarterly stock buybacks of -$139.00 million for December 31, 2025.
Share Issuance
- Rivian's shares outstanding increased from 0.204 billion in December 2021 to 1.186 billion as of December 31, 2025.
- As of March 2026, the number of shares outstanding for Rivian was 1.186 billion, representing a 17.08% increase from 2024.
- The company reported $750 million from the issuance of stock in 2025 and $102 million in 2021.
Inbound Investments
- Rivian entered into a $5.8 billion joint venture with Volkswagen.
- The first $1 billion from this joint venture was turned over in June 2025.
- Rivian anticipates an additional $2 billion from the Volkswagen Group in 2026.
Outbound Investments
- Rivian Automotive reported $0 in long-term investments for 2025, with no change from 2024 or 2023.
Capital Expenditures
- Rivian's capital expenditures averaged $1.408 billion from fiscal years 2021 to 2025, with a peak of $1.794 billion in 2021 and a low of $1.026 billion in 2023.
- For fiscal year 2026, Rivian anticipates capital expenditures ranging from $1.95 billion to $2.05 billion.
- The focus of these capital expenditures includes strategic investments for growth and expansion, such as preparing for the manufacturing launch of the R2 midsize SUV and plant upgrades to boost efficiency.
Peer Outperformance in Automobile Manufacturers
null| Industry | Names | 1Y med | 3Y med | 5Y med | Top 3 by 5Y |
|---|---|---|---|---|---|
| Education Services | 14 | -15.1% | 103.6% | 70.6% | LINC 321% · CVSA 259% · UTI 231% |
| Homebuilding | 18 | -4.9% | 32.7% | 55.2% | GRBK 190% · TOL 161% · PHM 158% |
| Hotels, Resorts & Cruise Lines | 22 | 17.7% | 53.5% | 16.5% | RCL 274% · MAR 177% · HLT 169% |
| Automotive Retail | 18 | -13.8% | 2.5% | 14.1% | MUSA 278% · PAG 186% · ORLY 122% |
| Specialty Stores | 7 | -5.5% | 33.8% | 10.0% | DKS 91% · ASO 25% · SIG 23% |
| Home Improvement Retail | 5 | -16.5% | 1.0% | 8.5% | HD 16% · LOW 16% · HVT 8% |
| Casinos & Gaming | 20 | -7.2% | -24.1% | 2.4% | BRAG 1014% · MCRI 112% · RSI 95% |
| Specialized Consumer Services | 10 | -11.3% | 15.8% | -5.3% | HRB 150% · FTDR 97% · SCI 43% |
| Restaurants | 34 | -7.4% | -5.4% | -7.2% | EAT 370% · CAKE 196% · RAVE 159% |
| Distributors | 4 | -8.0% | -24.6% | -7.6% | ARMK 160% · GPC 26% · LKQ -41% |
| Home Furnishings | 4 | -2.8% | 30.6% | -12.3% | SGI 58% · LZB 8% · MHK -32% |
| Footwear | 9 | 58.9% | 44.6% | -14.5% | WEYS 156% · DECK 27% · SHOO 26% |
| Automotive Parts & Equipment | 38 | -9.1% | -5.3% | -31.9% | MOD 1423% · GTX 275% · STRT 106% |
| Leisure Products | 13 | -4.0% | -10.0% | -32.5% | GOLF 86% · HAS 18% · MCFT 1% |
| Apparel, Accessories & Luxury Goods | 27 | 3.5% | -2.0% | -35.2% | TPR 250% · RL 248% · ELA 229% |
| Apparel Retail | 25 | -1.4% | 3.7% | -38.5% | DXLG 187% · ANF 180% · ROST 103% |
| Leisure Facilities | 12 | -15.2% | -8.6% | -39.7% | OSW 177% · JAKK 115% · ESCA 12% |
| Household Appliances | 18 | 7.7% | 37.4% | -40.6% | KEQU 176% · FLXS 147% · HBB 122% |
| Broadline Retail | 15 | 5.9% | 12.5% | -50.4% | DDS 296% · AMZN 58% · EBAY 55% |
| Computer & Electronics Retail | 3 | -19.2% | 7.8% | -55.8% | BBY -4% · GME -56% · UPBD -61% |
| Automobile Manufacturers ← | 8 | -70.4% | -67.2% | -68.8% | GM 90% · F 54% · TSLA 54% |
| Consumer Electronics | 11 | -18.5% | -21.6% | -75.5% | AXIL 2348% · GRMN 91% · TBCH -54% |
| Other Specialty Retail | 18 | -28.1% | -44.1% | -77.8% | BBW 212% · TLF 105% · WINA 95% |
Latest Trefis Analyses
Research & Analysis
Invest in Strategies
Wealth Management
Peer Comparisons
| Peers to compare with: |
Financials
| Median | |
|---|---|
| Name | |
| Mkt Price | 16.97 |
| Mkt Cap | 57.5 |
| Rev LTM | 103,619 |
| Op Inc LTM | -3,533 |
| FCF LTM | 605 |
| FCF 3Y Avg | -2,586 |
| CFO LTM | 16,947 |
| CFO 3Y Avg | 15,327 |
Growth & Margins
| Median | |
|---|---|
| Name | |
| Rev Chg LTM | 11.8% |
| Rev Chg 3Y Avg | 3.5% |
| Rev Chg Q | 25.5% |
| QoQ Delta Rev Chg LTM | 5.9% |
| Op Inc Chg LTM | -33.6% |
| Op Inc Chg 3Y Avg | -26.8% |
| Op Mgn LTM | -3.7% |
| Op Mgn 3Y Avg | 0.0% |
| QoQ Delta Op Mgn LTM | 0.0% |
| CFO/Rev LTM | 9.0% |
| CFO/Rev 3Y Avg | 8.9% |
| FCF/Rev LTM | 0.3% |
| FCF/Rev 3Y Avg | -1.4% |
Price Behavior
| Market Price | $16.97 | |
| Market Cap ($ Bil) | 22.5 | |
| First Trading Date | 11/10/2021 | |
| Distance from 52W High | -24.4% | |
| 50 Days | 200 Days | |
| DMA Price | $16.34 | $16.25 |
| DMA Trend | up | up |
| Distance from DMA | 3.8% | 4.5% |
| 3M | 1YR | |
| Volatility | 79.1% | 71.3% |
| Downside Capture | 295.95 | 227.09 |
| Upside Capture | 345.82 | 211.27 |
| Correlation (SPY) | 42.8% | 36.4% |
| 1M | 2M | 3M | 6M | 1Y | 3Y | |
|---|---|---|---|---|---|---|
| Beta | 2.63 | 2.60 | 2.62 | 2.20 | 1.97 | 1.57 |
| Up Beta | 2.91 | 1.88 | 1.76 | 1.26 | 1.86 | 0.88 |
| Down Beta | 1.49 | 1.66 | 1.81 | 2.28 | 1.80 | 1.51 |
| Up Capture | 203% | 371% | 337% | 326% | 314% | 719% |
| Bmk +ve Days | 11 | 22 | 35 | 67 | 138 | 427 |
| Stock +ve Days | 11 | 23 | 34 | 65 | 123 | 362 |
| Down Capture | 365% | 279% | 292% | 201% | 156% | 112% |
| Bmk -ve Days | 11 | 21 | 28 | 59 | 114 | 326 |
| Stock -ve Days | 11 | 20 | 29 | 61 | 129 | 386 |
[1] Upside and downside betas calculated using positive and negative benchmark daily returns respectively
Based On 1-Year Data
| Annualized Return | Annualized Volatility | Sharpe Ratio | Correlation with RIVN | |
|---|---|---|---|---|
| RIVN | 40.8% | 71.4% | 0.76 | - |
| Sector ETF (XLY) | 4.3% | 19.6% | 0.10 | 34.0% |
| Equity (SPY) | 21.1% | 12.9% | 1.22 | 36.3% |
| Gold (GLD) | 37.5% | 28.8% | 1.10 | 23.0% |
| Commodities (DBC) | 43.2% | 20.2% | 1.66 | -1.3% |
| Real Estate (VNQ) | 12.9% | 13.8% | 0.64 | 5.8% |
| Bitcoin (BTCUSD) | -31.6% | 44.1% | -0.73 | 25.5% |
Smart multi-asset allocation framework can stack odds in your favor. Learn How
Based On 5-Year Data
| Annualized Return | Annualized Volatility | Sharpe Ratio | Correlation with RIVN | |
|---|---|---|---|---|
| RIVN | -29.9% | 77.5% | -0.15 | - |
| Sector ETF (XLY) | 6.2% | 24.1% | 0.22 | 50.0% |
| Equity (SPY) | 12.9% | 17.2% | 0.57 | 43.2% |
| Gold (GLD) | 20.6% | 18.6% | 0.90 | 9.2% |
| Commodities (DBC) | 10.4% | 19.6% | 0.41 | 6.9% |
| Real Estate (VNQ) | 2.3% | 18.9% | 0.02 | 35.5% |
| Bitcoin (BTCUSD) | 10.4% | 52.8% | 0.38 | 26.9% |
Smart multi-asset allocation framework can stack odds in your favor. Learn How
Based On 10-Year Data
| Annualized Return | Annualized Volatility | Sharpe Ratio | Correlation with RIVN | |
|---|---|---|---|---|
| RIVN | -16.2% | 77.5% | -0.15 | - |
| Sector ETF (XLY) | 12.3% | 22.2% | 0.51 | 50.0% |
| Equity (SPY) | 15.2% | 17.9% | 0.72 | 43.2% |
| Gold (GLD) | 12.7% | 16.2% | 0.64 | 9.2% |
| Commodities (DBC) | 8.0% | 18.0% | 0.36 | 6.9% |
| Real Estate (VNQ) | 5.0% | 20.7% | 0.20 | 35.5% |
| Bitcoin (BTCUSD) | 63.1% | 66.1% | 1.03 | 26.9% |
Smart multi-asset allocation framework can stack odds in your favor. Learn How
Earnings Returns History
Updated 8/10/2026| Forward Returns | |||
|---|---|---|---|
| Earnings Date | 1D Returns | 5D Returns | 21D Returns |
| 7/30/2026 | -9.6% | -8.6% | |
| 4/30/2026 | -8.4% | -13.5% | 3.4% |
| 2/12/2026 | 26.6% | 9.1% | 9.5% |
| 11/4/2025 | 23.4% | 44.2% | 43.6% |
| 8/5/2025 | -4.2% | -1.5% | 12.8% |
| 5/6/2025 | -5.8% | 10.1% | 2.1% |
| 2/20/2025 | -4.7% | -14.8% | -14.8% |
| 11/7/2024 | 5.4% | 2.6% | 43.8% |
| ... | |||
| SUMMARY STATS | |||
| # Positive | 7 | 8 | 10 |
| # Negative | 13 | 12 | 9 |
| Median Positive | 17.4% | 9.7% | 11.5% |
| Median Negative | -7.6% | -9.8% | -7.2% |
| Max Positive | 26.6% | 44.2% | 43.8% |
| Max Negative | -25.6% | -26.6% | -32.8% |
| Forward Returns | |||
|---|---|---|---|
| Earnings Date | 1D Returns | 5D Returns | 21D Returns |
| 7/30/2026 | -9.6% | -8.6% | |
| 4/30/2026 | -8.4% | -13.5% | 3.4% |
| 2/12/2026 | 26.6% | 9.1% | 9.5% |
| 11/4/2025 | 23.4% | 44.2% | 43.6% |
| 8/5/2025 | -4.2% | -1.5% | 12.8% |
| 5/6/2025 | -5.8% | 10.1% | 2.1% |
| 2/20/2025 | -4.7% | -14.8% | -14.8% |
| 11/7/2024 | 5.4% | 2.6% | 43.8% |
| 8/6/2024 | -6.9% | -8.5% | -7.2% |
| 5/7/2024 | 0.2% | 9.2% | 14.5% |
| 2/21/2024 | -25.6% | -26.6% | -27.4% |
| 11/7/2023 | -2.4% | -3.0% | 10.2% |
| 8/8/2023 | -9.9% | -16.2% | -5.6% |
| 5/9/2023 | 1.8% | -5.6% | 1.4% |
| 2/28/2023 | -18.3% | -24.1% | -26.2% |
| 11/9/2022 | 17.4% | 18.7% | -2.8% |
| 8/11/2022 | -0.1% | -7.8% | -0.5% |
| 5/11/2022 | 18.0% | 32.5% | 37.7% |
| 3/10/2022 | -7.6% | 2.4% | -5.7% |
| 12/16/2021 | -10.3% | -11.0% | -32.8% |
| SUMMARY STATS | |||
| # Positive | 7 | 8 | 10 |
| # Negative | 13 | 12 | 9 |
| Median Positive | 17.4% | 9.7% | 11.5% |
| Median Negative | -7.6% | -9.8% | -7.2% |
| Max Positive | 26.6% | 44.2% | 43.8% |
| Max Negative | -25.6% | -26.6% | -32.8% |
SEC Filings
Expand for More| Report Date | Filing Date | Filing |
|---|---|---|
| 06/30/2026 | 07/30/2026 | 10-Q |
| 03/31/2026 | 04/30/2026 | 10-Q |
| 12/31/2025 | 02/12/2026 | 10-K |
| 09/30/2025 | 11/04/2025 | 10-Q |
| 06/30/2025 | 08/05/2025 | 10-Q |
| 03/31/2025 | 05/06/2025 | 10-Q |
| 12/31/2024 | 02/24/2025 | 10-K |
| 09/30/2024 | 11/07/2024 | 10-Q |
| 06/30/2024 | 08/06/2024 | 10-Q |
| 03/31/2024 | 05/07/2024 | 10-Q |
| 12/31/2023 | 02/26/2024 | 10-K |
| 09/30/2023 | 11/07/2023 | 10-Q |
| 06/30/2023 | 08/08/2023 | 10-Q |
| 03/31/2023 | 05/09/2023 | 10-Q |
| 12/31/2022 | 02/28/2023 | 10-K |
| 09/30/2022 | 11/09/2022 | 10-Q |
| Report Date | Filing Date | Filing |
|---|---|---|
| 06/30/2026 | 07/30/2026 | 10-Q |
| 03/31/2026 | 04/30/2026 | 10-Q |
| 12/31/2025 | 02/12/2026 | 10-K |
| 09/30/2025 | 11/04/2025 | 10-Q |
| 06/30/2025 | 08/05/2025 | 10-Q |
| 03/31/2025 | 05/06/2025 | 10-Q |
| 12/31/2024 | 02/24/2025 | 10-K |
| 09/30/2024 | 11/07/2024 | 10-Q |
| 06/30/2024 | 08/06/2024 | 10-Q |
| 03/31/2024 | 05/07/2024 | 10-Q |
| 12/31/2023 | 02/26/2024 | 10-K |
| 09/30/2023 | 11/07/2023 | 10-Q |
| 06/30/2023 | 08/08/2023 | 10-Q |
| 03/31/2023 | 05/09/2023 | 10-Q |
| 12/31/2022 | 02/28/2023 | 10-K |
| 09/30/2022 | 11/09/2022 | 10-Q |
| 06/30/2022 | 08/11/2022 | 10-Q |
| 03/31/2022 | 05/11/2022 | 10-Q |
| 12/31/2021 | 03/31/2022 | 10-K |
| 09/30/2021 | 12/17/2021 | 10-Q |
| 06/30/2021 | 11/12/2021 | 424B4 |
Recent Forward Guidance
Updated 7/31/2026Latest: Q2 2026 Earnings Reported 7/30/2026
| Forward Guidance | Guidance Change | ||||||
|---|---|---|---|---|---|---|---|
| Metric | Low | Mid | High | % Chg | % Delta | Change | Prior |
| 2026 Vehicles Delivered | 65,000 | 67,500 | 70,000 | 4.7% | Raised | Guidance: 64,500 for 2026 | |
| 2026 Adjusted EBITDA | -2.00 Bil | -1.90 Bil | -1.80 Bil | 2.6% | Raised | Guidance: -1.95 Bil for 2026 | |
| 2026 Capital Expenditures | 1.70 Bil | 1.75 Bil | 1.80 Bil | -12.5% | Lowered | Guidance: 2.00 Bil for 2026 | |
Insider Activity
Updated 8/21/2026| # | Owner | Title | Holding | Action | Filing Date | Price | Shares | Transacted Value | Value of Held Shares | Form |
|---|---|---|---|---|---|---|---|---|---|---|
| 1 | McDonough, Claire | Chief Financial Officer | Direct | Sell | 8212026 | 16.00 | 8,023 | 128,368 | 13,106,848 | Form |
| 2 | McDonough, Claire | Chief Financial Officer | Direct | Sell | 8182026 | 14.50 | 13,144 | 190,650 | 11,998,302 | Form |
| 3 | Boone, Karen | See footnote | Sell | 7082026 | 20.00 | 20,000 | 400,000 | 2,200,000 | Form | |
| 4 | McDonough, Claire | Chief Financial Officer | Direct | Sell | 6052026 | 18.00 | 8,022 | 144,396 | 15,821,730 | Form |
| 5 | McDonough, Claire | Chief Financial Officer | Direct | Sell | 6022026 | 16.00 | 8,023 | 128,368 | 14,192,112 | Form |
| # | Owner | Title | Holding | Action | Filing Date | Price | Shares | Transacted Value | Value of Held Shares | Form |
|---|---|---|---|---|---|---|---|---|---|---|
| 1 | McDonough, Claire | Chief Financial Officer | Direct | Sell | 8212026 | 16.00 | 8,023 | 128,368 | 13,106,848 | Form |
| 2 | McDonough, Claire | Chief Financial Officer | Direct | Sell | 8182026 | 14.50 | 13,144 | 190,650 | 11,998,302 | Form |
| 3 | Boone, Karen | See footnote | Sell | 7082026 | 20.00 | 20,000 | 400,000 | 2,200,000 | Form | |
| 4 | McDonough, Claire | Chief Financial Officer | Direct | Sell | 6052026 | 18.00 | 8,022 | 144,396 | 15,821,730 | Form |
| 5 | McDonough, Claire | Chief Financial Officer | Direct | Sell | 6022026 | 16.00 | 8,023 | 128,368 | 14,192,112 | Form |
| 6 | Scaringe, Robert J | Chief Executive Officer | Direct | Sell | 5292026 | 15.00 | 34,818 | 522,270 | 13,834,290 | Form |
| 7 | McDonough, Claire | Chief Financial Officer | Direct | Sell | 5222026 | 14.00 | 7,600 | 106,400 | 12,530,420 | Form |
| 8 | McDonough, Claire | Chief Financial Officer | Direct | Sell | 5192026 | 13.43 | 5,544 | 74,481 | 12,126,473 | Form |
| 9 | Gomez, Aidan N | Direct | Buy | 5192026 | 13.97 | 18,000 | 251,460 | 810,036 | Form | |
| 10 | Volkswagen, Ag | See footnote. | Buy | 5042026 | 15.90 | 62,889,522 | 999,943,400 | 3,335,337,356 | Form | |
| 11 | McDonough, Claire | Chief Financial Officer | Direct | Sell | 4242026 | 18.00 | 10,245 | 184,410 | 17,042,652 | Form |
| 12 | Scaringe, Robert J | Chief Executive Officer | Direct | Sell | 4162026 | 16.17 | 21,446 | 346,782 | 16,188,401 | Form |
| 13 | Scaringe, Robert J | Chief Executive Officer | Direct | Sell | 4022026 | 15.00 | 20,264 | 303,960 | 15,338,760 | Form |
| 14 | Scaringe, Robert J | Chief Executive Officer | Direct | Sell | 3192026 | 15.60 | 17,450 | 272,230 | 16,269,055 | Form |
| 15 | Scaringe, Robert J | Chief Executive Officer | Direct | Sell | 3052026 | 15.00 | 17,450 | 261,750 | 15,409,215 | Form |
| 16 | Flatley, Jay T | Direct | Buy | 3052026 | 8.84 | 1,250 | 11,055 | 1,433,347 | Form | |
| 17 | Flatley, Jay T | Direct | Sell | 3052026 | 17.07 | 490 | 8,366 | 2,745,616 | Form | |
| 18 | Flatley, Jay T | Direct | Buy | 3052026 | 20.67 | 490 | 10,131 | 3,335,020 | Form | |
| 19 | Flatley, Jay T | Direct | Sell | 3052026 | 25.71 | 60 | 1,543 | 4,134,607 | Form | |
| 20 | Flatley, Jay T | Direct | Buy | 3052026 | 26.83 | 60 | 1,610 | 4,316,909 | Form | |
| 21 | Flatley, Jay T | Direct | Sell | 3052026 | 62.22 | 30 | 1,867 | 10,006,446 | Form | |
| 22 | Flatley, Jay T | Direct | Buy | 3052026 | 82.84 | 30 | 2,485 | 13,324,444 | Form | |
| 23 | Scaringe, Robert J | Chief Executive Officer | Direct | Sell | 2182026 | 16.80 | 34,900 | 586,236 | 17,548,973 | Form |
| 24 | McDonough, Claire | Chief Financial Officer | Direct | Sell | 2182026 | 16.80 | 27,133 | 455,699 | 11,434,641 | Form |
| 25 | Scaringe, Robert J | Chief Executive Officer | Direct | Sell | 1222026 | 16.03 | 17,450 | 279,762 | 17,879,254 | Form |
| 26 | Scaringe, Robert J | Chief Executive Officer | Direct | Sell | 12292025 | 21.43 | 17,450 | 373,871 | 24,641,430 | Form |
| 27 | Krawiec, Peter | Peter Krawiec 2025 GRAT | Sell | 12172025 | 19.45 | 3,655 | 71,077 | 566,321 | Form | |
| 28 | Scaringe, Robert J | Chief Executive Officer | Direct | Sell | 12112025 | 17.53 | 17,450 | 305,972 | 20,472,213 | Form |
| 29 | McDonough, Claire | Chief Financial Officer | Direct | Sell | 12042025 | 18.00 | 8,039 | 144,702 | 13,140,306 | Form |
| 30 | McDonough, Claire | Chief Financial Officer | Direct | Sell | 12042025 | 17.14 | 21,210 | 363,469 | 12,647,844 | Form |
| 31 | Scaringe, Robert J | Chief Executive Officer | Direct | Sell | 11282025 | 15.11 | 17,450 | 263,729 | 17,909,515 | Form |
| 32 | Scaringe, Robert J | Chief Executive Officer | Direct | Sell | 11132025 | 16.60 | 52,350 | 868,832 | 20,686,085 | Form |
| 33 | Scaringe, Robert J | Chief Executive Officer | Direct | Sell | 10022025 | 15.14 | 17,450 | 264,186 | 19,662,631 | Form |
| 34 | Scaringe, Robert J | Chief Executive Officer | Direct | Sell | 9182025 | 14.00 | 17,450 | 244,300 | 18,426,870 | Form |
| 35 | Scaringe, Robert J | Chief Executive Officer | Direct | Sell | 9122025 | 14.00 | 17,450 | 244,300 | 18,671,170 | Form |
| 36 | McDonough, Claire | Chief Financial Officer | Direct | Sell | 8192025 | 12.28 | 7,247 | 88,993 | 9,694,385 | Form |
Investor Activity (13F)
Updated Aug 23, 2026Active managers (13F portfolio over $250M, at least 3 holdings) with a position over $5M that is either over 10% of their portfolio or held in a concentrated book of 50 or fewer total positions. Index/ETF, sovereign, bank, community-bank and charitable/donor-advised filers are excluded.
| Active Manager |
|---|
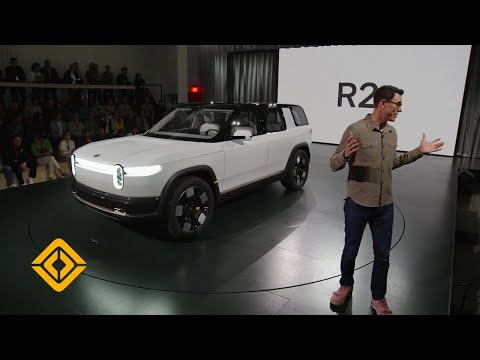
Rivian Automotive — Investor Video Playlist


Industry Resources
| Consumer Discretionary Resources |
| Retail Dive |
| Business of Fashion (BoF) |
| WWD (Women's Wear Daily) |
| National Retail Federation (NRF) |
| McKinsey & Company - Consumer |
| Mintel Consumer Trends |
| Automobile Manufacturers Resources |
| MotorTrend |
| Car and Driver |
| The Drive |
External Quote Links
| Y Finance | Barrons |
| TradingView | Morningstar |
| SeekingAlpha | ValueLine |
| Motley Fool | Robinhood |
| CNBC | Etrade |
| MarketWatch | Unusual Whales |
| YCharts | Perplexity Finance |
| FinViz |
Prefer one of these to Trefis? Tell us why.