
Lockheed Martin (LMT)
Market Price (9/27/2026): $519.5 | Market Cap: $119.6 BilSector: Industrials | Industry: Aerospace & Defense
Lockheed Martin (LMT)
Market Price (9/27/2026): $519.5Market Cap: $119.6 BilSector: IndustrialsIndustry: Aerospace & Defense
Investment Highlights Why It Matters Detailed financial logic regarding cash flow yields vs trend-riding momentum.
Attractive yieldTotal YieldTotal Yield = Earnings Yield + Dividend Yield, Earnings Yield = Net Income / Market Cap Dividend Yield = Total Dividends / Market Cap is 7.9%, Dividend Yield is 2.7%, ERPEquity Risk Premium (ERP) = Total Yield - Risk Free Rate, Reflects the premium above risk free assets offered by the investment. is 4.0%, FCF Yield is 7.3% Attractive cash flow generationCFO/Rev LTMCash Flow from Operations / Revenue (Sales), Last Twelve Months (LTM) is 14%, FCF/Rev LTMFree Cash Flow / Revenue (Sales), Last Twelve Months (LTM) is 11%, CFO LTM is 10 Bil, FCF LTM is 8.7 Bil Stock buyback supportStock Buyback 3Y Total is 11 Bil Low stock price volatilityVol 12M is 28% Megatrend and thematic driversMegatrends include Advanced Aviation & Space, Autonomous Technologies, and Cybersecurity. Themes include Commercial Space Exploration, Show more. | Weak multi-year price returns2Y Excs Rtn is -40%, 3Y Excs Rtn is -44% | Key risksLMT key risks include [1] significant financial losses from cost overruns and delays on critical contracts, Show more. |
| Attractive yieldTotal YieldTotal Yield = Earnings Yield + Dividend Yield, Earnings Yield = Net Income / Market Cap Dividend Yield = Total Dividends / Market Cap is 7.9%, Dividend Yield is 2.7%, ERPEquity Risk Premium (ERP) = Total Yield - Risk Free Rate, Reflects the premium above risk free assets offered by the investment. is 4.0%, FCF Yield is 7.3% |
| Attractive cash flow generationCFO/Rev LTMCash Flow from Operations / Revenue (Sales), Last Twelve Months (LTM) is 14%, FCF/Rev LTMFree Cash Flow / Revenue (Sales), Last Twelve Months (LTM) is 11%, CFO LTM is 10 Bil, FCF LTM is 8.7 Bil |
| Stock buyback supportStock Buyback 3Y Total is 11 Bil |
| Low stock price volatilityVol 12M is 28% |
| Megatrend and thematic driversMegatrends include Advanced Aviation & Space, Autonomous Technologies, and Cybersecurity. Themes include Commercial Space Exploration, Show more. |
| Weak multi-year price returns2Y Excs Rtn is -40%, 3Y Excs Rtn is -44% |
| Key risksLMT key risks include [1] significant financial losses from cost overruns and delays on critical contracts, Show more. |
Qualitative Assessment
AI Analysis | Feedback
Lockheed Martin (LMT) stock has remained largely at the same level since 5/31/2026 because of the following key factors:
1. Lockheed Martin reported strong fiscal Q2 2026 financial results, which ended June 28, 2026, and subsequently raised its full-year guidance. The company announced sales of $20.1 billion, an 11% year-over-year increase, surpassing analyst estimates of $19.33 billion by 3.8%. Diluted Earnings Per Share (EPS) reached $7.94, beating the consensus forecast of approximately $7.20 by 10%. Following these results, Lockheed Martin increased its full-year 2026 revenue outlook to $80.75 billion (midpoint), representing a 2.5% rise from prior guidance and projecting accelerated year-over-year sales growth of approximately 8%.
2. The company achieved a record backlog, significantly bolstered by major contract awards in fiscal Q2 2026. Lockheed Martin's total backlog reached an all-time high of $230 billion as of June 28, 2026, driven by $65 billion in new orders during the quarter. Key contributions to this record backlog included a multi-year contract for THAAD interceptors valued at up to $35 billion and a contract modification for PAC-3 Missile Segment Enhancement interceptors worth up to $53.86 billion.
Show more
Lockheed Martin (LMT) stock has remained largely at the same level since 5/31/2026 because of the following key factors:
1. Lockheed Martin reported strong fiscal Q2 2026 financial results, which ended June 28, 2026, and subsequently raised its full-year guidance. The company announced sales of $20.1 billion, an 11% year-over-year increase, surpassing analyst estimates of $19.33 billion by 3.8%. Diluted Earnings Per Share (EPS) reached $7.94, beating the consensus forecast of approximately $7.20 by 10%. Following these results, Lockheed Martin increased its full-year 2026 revenue outlook to $80.75 billion (midpoint), representing a 2.5% rise from prior guidance and projecting accelerated year-over-year sales growth of approximately 8%.
2. The company achieved a record backlog, significantly bolstered by major contract awards in fiscal Q2 2026. Lockheed Martin's total backlog reached an all-time high of $230 billion as of June 28, 2026, driven by $65 billion in new orders during the quarter. Key contributions to this record backlog included a multi-year contract for THAAD interceptors valued at up to $35 billion and a contract modification for PAC-3 Missile Segment Enhancement interceptors worth up to $53.86 billion.
3. The Missiles and Fire Control segment demonstrated robust performance driven by surging demand. This segment experienced a 19% year-over-year increase in sales during fiscal Q2 2026, primarily due to heightened demand for missile systems and munitions. The segment's operating margin also improved to 12.4%, contributing to overall profitability.
4. Lockheed Martin generated significant free cash flow in fiscal Q2 2026. The company reported free cash flow of $2.9 billion for the fiscal quarter ended June 28, 2026. This marked a substantial improvement from a negative free cash flow of $150 million in the comparable period of fiscal Q2 2025.
Show less
Stock Movement Drivers
Fundamental Drivers
The -0.8% change in LMT stock from 5/31/2026 to 9/26/2026 was primarily driven by a -24.3% change in the company's P/E Multiple.| (LTM values as of) | 5312026 | 9262026 | Change |
|---|---|---|---|
| Stock Price ($) | 523.76 | 519.56 | -0.8% |
| Change Contribution By: | |||
| Total Revenues ($ Mil) | 75,106 | 77,014 | 2.5% |
| Net Income Margin (%) | 6.4% | 8.2% | 27.9% |
| P/E Multiple | 25.1 | 19.0 | -24.3% |
| Shares Outstanding (Mil) | 230 | 230 | -0.1% |
| Cumulative Contribution | -0.8% |
Market Drivers
5/31/2026 to 9/26/2026| Return | Correlation | |
|---|---|---|
| LMT | -0.8% | |
| Market (SPY) | 2.2% | -8.5% |
| Sector (XLI) | -1.3% | 25.3% |
Fundamental Drivers
The -19.6% change in LMT stock from 2/28/2026 to 9/26/2026 was primarily driven by a -36.1% change in the company's P/E Multiple.| (LTM values as of) | 2282026 | 9262026 | Change |
|---|---|---|---|
| Stock Price ($) | 646.37 | 519.56 | -19.6% |
| Change Contribution By: | |||
| Total Revenues ($ Mil) | 75,048 | 77,014 | 2.6% |
| Net Income Margin (%) | 6.7% | 8.2% | 22.1% |
| P/E Multiple | 29.7 | 19.0 | -36.1% |
| Shares Outstanding (Mil) | 231 | 230 | 0.3% |
| Cumulative Contribution | -19.6% |
Market Drivers
2/28/2026 to 9/26/2026| Return | Correlation | |
|---|---|---|
| LMT | -19.6% | |
| Market (SPY) | 13.0% | -3.5% |
| Sector (XLI) | -3.3% | 20.8% |
Fundamental Drivers
The 17.8% change in LMT stock from 8/31/2025 to 9/26/2026 was primarily driven by a 39.5% change in the company's Net Income Margin (%).| (LTM values as of) | 8312025 | 9262026 | Change |
|---|---|---|---|
| Stock Price ($) | 440.94 | 519.56 | 17.8% |
| Change Contribution By: | |||
| Total Revenues ($ Mil) | 71,844 | 77,014 | 7.2% |
| Net Income Margin (%) | 5.9% | 8.2% | 39.5% |
| P/E Multiple | 24.5 | 19.0 | -22.3% |
| Shares Outstanding (Mil) | 234 | 230 | 1.4% |
| Cumulative Contribution | 17.8% |
Market Drivers
8/31/2025 to 9/26/2026| Return | Correlation | |
|---|---|---|
| LMT | 17.8% | |
| Market (SPY) | 20.9% | 1.6% |
| Sector (XLI) | 13.6% | 28.6% |
Fundamental Drivers
The 25.5% change in LMT stock from 8/31/2023 to 9/26/2026 was primarily driven by a 28.4% change in the company's P/E Multiple.| (LTM values as of) | 8312023 | 9262026 | Change |
|---|---|---|---|
| Stock Price ($) | 413.90 | 519.56 | 25.5% |
| Change Contribution By: | |||
| Total Revenues ($ Mil) | 67,393 | 77,014 | 14.3% |
| Net Income Margin (%) | 10.5% | 8.2% | -22.1% |
| P/E Multiple | 14.8 | 19.0 | 28.4% |
| Shares Outstanding (Mil) | 253 | 230 | 9.8% |
| Cumulative Contribution | 25.5% |
Market Drivers
8/31/2023 to 9/26/2026| Return | Correlation | |
|---|---|---|
| LMT | 25.5% | |
| Market (SPY) | 77.8% | 8.1% |
| Sector (XLI) | 64.4% | 27.5% |
Price Returns Compared
| 2021 | 2022 | 2023 | 2024 | 2025 | 2026 | Total [1] | |
|---|---|---|---|---|---|---|---|
| Returns | |||||||
| LMT Return | 3% | 40% | -4% | 10% | 2% | 10% | 72% |
| Peers Return | 21% | 16% | 4% | 3% | 36% | -6% | 92% |
| S&P 500 Return | 27% | -19% | 24% | 23% | 16% | 13% | 105% |
Monthly Win Rates [3] | |||||||
| LMT Win Rate | 50% | 67% | 42% | 58% | 42% | 44% | |
| Peers Win Rate | 57% | 55% | 47% | 58% | 65% | 42% | |
| S&P 500 Win Rate | 75% | 42% | 67% | 75% | 67% | 56% | |
Max Drawdowns [4] | |||||||
| LMT Max Drawdown | -17% | -17% | -20% | -21% | -18% | -27% | |
| Peers Max Drawdown | -17% | -24% | -24% | -22% | -16% | -26% | |
| S&P 500 Max Drawdown | -5% | -25% | -10% | -8% | -19% | -9% | |
[1] Cumulative total returns since the beginning of 2021
[2] Peers: NOC, RTX, BA, GD, LHX. See LMT Returns vs. Peers.
[3] Win Rate = % of calendar months in which monthly returns were positive
[4] Max drawdown represents maximum peak-to-trough decline within a year
[5] 2026 data is for the year up to 9/25/2026 (YTD)
How Low Can It Go
| Event | LMT | S&P 500 |
|---|---|---|
| Summer-Fall 2023 Five Percent Yield Shock | ||
| % Loss | -11.9% | -9.5% |
| % Gain to Breakeven | 13.5% | 10.5% |
| Time to Breakeven | 26 days | 24 days |
| 2020 COVID-19 Crash | ||
| % Loss | -35.9% | -33.7% |
| % Gain to Breakeven | 56.0% | 50.9% |
| Time to Breakeven | 707 days | 140 days |
| Q4 2018 Fed Policy Error / Growth Scare | ||
| % Loss | -28.9% | -19.2% |
| % Gain to Breakeven | 40.7% | 23.8% |
| Time to Breakeven | 148 days | 105 days |
| 2011 US Debt Ceiling Crisis & European Contagion | ||
| % Loss | -16.0% | -17.9% |
| % Gain to Breakeven | 19.0% | 21.8% |
| Time to Breakeven | 76 days | 123 days |
| 2010 Eurozone Sovereign Debt Crisis / Flash Crash | ||
| % Loss | -13.8% | -15.4% |
| % Gain to Breakeven | 16.0% | 18.2% |
| Time to Breakeven | 519 days | 125 days |
| 2008-2009 Global Financial Crisis | ||
| % Loss | -45.4% | -53.4% |
| % Gain to Breakeven | 83.2% | 114.4% |
| Time to Breakeven | 1282 days | 1085 days |
In The Past
Lockheed Martin's stock fell 0.0% during the 2025 US Tariff Shock. Such a loss loss requires a 0.0% gain to breakeven.
Preserve Wealth
Limiting losses and compounding gains is essential to preserving wealth.
Asset Allocation
Actively managed asset allocation strategies protect wealth. Learn more.
| Event | LMT | S&P 500 |
|---|---|---|
| 2020 COVID-19 Crash | ||
| % Loss | -35.9% | -33.7% |
| % Gain to Breakeven | 56.0% | 50.9% |
| Time to Breakeven | 707 days | 140 days |
| Q4 2018 Fed Policy Error / Growth Scare | ||
| % Loss | -28.9% | -19.2% |
| % Gain to Breakeven | 40.7% | 23.8% |
| Time to Breakeven | 148 days | 105 days |
| 2008-2009 Global Financial Crisis | ||
| % Loss | -45.4% | -53.4% |
| % Gain to Breakeven | 83.2% | 114.4% |
| Time to Breakeven | 1282 days | 1085 days |
In The Past
Lockheed Martin's stock fell 0.0% during the 2025 US Tariff Shock. Such a loss loss requires a 0.0% gain to breakeven.
Preserve Wealth
Limiting losses and compounding gains is essential to preserving wealth.
Asset Allocation
Actively managed asset allocation strategies protect wealth. Learn more.
About Lockheed Martin (LMT)
Lockheed Martin Corporation is a leading global security and aerospace company specializing in the research, design, development, manufacture, integration, and sustainment of advanced technology systems, products, and services. The company's operations span four key segments: Aeronautics, Missiles and Fire Control, Rotary and Mission Systems, and Space, each contributing to its comprehensive defense and security portfolio.
Through its Aeronautics segment, Lockheed Martin produces iconic combat and air mobility aircraft, including unmanned aerial vehicles. The Missiles and Fire Control segment delivers critical air and missile defense systems, tactical missiles, and precision strike weapons. Its Rotary and Mission Systems segment offers military and commercial helicopters, advanced radar systems, sea and land-based missile defense, and sophisticated command, control, and cyber solutions. Finally, the Space segment is responsible for satellites, space transportation systems, strategic missile systems, and classified national security programs, integrating space and ground-based intelligence gathering.
Lockheed Martin's primary customer is the U.S. government, for which it provides a vast array of defense, security, and aerospace solutions. The company also conducts significant foreign military sales, which are primarily contracted and facilitated through the U.S. government, extending its reach to allied nations globally.
AI Analysis | Feedback
Here are 1-3 brief analogies for Lockheed Martin (LMT):
- The Boeing of advanced military aircraft, missiles, and space systems.
- The Apple of high-tech defense and national security solutions.
- The General Motors for national defense systems.
AI Analysis | Feedback
- Aircraft: Designs and manufactures combat, air mobility, and other specialized aircraft.
- Unmanned Systems: Develops unmanned air vehicles (UAVs) and unmanned ground vehicles for various missions.
- Missile Systems: Provides a range of air and missile defense systems, tactical missiles, precision strike weapons, and strategic missile systems.
- Fire Control & Radar Systems: Develops advanced systems for target detection, tracking, engagement, and various radar capabilities.
- Naval Systems: Constructs surface ships and integrates sea-based missile defense systems.
- Rotary Wing Aircraft: Manufactures military and commercial helicopters.
- Space Systems: Offers satellites, space transportation systems, and classified national security space systems.
- Command, Control & Cyber Solutions: Delivers integrated command and control systems, mission solutions, and cybersecurity services.
- Simulation & Training Solutions: Provides advanced simulation and training systems for defense and commercial applications.
- Logistics & Engineering Support: Offers comprehensive logistics, readiness, mission operations, and engineering support services for complex systems.
AI Analysis | Feedback
Lockheed Martin (LMT) primarily serves the U.S. government. It also engages in foreign military sales, which are contracted through the U.S. government, indicating that foreign governments are also significant customers, indirectly.
AI Analysis | Feedback
- Raytheon Technologies (RTX)
- Northrop Grumman (NOC)
- BAE Systems (BAESY)
- General Electric (GE)
- Honeywell (HON)
- Rolls-Royce (RYCEY)
- L3Harris Technologies (LHX)
AI Analysis | Feedback
James Taiclet became Chairman, President, and CEO of Lockheed Martin in June 2020. He joined Lockheed Martin's board of directors in January 2018. Prior to Lockheed Martin, Taiclet served as Chairman, President, and CEO of American Tower Corporation, a global real estate investment trust, where he significantly grew the company's market capitalization from approximately $2 billion to over $100 billion and transformed it into a global industry player. His career also includes leadership roles as President of Honeywell Aerospace Services and Vice President of Engine Services at Pratt & Whitney, responsible for military and commercial jet engine overhaul and repair. Taiclet is a U.S. Air Force veteran, serving as an aircraft commander and instructor pilot, and a Gulf War veteran, logging over 5,000 flying hours, primarily in the Lockheed C-141B Starlifter. He is a distinguished graduate of the U.S. Air Force Academy with degrees in engineering and international relations, and holds a master's degree from Princeton University.
Evan Scott, Chief Financial Officer
Evan Scott was appointed Chief Financial Officer for Lockheed Martin in April 2025. A 26-year veteran of Lockheed Martin, Scott is responsible for the corporation's financial strategies, processes, and operations. His previous roles within the company include Vice President and CFO of Lockheed Martin Space, Vice President and Treasurer, and Vice President and CFO of Missiles and Fire Control. He is a graduate of Lockheed Martin's Finance Leadership Development Program and Finance Leadership Academy. Scott holds a bachelor's degree in finance and accounting from Syracuse University and a master's in business administration in finance from the University of Maryland. He succeeded Jesus "Jay" Malave, who left to pursue other opportunities.
Frank St. John, Chief Operating Officer
Frank St. John has served as Chief Operating Officer for Lockheed Martin since June 2020, overseeing the strategic, operational, and financial performance of the corporation's four major business areas. He has dedicated his entire career to Lockheed Martin, joining as an engineering intern more than 30 years ago. Prior to his current role, St. John led the Rotary and Mission Systems (RMS) business area from 2019 to 2020 and the Missiles and Fire Control (MFC) business area from 2018 to 2019. His other positions at MFC included executive vice president and deputy of programs, vice president of Tactical Missiles/Combat Maneuver Systems, and general manager for the MFC Orlando campus. St. John holds a bachelor's and master's degree in electrical engineering from the University of Central Florida.
Stephanie C. Hill, President, Rotary and Mission Systems
Stephanie C. Hill is the President of the Rotary and Mission Systems (RMS) business area at Lockheed Martin. She joined Lockheed Martin in 1987 as a software engineer and has since held increasingly responsible leadership positions. These roles include Senior Vice President of Enterprise Business Transformation, Deputy Executive Vice President of RMS, Senior Vice President of Corporate Strategy and Business Development, and Vice President and General Manager of Cyber, Ships and Advanced Technologies. Hill is a member of the board of directors of S&P Global and The Executive Leadership Council. She graduated with high honors from the University of Maryland, Baltimore County, with a Bachelor of Science degree in computer science and economics, and received an honorary doctorate from the university in 2017.
Robert Lightfoot, President, Space
Robert Lightfoot is the President of Lockheed Martin Space, a more than $11 billion enterprise providing advanced technology systems for national security, civil, and commercial customers. He joined Lockheed Martin in 2019, initially serving as vice president of Operations and then vice president of Strategy and Business Development for Lockheed Martin Space. Before joining Lockheed Martin, Lightfoot had a distinguished 29-year career at NASA, where he rose to the agency's highest-ranking civil service position as Associate Administrator and also served as Acting NASA Administrator. He also served as director of the Marshall Space Flight Center and director of Propulsion Test at Stennis Space Center. Lightfoot earned a bachelor's degree in mechanical engineering from the University of Alabama.
AI Analysis | Feedback
Here are the key risks to Lockheed Martin's business:
- Reliance on Government Contracts and Regulatory Compliance: Lockheed Martin's business is heavily dependent on contracts with the U.S. government and foreign military sales, exposing it to risks associated with government funding levels, budget cycles, policy changes, and the U.S. government's ability to terminate contracts for convenience. Failure to comply with extensive laws and regulations governing government contracts could also lead to significant penalties, reputational damage, and exclusion from key markets.
- Supply Chain Dependencies and Geopolitical Sourcing Risks: The company faces significant risks related to its supply chain, particularly its reliance on critical materials like rare earth metals for key programs such as the F-35 Lightning II and missile defense systems. New U.S. defense procurement rules, effective in 2027, will tighten restrictions on materials sourced from certain foreign supply chains, notably those linked to China, which could disrupt production and delivery timelines if domestic processing capacity for these materials does not scale adequately.
- Program Performance Issues and Internal Control Deficiencies: Lockheed Martin has recently faced significant financial losses in its Aeronautics and Rotary and Mission Systems (RMS) segments, attributed to "performance issues" and problems with specific programs like the Canadian Maritime Helicopter Program. A securities class action lawsuit alleges that the company had inadequate internal controls to assess program risks and overstated its ability to deliver on contracts, leading to substantial pre-tax losses and significant drops in stock price.
AI Analysis | Feedback
The rise of commercial space companies, particularly SpaceX, presents a clear emerging threat to Lockheed Martin. SpaceX's advancements in reusable rocket technology and significantly lower launch costs have disrupted the traditional space launch market, directly impacting United Launch Alliance (ULA), a joint venture co-owned by Lockheed Martin and Boeing, which has historically been a key provider of launch services for the U.S. government. This shift challenges ULA's dominance and, by extension, Lockheed Martin's revenue streams and market position in the launch services sector. Additionally, the broader trend of commercial players developing more agile, cost-effective satellite technologies and space services could challenge Lockheed Martin's traditional role in satellite manufacturing and integration for certain applications within its Space segment.
AI Analysis | Feedback
Lockheed Martin's main products and services operate within several large addressable markets, primarily global in scope.
-
Aeronautics Segment:
- For military aircraft, including combat and air mobility aircraft, the global market size is estimated at USD 50.53 billion in 2025 and is projected to reach USD 76.17 billion by 2034.
- The global market for unmanned aerial vehicles (UAVs) or drones surpassed USD 42.39 billion in 2025 and is projected to cross USD 191.89 billion by 2035.
-
Missiles and Fire Control Segment:
- The global air defense system market size was valued at approximately USD 46.27 billion in 2024 and is projected to reach USD 83.97 billion by 2034.
- The global missiles market, which includes tactical missiles and air-to-ground precision strike weapon systems, was valued at USD 64.26 billion in 2025 and is anticipated to reach USD 122.48 billion by 2034.
-
Rotary and Mission Systems Segment:
- The global military helicopter market size was calculated at USD 35.95 billion in 2025 and is predicted to increase to approximately USD 46.11 billion by 2035.
- The global warship and naval vessels market size was valued at USD 75.1 billion in 2025 and is estimated to reach USD 122.4 billion by 2034.
- The global military radars market size was valued at USD 17.5 billion in 2025 and is estimated to reach USD 24.1 billion by 2034.
- The global military cybersecurity market size was valued at USD 15.7 billion in 2023 and is projected to reach USD 68.5 billion by 2033.
-
Space Segment:
- Global satellite manufacturing revenues grew to USD 20 billion in 2024.
- Worldwide commercial satellite launch revenues increased to USD 9.3 billion in 2024.
AI Analysis | Feedback
Lockheed Martin (LMT) is anticipated to experience revenue growth over the next two to three years, driven by several key factors:
- Robust and Expanding Backlog: Lockheed Martin has consistently reported a record-breaking backlog, reaching $160.6 billion by the end of 2023 and further increasing to an unprecedented $194 billion by the close of 2025. This substantial backlog signifies strong, sustained demand for the company's defense products and services and provides significant revenue visibility for future periods.
- Increased Production and Deliveries of Key Programs: Growth is expected from higher production and delivery volumes across major programs. The Aeronautics segment, particularly the F-35 program, is a significant contributor, with higher volumes in production, development, and sustainment contracts. The Missiles and Fire Control (MFC) segment is also experiencing production ramps for critical tactical and strike missile systems such as Guided Multiple Launch Rocket Systems (GMLRS), High Mobility Artillery Rocket System (HIMARS), Joint Air-to-Surface Standoff Missile (JASSM), Long Range Anti-Ship Missile (LRASM), PAC-3, and Terminal High Altitude Area Defense (THAAD). Lockheed Martin delivered 191 F-35 jets and 620 PAC-3 MSE interceptors in 2025, setting new records, with plans to boost PAC-3 MSE production to 2,000 units annually through multi-year agreements.
- Strategic Investments in Advanced Technologies and Capacity Expansion: Lockheed Martin is making substantial internal investments, projected to be around $5 billion for capital expenditures and research and development in fiscal year 2026. These investments are aimed at enhancing production capacity to meet the surging demand reflected in its backlog and advancing its "21st Century Security®" initiative, which focuses on developing resilient, multi-domain network solutions and other advanced defense technologies. The Space segment is also seeing increased net sales due to higher volume on strategic and missile defense programs, including Fleet Ballistic Missile (FBM), hypersonics, Next Generation Interceptor (NGI), Transport Layer, and GPS III programs.
- Continued Demand Driven by Geopolitical Landscape and Defense Spending: Global geopolitical tensions and an emphasis on national security priorities continue to drive demand for Lockheed Martin's advanced defense technologies. The approval of defense budgets, such as the FY24 defense budget, with robust funding for munitions multi-year procurements, underscores ongoing governmental support and requirements that align with Lockheed Martin's capabilities. This sustained demand translates into new orders and a favorable operating environment for the company.
AI Analysis | Feedback
Share Repurchases
- Lockheed Martin repurchased $3.0 billion of common stock in 2025.
- The company repurchased $3.7 billion of common stock in 2024.
- In 2023, share repurchases totaled $6.0 billion.
- As of October 2025, the board authorized an additional $2 billion for share repurchases, bringing the total authorization for future repurchases to approximately $9.1 billion.
Share Issuance
- Lockheed Martin's shares outstanding have consistently declined, with a 2.38% decrease in 2025 from 2024, and a 4.78% decline in 2024 from 2023, indicating no significant share issuances.
Outbound Investments
- Lockheed Martin submitted a bid to acquire Terran Orbital in March 2024.
- In December 2024, Lockheed Martin formed a subsidiary, Astris AI, to assist U.S. defense companies in incorporating artificial intelligence into their operations.
- The company abandoned its proposed $4.4 billion acquisition of Aerojet Rocketdyne in February 2022 due to regulatory disapproval.
Capital Expenditures
- Capital expenditures were $1.6 billion in 2025, and the company invested more than $3.5 billion during 2025 in production capacity and next-generation technologies.
- In 2024, capital expenditures amounted to $1.685 billion, with over $3 billion invested in research and development and capital investment.
- Lockheed Martin's capital expenditures were $1.691 billion in 2023, and the company invested $1.7 billion in capital expenditures to advance 21st Century Security capabilities.
- Expected capital expenditures for 2026 are estimated to be between $2.5 billion and $2.8 billion, representing a significant increase aimed at meeting customer demand for munitions and investing in R&D.

Peer Outperformance in Aerospace & Defense
| Ticker | Name | Rev Growth 3Y Avg | P/E | 1Y | 3Y | 5Y | 5Y Gap |
|---|---|---|---|---|---|---|---|
| LMT | Lockheed Martin | 4.6% | 19.0x | 9.3% | 37.7% | 68.1% | — |
| ATI | ATI | 4.6% | 53.1x | 124.0% | 348.8% | 979.6% | +912pp |
| DCO | Ducommun | 5.1% | -86.6x | 84.3% | 297.6% | 232.0% | +164pp |
| Industry | Names | 1Y med | 3Y med | 5Y med | Top 3 by 5Y |
|---|---|---|---|---|---|
| Construction & Engineering | 31 | 4.3% | 110.6% | 183.4% | FIX 2185% · STRL 2110% · CDNL 2055% |
| Marine Transportation | 9 | 72.3% | 97.9% | 148.9% | HOS 43005% · ASC 465% · MATX 188% |
| Construction Machinery & Heavy Transportation Equipment | 13 | 5.4% | 46.5% | 121.9% | CAT 348% · ALSN 240% · WAB 229% |
| Aerospace & Defense ← | 55 | -7.5% | 70.5% | 76.3% | ATI 980% · FTAI 863% · HWM 615% |
| Rail Transportation | 7 | 19.3% | 61.1% | 50.3% | FSTR 137% · CSX 64% · RAIL 53% |
| Trading Companies & Distributors | 19 | 4.4% | 36.4% | 47.5% | DXPE 535% · AIT 278% · WCC 217% |
| Industrial Machinery & Supplies & Components | 72 | 11.1% | 53.8% | 43.7% | CRS 1139% · PSIX 1112% · EROC 624% |
| Diversified Support Services | 33 | 16.3% | 34.2% | 31.9% | LIME 3297% · TH 422% · WLFC 352% |
| Cargo Ground Transportation | 16 | 33.0% | -0.3% | 24.8% | XPO 234% · R 212% · CVLG 133% |
| Electrical Components & Equipment | 41 | 7.0% | 58.4% | 22.0% | POWL 2282% · BE 1336% · VRT 954% |
| Building Products | 34 | -12.4% | 2.4% | 18.2% | LMB 633% · GFF 387% · PPIH 315% |
| Industrial Conglomerates | 17 | 9.4% | 5.0% | -3.2% | RCMT 504% · CSW 136% · DD 72% |
| Passenger Ground Transportation | 3 | -32.0% | 44.0% | -5.1% | UBER 47% · CAR -5% · LYFT -73% |
| Agricultural & Farm Machinery | 17 | 4.5% | 0.8% | -8.1% | BLBD 173% · DE 109% · GENC 55% |
| Environmental & Facilities Services | 30 | -15.4% | 19.5% | -8.6% | CECO 895% · ADUR 437% · GEO 335% |
| Research & Consulting Services | 13 | -16.9% | -26.7% | -14.0% | HURN 201% · CRAI 76% · GRNQ 69% |
| Data Processing & Outsourced Services | 6 | -34.1% | -15.1% | -29.8% | EXLS 40% · BR 7% · G -27% |
| Passenger Airlines | 11 | 19.0% | 22.6% | -33.2% | LTM 2741% · UAL 132% · DAL 101% |
| Office Services & Supplies | 9 | 15.7% | 19.6% | -36.0% | PBI 161% · TILE 138% · HNI 49% |
| Air Freight & Logistics | 12 | -20.3% | -22.2% | -39.1% | CHRW 85% · FDX 74% · EXPD 60% |
| Human Resource & Employment Services | 21 | 4.2% | -19.7% | -39.1% | BBSI 66% · ADP 46% · PAYX 9% |
| Security & Alarm Services | 10 | -22.8% | 22.3% | -45.9% | CIX 157% · MG 114% · NL 73% |
| Airport Services | 3 | -75.0% | -78.5% | -68.2% | JOBY -37% · ASLE -68% · UP -100% |
Latest Trefis Analyses
Research & Analysis
Invest in Strategies
Wealth Management
Peer Comparisons
| Peers to compare with: |
Financials
| Median | |
|---|---|
| Name | |
| Mkt Price | 287.21 |
| Mkt Cap | 105.3 |
| Rev LTM | 65,938 |
| Op Inc LTM | 5,130 |
| FCF LTM | 5,046 |
| FCF 3Y Avg | 3,386 |
| CFO LTM | 6,392 |
| CFO 3Y Avg | 4,702 |
Growth & Margins
| Median | |
|---|---|
| Name | |
| Rev Chg LTM | 8.2% |
| Rev Chg 3Y Avg | 8.8% |
| Rev Chg Q | 8.2% |
| QoQ Delta Rev Chg LTM | 2.0% |
| Op Inc Chg LTM | 20.8% |
| Op Inc Chg 3Y Avg | 10.1% |
| Op Mgn LTM | 10.5% |
| Op Mgn 3Y Avg | 9.5% |
| QoQ Delta Op Mgn LTM | 0.2% |
| CFO/Rev LTM | 13.8% |
| CFO/Rev 3Y Avg | 10.6% |
| FCF/Rev LTM | 11.5% |
| FCF/Rev 3Y Avg | 8.4% |
Valuation
| Median | |
|---|---|
| Name | |
| Mkt Cap | 105.3 |
| P/S | 1.7 |
| P/Op Inc | 15.9 |
| P/EBIT | 15.7 |
| P/E | 22.0 |
| P/CFO | 13.9 |
| Total Yield | 6.5% |
| Dividend Yield | 1.8% |
| FCF Yield 3Y Avg | 4.2% |
| D/E | 0.2 |
| Net D/E | 0.2 |
Returns
| Median | |
|---|---|
| Name | |
| 1M Rtn | -8.2% |
| 3M Rtn | -0.7% |
| 6M Rtn | -8.3% |
| 12M Rtn | -3.4% |
| 3Y Rtn | 40.7% |
| 1M Excs Rtn | -9.3% |
| 3M Excs Rtn | -6.0% |
| 6M Excs Rtn | -29.8% |
| 12M Excs Rtn | -17.7% |
| 3Y Excs Rtn | -37.9% |
Comparison Analyses
Segment Financials
Revenue by Segment| $ Mil | 2025 | 2024 | 2023 | 2022 | 2021 |
|---|---|---|---|---|---|
| Aeronautics | 30,638 | 28,995 | 27,777 | 27,236 | 26,967 |
| Rotary and Mission Systems (RMS) | 19,683 | 19,584 | 18,364 | 18,078 | 18,684 |
| Missiles and Fire Control (MFC) | 15,318 | 13,486 | 11,941 | 11,944 | 12,311 |
| Space | 13,357 | 12,871 | 12,963 | 11,913 | 12,174 |
| Intersegment sales | -3,948 | -3,893 | -3,474 | -3,187 | -3,092 |
| Total | 75,048 | 71,043 | 67,571 | 65,984 | 67,044 |
| $ Mil | 2025 | 2024 | 2023 | 2022 | 2021 |
|---|---|---|---|---|---|
| Aeronautics | 2,086 | 2,523 | 2,825 | 2,867 | 2,800 |
| Missiles and Fire Control (MFC) | 1,989 | 413 | 1,541 | 1,637 | 1,650 |
| Financial Accounting Standards (FAS) / Cost accounting standards (CAS) pension operating adjustment | 1,518 | 1,624 | 1,660 | 1,709 | 1,960 |
| Space | 1,345 | 1,226 | 1,158 | 1,057 | 1,184 |
| Rotary and Mission Systems (RMS) | 1,323 | 1,921 | 1,865 | 1,906 | 2,030 |
| Impairment and other charges | -66 | -87 | -92 | -100 | |
| Other, net | -210 | -360 | -203 | -480 | -180 |
| Intangible asset amortization expense | -254 | -247 | -247 | -248 | -285 |
| Severance and other charges | -36 | ||||
| Total | 7,731 | 7,013 | 8,507 | 8,348 | 9,123 |
| $ Mil | 2025 | 2024 | 2023 | 2022 | 2021 |
|---|---|---|---|---|---|
| Rotary and Mission Systems (RMS) | 16,576 | 17,025 | 17,521 | 17,988 | 17,664 |
| Aeronautics | 14,673 | 13,223 | 13,167 | 12,055 | 10,756 |
| Corporate assets | 14,532 | 12,029 | 9,505 | 10,698 | 11,011 |
| Space | 7,755 | 7,388 | 6,560 | 6,351 | 6,199 |
| Missiles and Fire Control (MFC) | 6,304 | 5,952 | 5,703 | 5,788 | 5,243 |
| Total | 59,840 | 55,617 | 52,456 | 52,880 | 50,873 |
Price Behavior
| Market Price | $519.56 | |
| Market Cap ($ Bil) | 119.6 | |
| First Trading Date | 01/03/1977 | |
| Distance from 52W High | -22.2% | |
| 50 Days | 200 Days | |
| DMA Price | $555.06 | $555.84 |
| DMA Trend | up | up |
| Distance from DMA | -6.4% | -6.5% |
| 3M | 1YR | |
| Volatility | 32.7% | 28.4% |
| Downside Capture | -50.72 | 7.64 |
| Upside Capture | -22.35 | 16.51 |
| Correlation (SPY) | -9.4% | 1.4% |
| 1M | 2M | 3M | 6M | 1Y | 3Y | |
|---|---|---|---|---|---|---|
| Beta | 0.39 | -0.32 | -0.21 | -0.06 | 0.05 | 0.13 |
| Up Beta | 0.50 | 0.11 | 0.19 | -0.02 | -0.14 | 0.28 |
| Down Beta | 3.38 | -0.51 | -0.30 | -0.32 | 0.02 | 0.05 |
| Up Capture | -31% | -11% | -15% | -12% | 19% | 3% |
| Bmk +ve Days | 10 | 21 | 32 | 68 | 138 | 427 |
| Stock +ve Days | 11 | 20 | 30 | 52 | 125 | 387 |
| Down Capture | 63% | -90% | -54% | 24% | -0% | 7% |
| Bmk -ve Days | 11 | 21 | 32 | 59 | 113 | 324 |
| Stock -ve Days | 10 | 22 | 34 | 75 | 126 | 364 |
[1] Upside and downside betas calculated using positive and negative benchmark daily returns respectively
Based On 1-Year Data
| Annualized Return | Annualized Volatility | Sharpe Ratio | Correlation with LMT | |
|---|---|---|---|---|
| LMT | 9.7% | 28.3% | 0.31 | - |
| Sector ETF (XLI) | 13.0% | 17.2% | 0.54 | 28.2% |
| Equity (SPY) | 17.7% | 13.0% | 0.98 | 1.2% |
| Gold (GLD) | 14.7% | 29.3% | 0.46 | 5.5% |
| Commodities (DBC) | 44.3% | 20.7% | 1.66 | 8.4% |
| Real Estate (VNQ) | 4.5% | 13.6% | 0.07 | 14.3% |
| Bitcoin (BTCUSD) | -25.9% | 44.8% | -0.54 | 0.3% |
Smart multi-asset allocation framework can stack odds in your favor. Learn How
Based On 5-Year Data
| Annualized Return | Annualized Volatility | Sharpe Ratio | Correlation with LMT | |
|---|---|---|---|---|
| LMT | 11.7% | 24.0% | 0.43 | - |
| Sector ETF (XLI) | 12.9% | 17.6% | 0.56 | 31.5% |
| Equity (SPY) | 13.3% | 17.2% | 0.59 | 15.4% |
| Gold (GLD) | 19.2% | 18.8% | 0.83 | 9.5% |
| Commodities (DBC) | 10.8% | 19.6% | 0.43 | 13.1% |
| Real Estate (VNQ) | 0.9% | 18.9% | -0.06 | 20.3% |
| Bitcoin (BTCUSD) | 12.2% | 52.6% | 0.41 | 4.2% |
Smart multi-asset allocation framework can stack odds in your favor. Learn How
Based On 10-Year Data
| Annualized Return | Annualized Volatility | Sharpe Ratio | Correlation with LMT | |
|---|---|---|---|---|
| LMT | 11.0% | 24.3% | 0.43 | - |
| Sector ETF (XLI) | 13.4% | 20.0% | 0.59 | 52.7% |
| Equity (SPY) | 15.5% | 17.9% | 0.73 | 40.3% |
| Gold (GLD) | 12.1% | 16.4% | 0.61 | 7.3% |
| Commodities (DBC) | 8.5% | 18.1% | 0.38 | 17.9% |
| Real Estate (VNQ) | 4.8% | 20.7% | 0.19 | 38.3% |
| Bitcoin (BTCUSD) | 63.8% | 66.2% | 1.03 | 8.2% |
Smart multi-asset allocation framework can stack odds in your favor. Learn How
Returns Analyses
Earnings Returns History
Updated 8/28/2026| Forward Returns | |||
|---|---|---|---|
| Earnings Date | 1D Returns | 5D Returns | 21D Returns |
| 7/23/2026 | 10.5% | 10.7% | 11.1% |
| 4/23/2026 | -4.6% | -8.2% | -5.9% |
| 1/29/2026 | 4.2% | 0.9% | 10.2% |
| 10/21/2025 | -3.2% | -3.8% | -6.2% |
| 7/22/2025 | -10.8% | -8.5% | -4.2% |
| 4/22/2025 | 0.8% | 3.9% | 3.8% |
| 1/28/2025 | -9.2% | -9.6% | -12.3% |
| 10/22/2024 | -6.1% | -9.7% | -13.2% |
| ... | |||
| SUMMARY STATS | |||
| # Positive | 10 | 9 | 10 |
| # Negative | 14 | 15 | 14 |
| Median Positive | 3.1% | 4.2% | 6.4% |
| Median Negative | -3.5% | -5.3% | -6.0% |
| Max Positive | 10.5% | 15.1% | 17.6% |
| Max Negative | -11.8% | -12.1% | -13.2% |
| Forward Returns | |||
|---|---|---|---|
| Earnings Date | 1D Returns | 5D Returns | 21D Returns |
| 7/23/2026 | 10.5% | 10.7% | 11.1% |
| 4/23/2026 | -4.6% | -8.2% | -5.9% |
| 1/29/2026 | 4.2% | 0.9% | 10.2% |
| 10/21/2025 | -3.2% | -3.8% | -6.2% |
| 7/22/2025 | -10.8% | -8.5% | -4.2% |
| 4/22/2025 | 0.8% | 3.9% | 3.8% |
| 1/28/2025 | -9.2% | -9.6% | -12.3% |
| 10/22/2024 | -6.1% | -9.7% | -13.2% |
| 7/23/2024 | 5.6% | 11.2% | 17.4% |
| 4/23/2024 | -0.3% | 1.3% | 1.5% |
| 1/23/2024 | -4.2% | -6.7% | -6.8% |
| 10/17/2023 | 0.2% | 1.3% | 0.9% |
| 7/18/2023 | -3.0% | -2.8% | -5.6% |
| 4/18/2023 | 2.4% | -1.8% | -8.6% |
| 1/24/2023 | 1.8% | 4.4% | 8.7% |
| 10/18/2022 | 8.7% | 15.1% | 17.6% |
| 6/27/2022 | 0.3% | -1.0% | -4.9% |
| 4/19/2022 | -1.6% | -5.3% | -5.7% |
| 1/25/2022 | 3.7% | 4.2% | 4.2% |
| 10/26/2021 | -11.8% | -12.1% | -8.3% |
| 7/26/2021 | -3.3% | -2.4% | -6.2% |
| 4/20/2021 | -1.1% | -5.0% | -1.2% |
| 1/26/2021 | -3.7% | -5.7% | 0.9% |
| 10/20/2020 | -3.0% | -4.0% | -2.0% |
| SUMMARY STATS | |||
| # Positive | 10 | 9 | 10 |
| # Negative | 14 | 15 | 14 |
| Median Positive | 3.1% | 4.2% | 6.4% |
| Median Negative | -3.5% | -5.3% | -6.0% |
| Max Positive | 10.5% | 15.1% | 17.6% |
| Max Negative | -11.8% | -12.1% | -13.2% |
SEC Filings
Expand for More| Report Date | Filing Date | Filing |
|---|---|---|
| 06/30/2026 | 07/23/2026 | 10-Q |
| 03/31/2026 | 04/23/2026 | 10-Q |
| 12/31/2025 | 01/29/2026 | 10-K |
| 09/30/2025 | 10/21/2025 | 10-Q |
| 06/30/2025 | 07/22/2025 | 10-Q |
| 03/31/2025 | 04/22/2025 | 10-Q |
| 12/31/2024 | 01/28/2025 | 10-K |
| 09/30/2024 | 10/22/2024 | 10-Q |
| 06/30/2024 | 07/23/2024 | 10-Q |
| 03/31/2024 | 04/23/2024 | 10-Q |
| 12/31/2023 | 01/23/2024 | 10-K |
| 09/30/2023 | 10/17/2023 | 10-Q |
| 06/30/2023 | 07/19/2023 | 10-Q |
| 03/31/2023 | 04/18/2023 | 10-Q |
| 12/31/2022 | 01/26/2023 | 10-K |
| 09/30/2022 | 10/18/2022 | 10-Q |
| Report Date | Filing Date | Filing |
|---|---|---|
| 06/30/2026 | 07/23/2026 | 10-Q |
| 03/31/2026 | 04/23/2026 | 10-Q |
| 12/31/2025 | 01/29/2026 | 10-K |
| 09/30/2025 | 10/21/2025 | 10-Q |
| 06/30/2025 | 07/22/2025 | 10-Q |
| 03/31/2025 | 04/22/2025 | 10-Q |
| 12/31/2024 | 01/28/2025 | 10-K |
| 09/30/2024 | 10/22/2024 | 10-Q |
| 06/30/2024 | 07/23/2024 | 10-Q |
| 03/31/2024 | 04/23/2024 | 10-Q |
| 12/31/2023 | 01/23/2024 | 10-K |
| 09/30/2023 | 10/17/2023 | 10-Q |
| 06/30/2023 | 07/19/2023 | 10-Q |
| 03/31/2023 | 04/18/2023 | 10-Q |
| 12/31/2022 | 01/26/2023 | 10-K |
| 09/30/2022 | 10/18/2022 | 10-Q |
| 06/30/2022 | 07/19/2022 | 10-Q |
| 03/31/2022 | 04/20/2022 | 10-Q |
| 12/31/2021 | 01/25/2022 | 10-K |
| 09/30/2021 | 10/26/2021 | 10-Q |
| 06/30/2021 | 07/26/2021 | 10-Q |
| 03/31/2021 | 04/21/2021 | 10-Q |
| 12/31/2020 | 01/28/2021 | 10-K |
| 09/30/2020 | 10/22/2020 | 10-Q |
| 06/30/2020 | 07/21/2020 | 10-Q |
| 03/31/2020 | 04/22/2020 | 10-Q |
| 12/31/2019 | 02/07/2020 | 10-K |
| 09/30/2019 | 10/25/2019 | 10-Q |
Recent Forward Guidance
Updated 7/24/2026Latest: Q2 2026 Earnings Reported 7/23/2026
| Forward Guidance | Guidance Change | |||||||
|---|---|---|---|---|---|---|---|---|
| Metric | Source | Low | Mid | High | % Chg | % Delta | Change | Prior |
| 2026 Business segment operating profit | Reported | 8.50 Bil | 8.60 Bil | 8.70 Bil | 0.6% | Raised | Guidance: 8.55 Bil for 2026 | |
| 2026 Cash from operations | Reported | 9.20 Bil | 9.30 Bil | 9.40 Bil | 0 | Affirmed | Guidance: 9.30 Bil for 2026 | |
| 2026 Sales | Reported | 79.75 Bil | 80.75 Bil | 81.75 Bil | 2.5% | Raised | Guidance: 78.75 Bil for 2026 | |
| 2026 Diluted earnings per share | Reported | 29.9 | 30.3 | 30.6 | 1.7% | Raised | Guidance: 29.8 for 2026 | |
| 2026 Capital expenditures | Reported | 2.00 Bil | 2.20 Bil | 2.40 Bil | -17.0% | Lowered | Guidance: 2.65 Bil for 2026 | |
| 2026 Free cash flow | Reported | 7.00 Bil | 7.10 Bil | 7.20 Bil | 6.8% | Raised | Guidance: 6.65 Bil for 2026 | |
Prior: Q1 2026 Earnings Reported 4/23/2026
| Forward Guidance | Guidance Change | |||||||
|---|---|---|---|---|---|---|---|---|
| Metric | Source | Low | Mid | High | % Chg | % Delta | Change | Prior |
| 2026 Operating Profit Growth | Reported | 25.0% | 0 | Affirmed | Guidance: 25.0% for 2026 | |||
| 2026 Business segment operating profit | Reported | 8.43 Bil | 8.55 Bil | 8.68 Bil | 0 | Affirmed | Guidance: 8.55 Bil for 2026 | |
| 2026 Cash from operations | Reported | 9.15 Bil | 9.30 Bil | 9.45 Bil | 0 | Affirmed | Guidance: 9.30 Bil for 2026 | |
| 2026 Revenue Growth | Reported | 5.0% | 0 | Affirmed | Guidance: 5.0% for 2026 | |||
| 2026 Sales | Reported | 77.50 Bil | 78.75 Bil | 80.00 Bil | 0 | Affirmed | Guidance: 78.75 Bil for 2026 | |
| 2026 Diluted earnings per share | Reported | 29.4 | 29.8 | 30.2 | 0 | Affirmed | Guidance: 29.8 for 2026 | |
| 2026 Capital expenditures | Reported | 2.50 Bil | 2.65 Bil | 2.80 Bil | 0 | Affirmed | Guidance: 2.65 Bil for 2026 | |
| 2026 Free cash flow | Reported | 6.50 Bil | 6.65 Bil | 6.80 Bil | 0 | Affirmed | Guidance: 6.65 Bil for 2026 | |
Q4 2025 Earnings Reported 1/29/2026
| Forward Guidance | Guidance Change | |||||||
|---|---|---|---|---|---|---|---|---|
| Metric | Source | Low | Mid | High | % Chg | % Delta | Change | Prior |
| 2026 Business segment operating profit | Reported | 8.43 Bil | 8.55 Bil | 8.68 Bil | 27.6% | Higher New | Guidance: 6.70 Bil for 2025 | |
| 2026 Segment operating profit growth | Reported | 25.0% | ||||||
| 2026 Cash from operations | Reported | 9.15 Bil | 9.30 Bil | 9.45 Bil | 9.4% | Higher New | Guidance: 8.50 Bil for 2025 | |
| 2026 Sales | Reported | 77.50 Bil | 78.75 Bil | 80.00 Bil | 5.7% | Higher New | Guidance: 74.50 Bil for 2025 | |
| 2026 Sales Growth | Reported | 5.0% | ||||||
| 2026 Diluted earnings per share | Reported | 29.4 | 29.8 | 30.2 | 33.9% | Higher New | Guidance: 22.2 for 2025 | |
| 2026 Capital expenditures | Reported | 2.50 Bil | 2.65 Bil | 2.80 Bil | 39.5% | Higher New | Guidance: 1.90 Bil for 2025 | |
| 2026 Free cash flow | Reported | 6.50 Bil | 6.65 Bil | 6.80 Bil | 0.8% | Higher New | Guidance: 6.60 Bil for 2025 | |
Q3 2025 Earnings Reported 10/21/2025
| Forward Guidance | Guidance Change | |||||||
|---|---|---|---|---|---|---|---|---|
| Metric | Source | Low | Mid | High | % Chg | % Delta | Change | Prior |
| 2025 Business segment operating profit | Reported | 6.67 Bil | 6.70 Bil | 6.72 Bil | 0.8% | Raised | Guidance: 6.65 Bil for 2025 | |
| 2025 Cash from operations | Reported | 8.50 Bil | -1.2% | Lowered | Guidance: 8.60 Bil for 2025 | |||
| 2025 Sales | Reported | 74.25 Bil | 74.50 Bil | 74.75 Bil | 0.3% | Raised | Guidance: 74.25 Bil for 2025 | |
| 2025 Diluted earnings per share | Reported | 22.1 | 22.2 | 22.4 | 1.8% | Raised | Guidance: 21.9 for 2025 | |
| 2025 Capital expenditures | Reported | 1.90 Bil | 0 | Affirmed | Guidance: 1.90 Bil for 2025 | |||
| 2025 Free cash flow | Reported | 6.60 Bil | -1.5% | Lowered | Guidance: 6.70 Bil for 2025 | |||
Insider Activity
Updated 8/13/2026| # | Owner | Title | Holding | Action | Filing Date | Price | Shares | Transacted Value | Value of Held Shares | Form |
|---|---|---|---|---|---|---|---|---|---|---|
| 1 | Lightfoot, Robert M JR | President Space | Direct | Sell | 8132026 | 600.12 | 196 | 117,623 | 1,209,150 | Form |
| 2 | Lightfoot, Robert M JR | President Space | Direct | Sell | 8132026 | 0.00 | 2,410 | Form | ||
| 3 | Cahill, Timothy S | Pres. Missiles & Fire Control | Direct | Sell | 3132026 | 0.00 | 4,620 | Form | ||
| 4 | Ulmer, Gregory M | President Aeronautics | Direct | Sell | 2272026 | 0.00 | 2,840 | Form | ||
| 5 | Hill, Stephanie C | Pres. Rotary & Mission Systems | Direct | Sell | 2242026 | 2.76 | 2,410 | 6,660 | 25,791 | Form |
| # | Owner | Title | Holding | Action | Filing Date | Price | Shares | Transacted Value | Value of Held Shares | Form |
|---|---|---|---|---|---|---|---|---|---|---|
| 1 | Lightfoot, Robert M JR | President Space | Direct | Sell | 8132026 | 600.12 | 196 | 117,623 | 1,209,150 | Form |
| 2 | Lightfoot, Robert M JR | President Space | Direct | Sell | 8132026 | 0.00 | 2,410 | Form | ||
| 3 | Cahill, Timothy S | Pres. Missiles & Fire Control | Direct | Sell | 3132026 | 0.00 | 4,620 | Form | ||
| 4 | Ulmer, Gregory M | President Aeronautics | Direct | Sell | 2272026 | 0.00 | 2,840 | Form | ||
| 5 | Hill, Stephanie C | Pres. Rotary & Mission Systems | Direct | Sell | 2242026 | 2.76 | 2,410 | 6,660 | 25,791 | Form |
| 6 | St, John Frank A | Chief Operating Officer | Direct | Sell | 10272025 | 491.04 | 7,792 | 3,826,166 | 256 | Form |
Investor Activity (13F)
Updated Sep 27, 2026Active managers (13F portfolio over $250M, at least 3 holdings) with a position over $5M that is either over 10% of their portfolio or held in a concentrated book of 50 or fewer total positions. Index/ETF, sovereign, bank, community-bank and charitable/donor-advised filers are excluded.
| Active Manager | Value | % of Portfolio | Total Positions | QoQ | Filing |
|---|---|---|---|---|---|
| Spectrum Financial Alliance Ltd LLC | $63.1 Mil | 12.1% | 32 | ADD +5.4% | 13F |
| Minneapolis Portfolio Management Group, LLC | $39.4 Mil | 4.2% | 33 | Hold | 13F |
| Westchester Capital Management, Inc. | $19.5 Mil | 3.9% | 45 | Hold | 13F |
| Sunriver Management LLC | $21.9 Mil | 3.7% | 18 | TRIM -72.0% | 13F |
| Focused Investors LLC | $98.5 Mil | 3.2% | 22 | Hold | 13F |
| Monolith Management Ltd | $8.0 Mil | 3.1% | 31 | New | 13F |
| Albar Capital Partners LLP | $16.7 Mil | 2.7% | 36 | New | 13F |
| Element Capital Management LLC | $6.0 Mil | 2.4% | 34 | New | 13F |
| Archon Partners LLC | $15.1 Mil | 1.8% | 39 | TRIM -28.6% | 13F |
| Cartenna Capital, LP | $39.3 Mil | 1.7% | 41 | New | 13F |
| Sanders Capital, LLC | $689.6 Mil | 0.8% | 44 | Hold | 13F |
| Hancock Prospecting Pty Ltd | $23.6 Mil | 0.7% | 36 | New | 13F |
| Active Manager | Value | % of Portfolio | Total Positions | QoQ | Filing |
|---|---|---|---|---|---|
| Cartenna Capital, LP | $39.3 Mil | 1.7% | 41 | New | 13F |
| Hancock Prospecting Pty Ltd | $23.6 Mil | 0.7% | 36 | New | 13F |
| Albar Capital Partners LLP | $16.7 Mil | 2.7% | 36 | New | 13F |
| Monolith Management Ltd | $8.0 Mil | 3.1% | 31 | New | 13F |
| Element Capital Management LLC | $6.0 Mil | 2.4% | 34 | New | 13F |
| Spectrum Financial Alliance Ltd LLC | $63.1 Mil | 12.1% | 32 | ADD +5.4% | 13F |
| Active Manager | Value | % of Portfolio | Total Positions | QoQ | As Of | Filing |
|---|---|---|---|---|---|---|
| Powszechne Towarzystwo Emerytalne Allianz Polska S.A. | $9.7 Mil | 3.1% | 11 | Exited | Dec 31, 2025 | 13F |
| Hi-Line Capital Management, LLC | $6.8 Mil | 2.3% | 37 | Exited | Dec 31, 2025 | 13F |
| Sunriver Management LLC | $21.9 Mil | 3.7% | 18 | TRIM -72.0% | Mar 31, 2026 | 13F |
| Archon Partners LLC | $15.1 Mil | 1.8% | 39 | TRIM -28.6% | Mar 31, 2026 | 13F |
| Active Manager | Value | % of Portfolio | Total Positions | QoQ | Filing |
|---|---|---|---|---|---|
| Sanders Capital, LLC | $689.6 Mil | 0.8% | 44 | Hold | 13F |
| Focused Investors LLC | $98.5 Mil | 3.2% | 22 | Hold | 13F |
| Spectrum Financial Alliance Ltd LLC | $63.1 Mil | 12.1% | 32 | ADD +5.4% | 13F |
| Minneapolis Portfolio Management Group, LLC | $39.4 Mil | 4.2% | 33 | Hold | 13F |
| Cartenna Capital, LP | $39.3 Mil | 1.7% | 41 | New | 13F |
| Hancock Prospecting Pty Ltd | $23.6 Mil | 0.7% | 36 | New | 13F |
| Sunriver Management LLC | $21.9 Mil | 3.7% | 18 | TRIM -72.0% | 13F |
| Westchester Capital Management, Inc. | $19.5 Mil | 3.9% | 45 | Hold | 13F |
| Albar Capital Partners LLP | $16.7 Mil | 2.7% | 36 | New | 13F |
| Archon Partners LLC | $15.1 Mil | 1.8% | 39 | TRIM -28.6% | 13F |
| Monolith Management Ltd | $8.0 Mil | 3.1% | 31 | New | 13F |
| Element Capital Management LLC | $6.0 Mil | 2.4% | 34 | New | 13F |
LMT Trade Sentinel
Constructive
CONVICTION RATIONALE
A record $230 billion backlog provides exceptional multi-year revenue visibility. Growth is accelerating, with latest-quarter sales up 10.5% and full-year guidance raised across all key metrics. While execution on certain development programs remains a risk, the sheer scale of the production ramp-up for in-demand systems is now the primary value driver.
STOCK ARCHETYPE
Project-Based / Backlog-DrivenBacklog Conversion Rate + Value of New Contract Awards Program mix (mature production vs. new development) and execution performance against cost estimates on fixed-price contracts.
INVESTMENT THESIS
Evidence suggests yes. A record $230 billion backlog is converting into accelerating growth, with new multi-year contracts de-risking the outlook and driving higher full-year guidance.
- Backlog reached a new all-time high of $230 billion.
- The book-to-bill ratio for the second quarter was 3.2:1.
- Latest-quarter revenue growth accelerated to 10.5% year-over-year from the prior quarter.
- Full-year 2026 guidance was raised for sales, operating profit, EPS, and free cash flow.
- A 7-year, $35 billion contract was awarded to quadruple production of THAAD interceptors.
PRIMARY RISK
A history of material 'reach-forward losses' on complex development programs, including a $950 million loss on a classified program in 2025, could recur. This would erode margins and undermine confidence in management's ability to execute on its growing backlog.
- Recognized a $950 million loss on a classified Aeronautics program in 2025.
- Recognized a $570 million loss on the Canadian Maritime Helicopter Program in 2025.
- Aeronautics' operating margin was 6.9% in 2025, impacted by program losses.
- Management has stated additional losses may be needed on a classified program.
- The stock reacted -8.0% to a prior earnings report that highlighted execution issues.
| KPI | Status | Rationale |
|---|---|---|
| Backlog | $230 billion as of June 28, 2026 - Accelerating | Backlog reached a new all-time high, driven by historic multi-year awards, including a multi-year contract to produce THAAD interceptors and a $35 billion contract for FAD interceptors. This provides unprecedented visibility into future revenue. |
| Revenue Growth | 10.5% year-over-year for the quarter ended June 30, 2026 - Accelerating | Growth accelerated sharply in the latest quarter, benefiting from both strong execution on ramping programs and an easier comparison against the prior year, which included unfavorable adjustments. Management raised its full-year outlook, projecting second-half growth in the high-single to low-double digits. |
| Book-to-Bill Ratio | 3.2:1 (Q2 2026) | Measures the ratio of new orders received to revenue recognized during a period. A ratio significantly above 1 indicates strong demand and future revenue growth, as the backlog is expanding rapidly. |
Backlog Boom vs. Execution Bust
BULL VIEW
The $230 billion backlog and 3.2:1 book-to-bill ratio signal a durable upcycle. Accelerating production of proven systems like PAC-3 and THAAD will drive profitable growth, overwhelming any isolated program issues.
CORE TENSION
Can the record $230B backlog, which drove a +13% stock reaction, overwhelm the risk of new program losses, which previously caused an -8% stock drop?
PREVAILING SENTIMENT
The latest evidence favors the bulls. The company raised 2026 guidance for sales, profit, and cash flow, suggesting the new backlog is profitable and the growth is accelerating.
BEAR VIEW
The accelerating top line masks poor execution. Recurring losses on fixed-price programs, like the $950 million charge in 2025, will continue to surface, proving that margin risk is uncontained and will cap profitability.
| Timeline | Event & Metric To Watch |
|---|---|
10/19/2026 | New Program Losses Watch: Announcement of any new or increased 'reach-forward loss' on a major program, particularly in the Aeronautics or RMS segments. |
10/19/2026 | Production and Supply Chain Issues Watch: Commentary on F-16 or C-130 delivery rates, supplier constraints, or new profit adjustments on these specific production programs. |
10/19/2026 - 10/22/2026 | Peer Read-Across Watch: Negative commentary from peers on supply chain, inflation, or government payment cycles that could also affect LMT. |
10/19/2026 | Next Earnings Report Watch: Lockheed Martin is scheduled to report its next quarterly earnings. |
10/22/2026 | Peer GD Earnings Watch: Peer General Dynamics (GD) is scheduled to report earnings. |
No set date | Securities Litigation Development Watch: Court filings or news related to the case, such as a ruling on a motion to dismiss or progress toward settlement. |
| Date | Event | Stock Impact |
|---|---|---|
2026-08-10 | NGI Program Milestone Achieved Details: The company announced the Stage 2 rocket motor for the Next Generation Interceptor (NGI) program successfully completed a static fire test, a significant milestone on the path to Critical Design Review. | +1.7% $584.34 -> $594.10 |
2026-07-23 | Q2 Earnings Beat and Guidance Raise Details: Full-year 2026 guidance was raised for sales, operating profit, EPS, and free cash flow. | +13.3% $511.20 -> $579.02 |
2026-06-24 | THAAD Production Contract Awarded Details: The U.S. government awarded a seven-year undefinitized contract action (UCA) for up to $35 billion to quadruple production of Terminal High Altitude Area Defense (THAAD) interceptors. | +0.3% $500.57 -> $501.92 |
2026-04-23 | Q1 Earnings Miss and Negative Reaction Details: The company reported Q1 2026 results with EPS down 12% year-over-year and negative free cash flow of $(291) million, though it reaffirmed full-year guidance. The stock had a two-day reaction of -8.0%. | -7.6% $548.43 -> $506.97 |
2026-03-25 | Precision Strike Missile Production Accelerated Details: The company and the Department of War announced a framework agreement to accelerate production of the Precision Strike Missile (PrSM). | +2.8% $602.48 -> $619.42 |
Position Sizing
5% - 7%
NORMAL POSITION
Sizing is volatility-based: LMT trades at roughly 26% annualized options-implied volatility versus about 13% for the S&P 500 (2.0x the market), around the 47th percentile of its own trailing year. A 5% - 7% position keeps a single-name swing of that size within a diversified portfolio's risk budget.
Diversification Alternatives
RTX - RTX
Scale and Margin LeaderOffers greater scale with revenue 1.2 times that of Lockheed Martin and significantly higher gross margins at 20.3%, suggesting a potential cost advantage in high-volume production.
NOC - Northrop Grumman
Focused Strategic ExposureProvides focused exposure to strategic deterrence and space systems. Northrop Grumman also reports a higher gross margin of 20.1%, indicating a different contract mix and cost structure.
LMT is a prime contractor for an era of renewed great power competition, converting unprecedented demand for its combat-proven systems into a massive, multi-year backlog that underpins accelerating growth.
The company is capitalizing on a surge in global defense spending by ramping up production of its most critical systems, particularly in missile defense. New multi-year framework agreements with the U.S. government are de-risking this production ramp, providing long-term visibility and better economics. This is translating into a record backlog, accelerating revenue growth, and expanding margins, positioning the company for sustained performance.
Announcement of additional multi-year framework agreements for other key programs, successful flight tests of next-generation systems like hypersonics or NGI, and continued backlog growth.
Significant cuts to U.S. or allied defense budgets, major new reach-forward losses on key development programs, or the loss of a major competitive contract.
Minor contract awards or delays, quarterly stock price fluctuations unrelated to fundamental business performance.
Repricing Catalyst
The market recognizing the magnitude and profitability of the record $230 billion backlog and the accelerating revenue growth trajectory confirmed by the company's raised 2026 guidance.
Aeronautics
$31.2B TTM (41% of Total) · 9% MarginWhat It Is
Researches, designs, manufactures, and supports advanced military aircraft, including combat and air mobility aircraft like the F-35 Lightning II, C-130 Hercules, F-16 Fighting Falcon, and F-22 Raptor, primarily for the U.S. Government and allied nations.
Who Pays & How
The U.S. Government and allied nations pay for these aircraft to maintain air superiority and mobility. The F-35 is the only in-production fifth-generation stealth fighter in the free world, making it critical for modern defense postures.
Competition
Missiles and Fire Control (MFC)
$16.4B TTM (21% of Total) · 13% MarginWhat It Is
Provides air and missile defense systems (PAC-3, THAAD), tactical missiles and precision strike weapons (JASSM, LRASM, Hellfire, PrSM), and fire control systems for U.S. and international military customers.
Who Pays & How
The U.S. Government and allied nations (17 nations for PAC-3) purchase these systems to defend against ballistic, cruise, and hypersonic missile threats and to conduct precision strikes. Recent global conflicts have heightened demand for these capabilities.
Competition
Rotary and Mission Systems (RMS)
$19.8B TTM (26% of Total) · 9% MarginWhat It Is
Designs and manufactures military and commercial helicopters (Black Hawk, Seahawk, CH-53K), surface ships, sea and land-based missile defense systems (Aegis Combat System), radar systems, and cyber solutions for U.S. and international customers.
Who Pays & How
Naval and army branches of the U.S. and allied governments pay for these systems to conduct maritime operations, transport troops and equipment, and defend against various threats. The Aegis system is a cornerstone of naval missile defense for the U.S. and allies like Japan and Australia.
Competition
Space
$13.8B TTM (18% of Total) · 9% MarginWhat It Is
Develops and produces satellites, space transportation systems (Orion), and strategic and defensive missile systems (Trident II FBM, Next Generation Interceptor). Customers are primarily U.S. government agencies, including the Department of War and NASA.
Who Pays & How
U.S. government agencies pay for these systems for strategic deterrence (Trident FBM), national security surveillance (Next Gen OPIR), missile defense (NGI), and human space exploration (Orion).
Competition
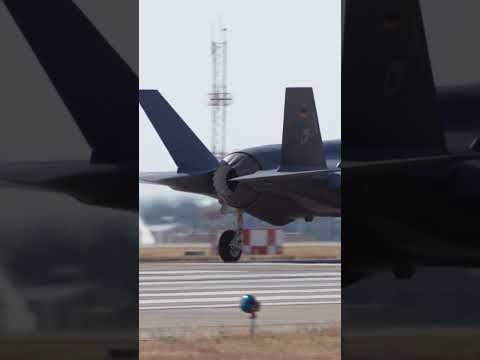
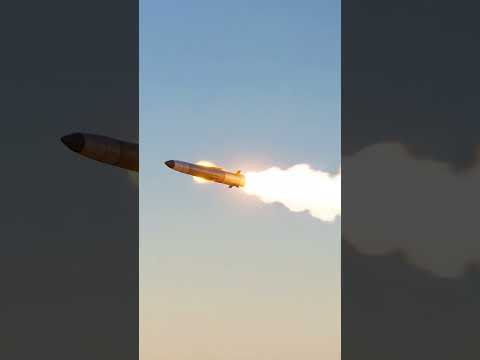
Lockheed Martin — Investor Video Playlist





Industry Resources
| Industrials Resources |
| IndustryWeek |
| Manufacturing.net |
| Aviation Week |
| Aerospace & Defense Resources |
| Defense News |
| FlightGlobal |
External Quote Links
| Y Finance | Barrons |
| TradingView | Morningstar |
| SeekingAlpha | ValueLine |
| Motley Fool | Robinhood |
| CNBC | Etrade |
| MarketWatch | Unusual Whales |
| YCharts | Perplexity Finance |
| FinViz |
Prefer one of these to Trefis? Tell us why.