
Caterpillar (CAT)
Market Price (9/9/2026): $822.5 | Market Cap: $378.7 BilInvestor Relations Sector: Industrials | Industry: Construction Machinery & Heavy Transportation Equipment
Caterpillar (CAT)
Market Price (9/9/2026): $822.5Market Cap: $378.7 BilSector: IndustrialsIndustry: Construction Machinery & Heavy Transportation Equipment
Investment Highlights Why It Matters Detailed financial logic regarding cash flow yields vs trend-riding momentum.
Strong revenue growthRev Chg LTMRevenue Change % Last Twelve Months (LTM) is 18% Attractive cash flow generationCFO/Rev LTMCash Flow from Operations / Revenue (Sales), Last Twelve Months (LTM) is 18%, FCF/Rev LTMFree Cash Flow / Revenue (Sales), Last Twelve Months (LTM) is 12%, CFO LTM is 14 Bil, FCF LTM is 9.0 Bil Stock buyback supportStock Buyback 3Y Total is 23 Bil Low stock price volatilityVol 12M is 40% Megatrend and thematic driversMegatrends include Automation & Robotics, Future of Freight, Sustainable Infrastructure, Hydrogen Economy, Show more. | Key risksCAT key risks include [1] a high vulnerability to cyclical downturns and shifts in U.S. Show more. |
| Strong revenue growthRev Chg LTMRevenue Change % Last Twelve Months (LTM) is 18% |
| Attractive cash flow generationCFO/Rev LTMCash Flow from Operations / Revenue (Sales), Last Twelve Months (LTM) is 18%, FCF/Rev LTMFree Cash Flow / Revenue (Sales), Last Twelve Months (LTM) is 12%, CFO LTM is 14 Bil, FCF LTM is 9.0 Bil |
| Stock buyback supportStock Buyback 3Y Total is 23 Bil |
| Low stock price volatilityVol 12M is 40% |
| Megatrend and thematic driversMegatrends include Automation & Robotics, Future of Freight, Sustainable Infrastructure, Hydrogen Economy, Show more. |
| Key risksCAT key risks include [1] a high vulnerability to cyclical downturns and shifts in U.S. Show more. |
Qualitative Assessment
AI Analysis | Feedback
Caterpillar (CAT) stock has lost about 5% since 5/31/2026 because of the following key factors:
1. Significant Stock Decline in Fiscal Q2 2026.
Despite a strong underlying business, Caterpillar's stock experienced a significant net decline of 23.48% during fiscal Q2 2026, which ended in June 2026. This substantial monthly decrease suggests that earlier in the period, the stock faced considerable selling pressure, establishing a lower trading range prior to the Q2 earnings announcement in August.
2. Insider Selling by CEO.
On August 28, 2026, CEO Joseph E. Creed sold 32,401 shares of Caterpillar common stock in open-market transactions totaling approximately $26.2 million. This significant insider selling event contributed to a 2.4% drop in the stock price on September 1, 2026.
Show more
Caterpillar (CAT) stock has lost about 5% since 5/31/2026 because of the following key factors:
1. Significant Stock Decline in Fiscal Q2 2026.
Despite a strong underlying business, Caterpillar's stock experienced a significant net decline of 23.48% during fiscal Q2 2026, which ended in June 2026. This substantial monthly decrease suggests that earlier in the period, the stock faced considerable selling pressure, establishing a lower trading range prior to the Q2 earnings announcement in August.
2. Insider Selling by CEO.
On August 28, 2026, CEO Joseph E. Creed sold 32,401 shares of Caterpillar common stock in open-market transactions totaling approximately $26.2 million. This significant insider selling event contributed to a 2.4% drop in the stock price on September 1, 2026.
3. Persistent High Input Costs and Tariffs.
The heavy machinery industry, including Caterpillar, continues to face upward pressure on input costs due to factors such as a 50% tariff on steel and aluminum. These elevated costs weigh on manufacturing expenses and overall competitiveness, potentially impacting investor sentiment despite strong sales volumes.
4. Softening Demand in Key Agricultural and International Markets.
While Caterpillar's construction segment has shown strength, particularly in North America, other parts of the heavy equipment market are experiencing headwinds. The agricultural sector faces challenges from low commodity prices, high input costs, and an uncertain trade environment, leading to delayed equipment investments. Additionally, some international markets, such as Europe, the Middle East, and Latin America, saw softening or declining sales for other machinery manufacturers in fiscal Q2 2026, reflecting broader global economic uncertainty that could impact Caterpillar's diverse operations.
Show less
Stock Movement Drivers
Fundamental Drivers
The -5.9% change in CAT stock from 5/31/2026 to 9/8/2026 was primarily driven by a -18.7% change in the company's P/E Multiple.| (LTM values as of) | 5312026 | 9082026 | Change |
|---|---|---|---|
| Stock Price ($) | 874.25 | 822.48 | -5.9% |
| Change Contribution By: | |||
| Total Revenues ($ Mil) | 70,755 | 74,729 | 5.6% |
| Net Income Margin (%) | 13.3% | 14.5% | 8.9% |
| P/E Multiple | 43.0 | 34.9 | -18.7% |
| Shares Outstanding (Mil) | 463 | 460 | 0.7% |
| Cumulative Contribution | -5.9% |
Market Drivers
5/31/2026 to 9/8/2026| Return | Correlation | |
|---|---|---|
| CAT | -5.9% | |
| Market (SPY) | 1.3% | 56.8% |
| Sector (XLI) | 0.7% | 78.6% |
Fundamental Drivers
The 11.1% change in CAT stock from 2/28/2026 to 9/8/2026 was primarily driven by a 10.6% change in the company's Total Revenues ($ Mil).| (LTM values as of) | 2282026 | 9082026 | Change |
|---|---|---|---|
| Stock Price ($) | 740.05 | 822.48 | 11.1% |
| Change Contribution By: | |||
| Total Revenues ($ Mil) | 67,589 | 74,729 | 10.6% |
| Net Income Margin (%) | 13.1% | 14.5% | 10.4% |
| P/E Multiple | 38.8 | 34.9 | -10.1% |
| Shares Outstanding (Mil) | 466 | 460 | 1.2% |
| Cumulative Contribution | 11.1% |
Market Drivers
2/28/2026 to 9/8/2026| Return | Correlation | |
|---|---|---|
| CAT | 11.1% | |
| Market (SPY) | 12.0% | 60.2% |
| Sector (XLI) | -1.3% | 81.6% |
Fundamental Drivers
The 98.0% change in CAT stock from 8/31/2025 to 9/8/2026 was primarily driven by a 68.9% change in the company's P/E Multiple.| (LTM values as of) | 8312025 | 9082026 | Change |
|---|---|---|---|
| Stock Price ($) | 415.30 | 822.48 | 98.0% |
| Change Contribution By: | |||
| Total Revenues ($ Mil) | 63,139 | 74,729 | 18.4% |
| Net Income Margin (%) | 14.9% | 14.5% | -2.9% |
| P/E Multiple | 20.7 | 34.9 | 68.9% |
| Shares Outstanding (Mil) | 470 | 460 | 2.0% |
| Cumulative Contribution | 98.0% |
Market Drivers
8/31/2025 to 9/8/2026| Return | Correlation | |
|---|---|---|
| CAT | 98.0% | |
| Market (SPY) | 19.8% | 56.0% |
| Sector (XLI) | 15.9% | 76.1% |
Fundamental Drivers
The 205.2% change in CAT stock from 8/31/2023 to 9/8/2026 was primarily driven by a 111.2% change in the company's P/E Multiple.| (LTM values as of) | 8312023 | 9082026 | Change |
|---|---|---|---|
| Stock Price ($) | 269.53 | 822.48 | 205.2% |
| Change Contribution By: | |||
| Total Revenues ($ Mil) | 64,771 | 74,729 | 15.4% |
| Net Income Margin (%) | 12.9% | 14.5% | 12.4% |
| P/E Multiple | 16.5 | 34.9 | 111.2% |
| Shares Outstanding (Mil) | 513 | 460 | 11.4% |
| Cumulative Contribution | 205.2% |
Market Drivers
8/31/2023 to 9/8/2026| Return | Correlation | |
|---|---|---|
| CAT | 205.2% | |
| Market (SPY) | 76.1% | 60.8% |
| Sector (XLI) | 67.9% | 76.0% |
Price Returns Compared
| 2021 | 2022 | 2023 | 2024 | 2025 | 2026 | Total [1] | |
|---|---|---|---|---|---|---|---|
| Returns | |||||||
| CAT Return | 16% | 19% | 26% | 25% | 60% | 43% | 395% |
| Peers Return | 19% | 7% | 22% | 8% | 24% | 24% | 158% |
| S&P 500 Return | 27% | -19% | 24% | 23% | 16% | 13% | 105% |
Monthly Win Rates [3] | |||||||
| CAT Win Rate | 58% | 50% | 50% | 67% | 50% | 56% | |
| Peers Win Rate | 62% | 43% | 48% | 53% | 65% | 60% | |
| S&P 500 Win Rate | 75% | 42% | 67% | 75% | 67% | 56% | |
Max Drawdowns [4] | |||||||
| CAT Max Drawdown | -22% | -30% | -22% | -16% | -33% | -27% | |
| Peers Max Drawdown | -23% | -31% | -23% | -22% | -28% | -23% | |
| S&P 500 Max Drawdown | -5% | -25% | -10% | -8% | -19% | -9% | |
[1] Cumulative total returns since the beginning of 2021
[2] Peers: DE, PCAR, CMI, TEX, OSK. See CAT Returns vs. Peers.
[3] Win Rate = % of calendar months in which monthly returns were positive
[4] Max drawdown represents maximum peak-to-trough decline within a year
[5] 2026 data is for the year up to 9/8/2026 (YTD)
How Low Can It Go
| Event | CAT | S&P 500 |
|---|---|---|
| 2025 US Tariff Shock | ||
| % Loss | -22.4% | -18.8% |
| % Gain to Breakeven | 28.9% | 23.1% |
| Time to Breakeven | 35 days | 79 days |
| Summer-Fall 2023 Five Percent Yield Shock | ||
| % Loss | -13.3% | -9.5% |
| % Gain to Breakeven | 15.3% | 10.5% |
| Time to Breakeven | 41 days | 24 days |
| 2023 SVB Regional Banking Crisis | ||
| % Loss | -16.6% | -6.7% |
| % Gain to Breakeven | 20.0% | 7.1% |
| Time to Breakeven | 15 days | 31 days |
| 2022 Inflation Shock & Fed Tightening | ||
| % Loss | -20.2% | -24.5% |
| % Gain to Breakeven | 25.3% | 32.4% |
| Time to Breakeven | 30 days | 427 days |
| 2020 COVID-19 Crash | ||
| % Loss | -32.9% | -33.7% |
| % Gain to Breakeven | 49.0% | 50.9% |
| Time to Breakeven | 77 days | 140 days |
| Q4 2018 Fed Policy Error / Growth Scare | ||
| % Loss | -28.5% | -19.2% |
| % Gain to Breakeven | 39.9% | 23.8% |
| Time to Breakeven | 686 days | 105 days |
In The Past
Caterpillar's stock fell -22.4% during the 2025 US Tariff Shock. Such a loss loss requires a 28.9% gain to breakeven.
Preserve Wealth
Limiting losses and compounding gains is essential to preserving wealth.
Asset Allocation
Actively managed asset allocation strategies protect wealth. Learn more.
| Event | CAT | S&P 500 |
|---|---|---|
| 2025 US Tariff Shock | ||
| % Loss | -22.4% | -18.8% |
| % Gain to Breakeven | 28.9% | 23.1% |
| Time to Breakeven | 35 days | 79 days |
| 2022 Inflation Shock & Fed Tightening | ||
| % Loss | -20.2% | -24.5% |
| % Gain to Breakeven | 25.3% | 32.4% |
| Time to Breakeven | 30 days | 427 days |
| 2020 COVID-19 Crash | ||
| % Loss | -32.9% | -33.7% |
| % Gain to Breakeven | 49.0% | 50.9% |
| Time to Breakeven | 77 days | 140 days |
| Q4 2018 Fed Policy Error / Growth Scare | ||
| % Loss | -28.5% | -19.2% |
| % Gain to Breakeven | 39.9% | 23.8% |
| Time to Breakeven | 686 days | 105 days |
| 2015-2016 China Devaluation / Global Growth Scare | ||
| % Loss | -24.5% | -12.2% |
| % Gain to Breakeven | 32.5% | 13.9% |
| Time to Breakeven | 67 days | 62 days |
| 2014-2016 Oil Price Collapse | ||
| % Loss | -43.8% | -6.8% |
| % Gain to Breakeven | 78.0% | 7.3% |
| Time to Breakeven | 456 days | 15 days |
| 2011 US Debt Ceiling Crisis & European Contagion | ||
| % Loss | -32.9% | -17.9% |
| % Gain to Breakeven | 49.0% | 21.8% |
| Time to Breakeven | 107 days | 123 days |
| 2010 Eurozone Sovereign Debt Crisis / Flash Crash | ||
| % Loss | -22.1% | -15.4% |
| % Gain to Breakeven | 28.3% | 18.2% |
| Time to Breakeven | 59 days | 125 days |
| 2008-2009 Global Financial Crisis | ||
| % Loss | -68.8% | -53.4% |
| % Gain to Breakeven | 220.3% | 114.4% |
| Time to Breakeven | 417 days | 1085 days |
In The Past
Caterpillar's stock fell -22.4% during the 2025 US Tariff Shock. Such a loss loss requires a 28.9% gain to breakeven.
Preserve Wealth
Limiting losses and compounding gains is essential to preserving wealth.
Asset Allocation
Actively managed asset allocation strategies protect wealth. Learn more.
About Caterpillar (CAT)
Caterpillar Inc. (CAT) is a global leader in manufacturing and selling heavy machinery, engines, and industrial gas turbines. The company primarily operates across vital sectors such as construction, mining, and energy, providing the foundational equipment and power solutions necessary for large-scale infrastructure development, resource extraction, and power generation worldwide.
The company's core product offerings are diverse, spanning multiple segments. Its Construction Industries division provides a wide range of equipment including excavators, loaders, motor graders, and track-type tractors used in building roads, infrastructure, and general construction. The Resource Industries segment focuses on machinery for mining and quarrying, such as electric rope shovels, large mining trucks, and rotary drills, alongside advanced fleet management and autonomous solutions. Furthermore, the Energy & Transportation segment supplies critical power generation solutions, including reciprocating engines, generator sets, industrial gas turbines, and diesel-electric locomotives for marine, oil and gas, and electric power sectors.
Caterpillar serves a broad international customer base, including construction companies, mining operators, and enterprises in the oil and gas, marine, and power generation industries. Beyond equipment sales, the company also provides essential financial products, such as operating and finance leases, installment sale contracts, and wholesale financing, to support its customers in acquiring and utilizing its machinery and services. Additionally, it offers aftermarket parts like filters and undercarriage components, ensuring ongoing support and operational efficiency for its global clientele.
AI Analysis | Feedback
1. John Deere for industrial construction and mining equipment.
2. The General Motors of bulldozers and excavators.
AI Analysis | Feedback
- Construction Equipment: Manufactures and sells a wide range of machinery for construction, including excavators, loaders, and dozers.
- Mining Equipment: Provides specialized heavy machinery for mining operations, such as shovels, drills, and large mining trucks, along with support solutions.
- Engines, Turbines, and Power Systems: Offers reciprocating engines, industrial gas turbines, generator sets, and integrated systems for various industrial and power generation applications.
- Locomotives and Rail Services: Provides diesel-electric locomotives, rail components, and related services for the global railway industry.
- Financial Services: Offers operating and finance leases, installment sale contracts, working capital loans, and insurance products to customers.
- Aftermarket Parts and Components: Manufactures and sells essential parts and consumables like filters, fluids, undercarriage, and ground engaging tools for its machinery.
AI Analysis | Feedback
Caterpillar Inc. (CAT) primarily sells to other companies rather than individuals. Its major customers fall into the following categories:
- Construction Companies: These include companies involved in large-scale infrastructure projects, residential and commercial construction, road building, and site preparation, which utilize Caterpillar's wide range of construction equipment like excavators, loaders, dozers, and pavers.
- Mining Companies: Enterprises engaged in surface and underground mining operations for various minerals and resources are major customers, relying on Caterpillar's extensive line of mining trucks, shovels, drills, and other heavy equipment designed for resource extraction.
- Energy and Transportation Companies: This category encompasses businesses in sectors such as electric power generation, oil and gas exploration and production, marine transportation, and rail industries, which purchase Caterpillar's engines, generator sets, industrial gas turbines, and locomotives.
AI Analysis | Feedback
AI Analysis | Feedback
Joseph E. Creed, Chief Executive Officer
Joseph E. Creed became Chief Executive Officer of Caterpillar Inc. on May 1, 2025, and will assume the role of Chairman of the Board of Directors effective April 1, 2026. He joined Caterpillar in 1997 and has held various positions of increasing responsibility, including Chief Financial Officer for Caterpillar's Energy & Transportation segment in 2013, Senior Vice President of Caterpillar Finance Services in 2017, and interim Chief Financial Officer in 2018. He was promoted to Group President of Energy & Transportation in 2021 and named Chief Operating Officer in 2023. Mr. Creed graduated from Western Illinois University with a bachelor's degree in accounting.
Andrew Bonfield, Chief Financial Officer
Andrew Bonfield was appointed Chief Financial Officer of Caterpillar Inc. in September 2018. He brings more than three decades of financial expertise to the role. Prior to joining Caterpillar, Mr. Bonfield served as Group CFO and board member of National Grid plc, CFO at Cadbury plc, and Executive Vice President and CFO at Bristol Myers Squibb. He also held roles as finance director of BG Group plc and CFO of Smithkline Beecham plc. Mr. Bonfield is a chartered accountant and holds a Bachelor of Commerce degree from the University of Natal in Durban, South Africa. He also serves as a non-executive director and chairman of the audit committee at Reckitt Benckiser Group plc. Mr. Bonfield was the first CFO appointed from outside Caterpillar.
George A. Moubayed, Chief Sustainability and Strategy Officer and Senior Vice President
George Moubayed is the Chief Sustainability and Strategy Officer and a Senior Vice President of Caterpillar Inc., responsible for the Enterprise Strategy Division. He oversees the execution of Caterpillar's strategy for long-term profitable growth. Mr. Moubayed joined Caterpillar in 1997 and has held several leadership positions, including Vice President and General Manager for load and haul products in Resource Industries, and Vice President of Aftermarket Solutions in Resource Industries. He has a bachelor's degree in engineering from McGill University in Montreal, Canada.
David (Dave) T. Walton, President and Chief Executive Officer of Caterpillar Financial Services Corporation and Senior Vice President
David T. Walton is the President and Chief Executive Officer of Caterpillar Financial Services Corporation (Cat Financial) and a Senior Vice President of Caterpillar Inc. He is responsible for the Financial Products Division, which includes Cat Financial and Cat Financial Insurance Services. Mr. Walton joined Cat Financial in 1989 and has held various credit, portfolio management, and sales positions in the United States. His international experience includes serving as managing director of Northern Europe and vice president for Asia-Pacific operations. He also formed and led Cat Financial's global mining finance organization. Mr. Walton holds a bachelor's degree in accounting from Indiana University and a master's degree in business administration from Keller Graduate School.
Ogi Redzic, Chief Digital Officer and Senior Vice President
Ogi Redzic is the Chief Digital Officer and a Senior Vice President of Caterpillar Inc., responsible for Cat Digital. He manages key components of the company's digital and marketing portfolios, including global marketing & brand, connectivity, enterprise data, analytics and AI, and eCommerce. Before joining Caterpillar in 2018, Mr. Redzic was the Alliance Senior Vice President of Connected Vehicles and Mobility Services at Renault-Nissan Alliance. He has more than 20 years of experience in leadership positions in corporate and start-up environments, including roles at Mitsubishi, Nokia HERE, NAVTEQ, PCTEL, Inc., cyberPIXIE, and Motorola. Mr. Redzic holds a bachelor's degree in computer science from Northeastern Illinois University, a master's degree in computer science from the Illinois Institute of Technology, and an MBA from the Kellogg School of Management at Northwestern University.
AI Analysis | Feedback
Here are the key risks to Caterpillar Inc.'s business:
- Trade Policy and Tariffs: Caterpillar faces significant financial headwinds due to persistent trade policies and tariffs, leading to substantial costs and compressing operating margins. For instance, the company adjusted its tariff guidance to an estimated impact of between $1.60 billion and $1.75 billion for the full 2025 fiscal year. These costs are projected to remain substantial, with an estimated incremental cost of $2.6 billion in 2026, directly impacting operating margins and segment profits.
- Cyclical Demand and Macroeconomic Vulnerability: Caterpillar's core business, heavily reliant on the construction and mining sectors, is exposed to the cyclical nature of these industries. Revenue and profitability are susceptible to economic downturns, fluctuations in commodity prices, project funding, and overall macroeconomic conditions. This vulnerability can lead to rapid declines in equipment purchases and sales volumes, exacerbated by risks of dealer inventory destocking.
- Intensifying Competitive Pressure: The company faces aggressive competition, particularly in the North American construction market. Competitors, especially from China, have the advantage of lower labor costs and better access to raw materials and components, which can lead to market share loss and negatively impact Caterpillar's pricing power and profitability. Deere & Company and Komatsu are actively strengthening their presence in key markets, indicating escalating competitive challenges.
AI Analysis | Feedback
There are two clear emerging threats for Caterpillar:
- Rapid Electrification of Heavy Equipment: A significant industry shift towards battery-electric and hydrogen-powered machinery, particularly in construction and mining. While Caterpillar is investing in these technologies, the swift pace of adoption, driven by environmental regulations, sustainability goals, and operating cost benefits, could disrupt its dominant position in diesel-powered equipment. Agile new entrants or existing competitors fully committing to electric fleets could gain market share rapidly, challenging Caterpillar's traditional product lines and potentially cannibalizing its legacy engine and equipment sales faster than its new electric offerings can compensate.
- Decarbonization and Shift Away from Fossil Fuels in Energy & Transportation: The global push for cleaner energy solutions, including renewable power generation (solar, wind) and advanced energy storage, poses a direct threat to Caterpillar's Energy & Transportation segment. This segment heavily relies on manufacturing and selling diesel and natural gas engines and generator sets. As industries, marine, and power generation sectors increasingly transition to alternative fuels (e.g., hydrogen) or completely bypass internal combustion engines in favor of electric grids powered by renewables, the demand for Caterpillar's traditional fossil fuel-based power solutions could decline significantly.
AI Analysis | Feedback
Caterpillar (CAT) operates in several significant global markets for its main products and services.
Construction Equipment
The global construction equipment market size was valued at approximately USD 242.17 billion in 2025 and is projected to reach USD 471.25 billion by 2033, demonstrating a Compound Annual Growth Rate (CAGR) of 8.7% from 2026 to 2033. Asia Pacific is noted as the dominant region in this market, holding a substantial share of the global revenue in 2025.
Mining Equipment
The global mining equipment market size was estimated at USD 95.97 billion in 2024 and is anticipated to grow to USD 150.11 billion by 2032, at a CAGR of 5.75% over the forecast period. Asia-Pacific leads the global mining equipment market, driven by significant mining activities, rapid industrialization, and large-scale infrastructure development projects in countries like China, India, and Australia.
Diesel and Natural Gas Engines
The global diesel engine market size reached USD 243.8 billion in 2025 and is expected to grow to USD 318.7 billion by 2034, with a CAGR of 3.02% during the period of 2026-2034. For diesel engines specifically used for power generation, the global market size was valued at USD 49.9 billion in 2025 and is projected to reach USD 93.1 billion by 2033, expanding at a CAGR of 8.2% from 2026 to 2033. Asia Pacific held the largest share of the diesel engine for power generation market in 2025.
Industrial Gas Turbines
The global industrial gas turbine market size was USD 9.55 billion in 2025 and is expected to increase from USD 9.85 billion in 2026 to USD 12.16 billion by 2034, at a CAGR of 2.67%. Another estimate places the global industrial gas turbine market at USD 7.3 billion in 2024, projected to grow to USD 12.2 billion in 2034 with a CAGR of 5.1% from 2025 to 2034. Asia-Pacific accounted for 45.60% of the global revenue in 2025.
Locomotives and Rail-related Products
The global locomotive market size was valued at USD 14.42 billion in 2025 and is projected to grow to USD 31.25 billion by 2034, exhibiting a CAGR of 9.43% from 2026 to 2034. Asia Pacific dominated the global locomotive market with a share of 52.63% in 2025.
AI Analysis | Feedback
Caterpillar Inc. (CAT) is expected to drive future revenue growth over the next 2-3 years through several key factors:
- Strong Backlog and Volume Growth: Caterpillar holds a record backlog of $51 billion, a significant portion of which is anticipated to be delivered within the next 12 months, providing substantial momentum and expected volume growth across all primary business segments.
- Increased Demand for Power Generation: The Energy & Transportation segment is poised for robust growth, particularly from rising energy demands for data centers and hyperscalers supporting cloud computing and generative AI. The company has secured large orders for generator sets for data center prime power, with deliveries scheduled through 2027.
- Growth in Services Revenue: Caterpillar is strategically accelerating its services revenue, targeting an annual figure of $28 billion by 2026. This growth is driven by repower programs, equipment upgrades, and long-term maintenance contracts, capitalizing on the company's extensive global dealer network and connected assets.
- Positive Price Realization: Caterpillar projects positive price realization, with approximately 2% favorable price adjustments contributing to sales growth across all three primary segments in 2026.
- Infrastructure Investment and Reshoring: The Construction Industries segment is expected to benefit from infrastructure tailwinds, including government funding (such as IIGJA funding), accelerated investment in data center construction, and reshoring initiatives in U.S. manufacturing, all of which are driving demand for construction equipment.
AI Analysis | Feedback
Share Repurchases
- In June 2024, Caterpillar's Board of Directors increased its share repurchase authorization by $20 billion, bringing the total current authorization to approximately $21.8 billion. This authorization was initially launched in 2022 and has no expiration date.
- Caterpillar returned over $10 billion to shareholders through share repurchases and dividends in 2024.
- In 2025, the company deployed $7.9 billion of cash for share repurchases and dividends.
Share Issuance
- The number of outstanding shares has consistently declined over the past few years, indicating net share repurchases rather than issuances.
- Caterpillar's shares outstanding were 467.98 million at the end of 2025, a 3.49% decline from 2024.
- Shares outstanding were 477.932 million in 2024, a 4.71% decrease from 2023.
Outbound Investments
- In October 2025, Caterpillar acquired RPMGlobal Holdings Limited, a provider of mine design, planning, and scheduling software, for $728 million.
- The company acquired Tangent Energy Solutions, Inc. in May 2022, focusing on energy usage monitoring solutions for commercial and industrial sectors.
- Caterpillar also acquired CarbonPoint Solutions in September 2021, a company specializing in carbon capture technology.
Capital Expenditures
- Capital expenditures increased consistently from 2021 to 2025, peaking at $4.286 billion in 2025.
- For 2026, projected capital expenditures are expected to be around $3.5 billion, primarily for capacity expansion.
- Caterpillar is making significant investments in advanced technologies such as autonomy, alternative fuels, connectivity, digital, and electrification to meet customer demands. Notably, in October 2025, a $725 million capital expansion was announced for its Lafayette, Indiana engine facility to boost engine production, particularly for data centers.

Peer Outperformance in Construction Machinery & Heavy Transportation Equipment
| Industry | Names | 1Y med | 3Y med | 5Y med | Top 3 by 5Y |
|---|---|---|---|---|---|
| Construction & Engineering | 31 | 20.0% | 107.9% | 197.4% | CDNL 2840% · FIX 2213% · STRL 2157% |
| Marine Transportation | 5 | 63.4% | 63.9% | 165.0% | HOS 47689% · MATX 180% · KEX 165% |
| Construction Machinery & Heavy Transportation Equipment ← | 13 | 12.3% | 61.8% | 116.9% | CAT 336% · ALSN 291% · WAB 228% |
| Aerospace & Defense | 55 | -1.5% | 61.3% | 75.2% | ATI 1081% · FTAI 956% · HWM 642% |
| Passenger Ground Transportation | 3 | -15.6% | 50.1% | 54.2% | UBER 81% · CAR 54% · LYFT -68% |
| Rail Transportation | 7 | 32.0% | 70.6% | 47.1% | FSTR 143% · CSX 67% · UNP 54% |
| Industrial Machinery & Supplies & Components | 71 | 9.4% | 50.6% | 42.0% | CRS 1417% · PSIX 1021% · EROC 690% |
| Cargo Ground Transportation | 16 | 38.0% | 6.6% | 39.2% | XPO 268% · R 260% · CVLG 228% |
| Trading Companies & Distributors | 19 | 3.5% | 36.0% | 34.2% | DXPE 565% · AIT 293% · WCC 230% |
| Diversified Support Services | 33 | 9.3% | 30.0% | 28.2% | LIME 4271% · TH 410% · WLFC 380% |
| Electrical Components & Equipment | 41 | 21.5% | 56.7% | 26.0% | POWL 2280% · BE 1267% · VRT 1066% |
| Building Products | 33 | -12.6% | 3.5% | 17.1% | LMB 603% · GFF 407% · PPIH 293% |
| Agricultural & Farm Machinery | 17 | 16.6% | 5.8% | -4.7% | BLBD 230% · DE 99% · GENC 62% |
| Industrial Conglomerates | 17 | 8.7% | 14.4% | -5.5% | RCMT 606% · CSW 136% · CSL 79% |
| Research & Consulting Services | 13 | -11.2% | -23.2% | -11.4% | HURN 200% · GRNQ 151% · CRAI 96% |
| Environmental & Facilities Services | 29 | -9.1% | 28.8% | -11.8% | CECO 1002% · ADUR 410% · NVRI 376% |
| Data Processing & Outsourced Services | 6 | -33.3% | -14.8% | -26.6% | EXLS 45% · BR 9% · G -26% |
| Office Services & Supplies | 9 | 12.1% | 27.7% | -27.6% | PBI 188% · TILE 152% · HNI 58% |
| Passenger Airlines | 11 | 0.1% | -1.0% | -30.0% | LTM 3212% · UAL 132% · SKYW 110% |
| Air Freight & Logistics | 12 | -10.6% | -23.2% | -37.8% | CHRW 94% · FDX 67% · EXPD 60% |
| Human Resource & Employment Services | 22 | 4.8% | -20.7% | -38.2% | BBSI 78% · ADP 47% · PAYX 23% |
| Security & Alarm Services | 10 | -36.0% | 8.4% | -39.2% | CIX 154% · MG 105% · NL 57% |
| Airport Services | 3 | -67.9% | -77.9% | -57.1% | JOBY -27% · ASLE -57% · UP -100% |
Latest Trefis Analyses
Research & Analysis
Invest in Strategies
Wealth Management
Peer Comparisons
| Peers to compare with: |
Financials
| Median | |
|---|---|
| Name | |
| Mkt Price | 357.66 |
| Mkt Cap | 71.0 |
| Rev LTM | 31,262 |
| Op Inc LTM | 3,330 |
| FCF LTM | 3,096 |
| FCF 3Y Avg | 2,490 |
| CFO LTM | 4,496 |
| CFO 3Y Avg | 3,860 |
Growth & Margins
| Median | |
|---|---|
| Name | |
| Rev Chg LTM | 5.5% |
| Rev Chg 3Y Avg | 4.0% |
| Rev Chg Q | 8.1% |
| QoQ Delta Rev Chg LTM | 2.1% |
| Op Inc Chg LTM | -1.2% |
| Op Inc Chg 3Y Avg | -2.6% |
| Op Mgn LTM | 10.6% |
| Op Mgn 3Y Avg | 10.9% |
| QoQ Delta Op Mgn LTM | 0.1% |
| CFO/Rev LTM | 14.4% |
| CFO/Rev 3Y Avg | 11.9% |
| FCF/Rev LTM | 10.1% |
| FCF/Rev 3Y Avg | 7.3% |
Valuation
| Median | |
|---|---|
| Name | |
| Mkt Cap | 71.0 |
| P/S | 2.3 |
| P/Op Inc | 21.1 |
| P/EBIT | 19.3 |
| P/E | 31.7 |
| P/CFO | 16.2 |
| Total Yield | 4.3% |
| Dividend Yield | 1.2% |
| FCF Yield 3Y Avg | 4.7% |
| D/E | 0.2 |
| Net D/E | 0.1 |
Returns
| Median | |
|---|---|
| Name | |
| 1M Rtn | -4.6% |
| 3M Rtn | 0.8% |
| 6M Rtn | 2.4% |
| 12M Rtn | 35.5% |
| 3Y Rtn | 69.6% |
| 1M Excs Rtn | -3.5% |
| 3M Excs Rtn | -1.5% |
| 6M Excs Rtn | -10.1% |
| 12M Excs Rtn | 16.2% |
| 3Y Excs Rtn | -0.8% |
Comparison Analyses
Segment Financials
Revenue by Segment| $ Mil | 2025 | 2024 | 2023 | 2022 | 2021 |
|---|---|---|---|---|---|
| Power & Energy | 32,201 | 28,854 | 28,001 | 23,752 | 20,287 |
| Construction Industries | 25,060 | 25,455 | 27,418 | 25,269 | 22,106 |
| Resource Industries | 12,474 | 12,389 | 13,583 | 12,314 | 9,810 |
| Financial Products Segment | 4,220 | 4,053 | 3,785 | 3,253 | 3,073 |
| All Other Segment | 327 | 425 | 449 | 450 | 511 |
| Corporate Items and Eliminations | -6,693 | -6,367 | -6,176 | -5,611 | -4,816 |
| Total | 67,589 | 64,809 | 67,060 | 59,427 | 50,971 |
| $ Mil | 2004 | 2003 | 2002 | 2001 | 2000 |
|---|---|---|---|---|---|
| Construction & Mining Products | 1,150 | 538 | 431 | 526 | 639 |
| All Other | 655 | 350 | 323 | 248 | 233 |
| Financing & Insurance Services | 460 | 339 | 268 | 334 | 253 |
| North America Marketing | 434 | 177 | 64 | 54 | 79 |
| Power Products | 408 | -87 | 34 | 195 | 487 |
| EAME Marketing | 380 | 177 | 135 | 164 | 195 |
| Latin America Marketing | 180 | 62 | 72 | 59 | 43 |
| Asia/ Pacific Marketing | 133 | 115 | 113 | 18 | 39 |
| Total | 3,800 | 1,671 | 1,440 | 1,598 | 1,968 |
| $ Mil | 2025 | 2024 | 2023 | 2022 | 2021 |
|---|---|---|---|---|---|
| Financial Products Segment | 41,476 | 36,925 | 35,685 | 34,269 | 34,860 |
| Liabilities included in segment assets | 15,330 | 11,973 | 11,781 | 12,519 | 10,777 |
| Power & Energy | 11,387 | 11,772 | 10,555 | 9,455 | 9,253 |
| Cash and cash equivalents | 9,333 | 6,165 | 6,106 | 6,042 | 8,428 |
| Resource Industries | 6,087 | 5,548 | 5,742 | 5,775 | 5,962 |
| Construction Industries | 5,442 | 5,546 | 5,384 | 5,168 | 4,547 |
| Property, plant and equipment - net and other assets | 4,689 | 4,808 | 6,548 | 4,234 | 4,056 |
| Goodwill and intangible assets | 4,669 | 4,478 | 4,452 | 4,248 | 4,859 |
| Deferred income taxes | 2,749 | 3,194 | 2,668 | 2,098 | 1,735 |
| All Other Segment | 1,516 | 1,937 | 1,890 | 1,828 | 1,678 |
| Other | -471 | -1,022 | -166 | -630 | -706 |
| Inventory methodology differences | -3,622 | -3,560 | -3,169 | -3,063 | -2,656 |
| Total | 98,585 | 87,764 | 87,476 | 81,943 | 82,793 |
Price Behavior
| Market Price | $822.48 | |
| Market Cap ($ Bil) | 378.7 | |
| First Trading Date | 01/02/1962 | |
| Distance from 52W High | -22.6% | |
| 50 Days | 200 Days | |
| DMA Price | $868.70 | $772.52 |
| DMA Trend | up | down |
| Distance from DMA | -5.3% | 6.5% |
| 3M | 1YR | |
| Volatility | 45.4% | 39.7% |
| Downside Capture | 244.80 | 154.15 |
| Upside Capture | 154.06 | 202.30 |
| Correlation (SPY) | 58.6% | 56.5% |
| 1M | 2M | 3M | 6M | 1Y | 3Y | |
|---|---|---|---|---|---|---|
| Beta | 1.78 | 1.87 | 1.96 | 1.91 | 1.74 | 1.29 |
| Up Beta | 2.65 | 2.93 | 2.12 | 2.29 | 1.85 | 1.20 |
| Down Beta | 0.68 | 1.73 | 1.63 | 1.32 | 1.53 | 1.17 |
| Up Capture | 97% | 46% | 191% | 220% | 334% | 378% |
| Bmk +ve Days | 10 | 21 | 32 | 68 | 138 | 427 |
| Stock +ve Days | 9 | 18 | 33 | 67 | 139 | 407 |
| Down Capture | 218% | 254% | 207% | 177% | 133% | 107% |
| Bmk -ve Days | 11 | 21 | 32 | 59 | 113 | 324 |
| Stock -ve Days | 12 | 24 | 31 | 60 | 112 | 344 |
[1] Upside and downside betas calculated using positive and negative benchmark daily returns respectively
Based On 1-Year Data
| Annualized Return | Annualized Volatility | Sharpe Ratio | Correlation with CAT | |
|---|---|---|---|---|
| CAT | 96.7% | 39.6% | 1.79 | - |
| Sector ETF (XLI) | 16.8% | 17.1% | 0.74 | 76.2% |
| Equity (SPY) | 19.4% | 12.8% | 1.11 | 56.2% |
| Gold (GLD) | 20.8% | 29.2% | 0.65 | 26.9% |
| Commodities (DBC) | 45.0% | 20.4% | 1.72 | -10.3% |
| Real Estate (VNQ) | 7.8% | 13.6% | 0.30 | 7.8% |
| Bitcoin (BTCUSD) | -28.1% | 43.9% | -0.63 | 23.1% |
Smart multi-asset allocation framework can stack odds in your favor. Learn How
Based On 5-Year Data
| Annualized Return | Annualized Volatility | Sharpe Ratio | Correlation with CAT | |
|---|---|---|---|---|
| CAT | 33.5% | 31.7% | 0.95 | - |
| Sector ETF (XLI) | 12.4% | 17.6% | 0.54 | 73.9% |
| Equity (SPY) | 12.6% | 17.2% | 0.56 | 57.1% |
| Gold (GLD) | 18.8% | 18.8% | 0.81 | 15.4% |
| Commodities (DBC) | 10.6% | 19.5% | 0.42 | 22.4% |
| Real Estate (VNQ) | 1.5% | 18.9% | -0.03 | 36.6% |
| Bitcoin (BTCUSD) | 11.1% | 52.6% | 0.39 | 23.9% |
Smart multi-asset allocation framework can stack odds in your favor. Learn How
Based On 10-Year Data
| Annualized Return | Annualized Volatility | Sharpe Ratio | Correlation with CAT | |
|---|---|---|---|---|
| CAT | 28.6% | 31.4% | 0.87 | - |
| Sector ETF (XLI) | 13.4% | 20.1% | 0.59 | 76.3% |
| Equity (SPY) | 15.2% | 17.9% | 0.72 | 62.9% |
| Gold (GLD) | 12.2% | 16.3% | 0.61 | 7.2% |
| Commodities (DBC) | 7.9% | 18.1% | 0.36 | 30.8% |
| Real Estate (VNQ) | 4.9% | 20.7% | 0.20 | 41.9% |
| Bitcoin (BTCUSD) | 63.6% | 66.2% | 1.03 | 15.7% |
Smart multi-asset allocation framework can stack odds in your favor. Learn How
Returns Analyses
Earnings Returns History
Updated 9/4/2026| Forward Returns | |||
|---|---|---|---|
| Earnings Date | 1D Returns | 5D Returns | 21D Returns |
| 8/4/2026 | 5.6% | 0.9% | -6.1% |
| 4/30/2026 | 9.9% | 14.4% | 8.1% |
| 1/29/2026 | 3.4% | 7.5% | 15.5% |
| 10/29/2025 | 11.6% | 4.4% | 9.4% |
| 8/5/2025 | 0.1% | -5.8% | -4.3% |
| 4/30/2025 | 0.6% | 4.4% | 14.4% |
| 1/30/2025 | -4.6% | -8.7% | -12.5% |
| 10/30/2024 | -2.1% | -1.1% | 4.2% |
| ... | |||
| SUMMARY STATS | |||
| # Positive | 11 | 14 | 15 |
| # Negative | 13 | 10 | 9 |
| Median Positive | 4.1% | 4.2% | 6.3% |
| Median Negative | -3.2% | -4.2% | -4.3% |
| Max Positive | 11.6% | 14.4% | 19.7% |
| Max Negative | -7.0% | -8.9% | -12.5% |
| Forward Returns | |||
|---|---|---|---|
| Earnings Date | 1D Returns | 5D Returns | 21D Returns |
| 8/4/2026 | 5.6% | 0.9% | -6.1% |
| 4/30/2026 | 9.9% | 14.4% | 8.1% |
| 1/29/2026 | 3.4% | 7.5% | 15.5% |
| 10/29/2025 | 11.6% | 4.4% | 9.4% |
| 8/5/2025 | 0.1% | -5.8% | -4.3% |
| 4/30/2025 | 0.6% | 4.4% | 14.4% |
| 1/30/2025 | -4.6% | -8.7% | -12.5% |
| 10/30/2024 | -2.1% | -1.1% | 4.2% |
| 8/6/2024 | 3.0% | 6.1% | 6.3% |
| 4/25/2024 | -7.0% | -8.9% | -3.5% |
| 2/5/2024 | 2.0% | 0.7% | 5.9% |
| 10/31/2023 | -6.7% | -1.6% | 3.0% |
| 8/1/2023 | 8.9% | 6.2% | 5.6% |
| 4/27/2023 | -0.9% | -0.3% | -2.9% |
| 1/31/2023 | -3.5% | -3.9% | -4.9% |
| 10/27/2022 | 7.7% | 8.9% | 19.7% |
| 8/2/2022 | -5.8% | -4.6% | -4.1% |
| 4/28/2022 | -0.7% | 4.0% | -0.5% |
| 1/28/2022 | -5.2% | -5.5% | -11.6% |
| 10/28/2021 | 4.1% | 3.8% | 1.3% |
| 7/30/2021 | -2.7% | -2.5% | 0.1% |
| 4/29/2021 | -2.1% | 2.4% | 3.9% |
| 1/29/2021 | -0.8% | 4.0% | 19.2% |
| 10/27/2020 | -3.2% | 0.0% | 8.4% |
| SUMMARY STATS | |||
| # Positive | 11 | 14 | 15 |
| # Negative | 13 | 10 | 9 |
| Median Positive | 4.1% | 4.2% | 6.3% |
| Median Negative | -3.2% | -4.2% | -4.3% |
| Max Positive | 11.6% | 14.4% | 19.7% |
| Max Negative | -7.0% | -8.9% | -12.5% |
SEC Filings
Expand for More| Report Date | Filing Date | Filing |
|---|---|---|
| 06/30/2026 | 08/05/2026 | 10-Q |
| 03/31/2026 | 05/06/2026 | 10-Q |
| 12/31/2025 | 02/13/2026 | 10-K |
| 09/30/2025 | 11/03/2025 | 10-Q |
| 06/30/2025 | 08/06/2025 | 10-Q |
| 03/31/2025 | 05/07/2025 | 10-Q |
| 12/31/2024 | 02/14/2025 | 10-K |
| 09/30/2024 | 11/06/2024 | 10-Q |
| 06/30/2024 | 08/07/2024 | 10-Q |
| 03/31/2024 | 05/01/2024 | 10-Q |
| 12/31/2023 | 02/16/2024 | 10-K |
| 09/30/2023 | 11/01/2023 | 10-Q |
| 06/30/2023 | 08/02/2023 | 10-Q |
| 03/31/2023 | 05/03/2023 | 10-Q |
| 12/31/2022 | 02/15/2023 | 10-K |
| 09/30/2022 | 11/02/2022 | 10-Q |
| Report Date | Filing Date | Filing |
|---|---|---|
| 06/30/2026 | 08/05/2026 | 10-Q |
| 03/31/2026 | 05/06/2026 | 10-Q |
| 12/31/2025 | 02/13/2026 | 10-K |
| 09/30/2025 | 11/03/2025 | 10-Q |
| 06/30/2025 | 08/06/2025 | 10-Q |
| 03/31/2025 | 05/07/2025 | 10-Q |
| 12/31/2024 | 02/14/2025 | 10-K |
| 09/30/2024 | 11/06/2024 | 10-Q |
| 06/30/2024 | 08/07/2024 | 10-Q |
| 03/31/2024 | 05/01/2024 | 10-Q |
| 12/31/2023 | 02/16/2024 | 10-K |
| 09/30/2023 | 11/01/2023 | 10-Q |
| 06/30/2023 | 08/02/2023 | 10-Q |
| 03/31/2023 | 05/03/2023 | 10-Q |
| 12/31/2022 | 02/15/2023 | 10-K |
| 09/30/2022 | 11/02/2022 | 10-Q |
| 06/30/2022 | 08/03/2022 | 10-Q |
| 03/31/2022 | 05/04/2022 | 10-Q |
| 12/31/2021 | 02/16/2022 | 10-K |
| 09/30/2021 | 11/03/2021 | 10-Q |
| 06/30/2021 | 08/04/2021 | 10-Q |
| 03/31/2021 | 05/05/2021 | 10-Q |
| 12/31/2020 | 02/17/2021 | 10-K |
| 09/30/2020 | 11/04/2020 | 10-Q |
| 06/30/2020 | 08/05/2020 | 10-Q |
| 03/31/2020 | 05/06/2020 | 10-Q |
| 12/31/2019 | 02/19/2020 | 10-K |
| 09/30/2019 | 10/31/2019 | 10-Q |
Insider Activity
Updated 9/1/2026| # | Owner | Title | Holding | Action | Filing Date | Price | Shares | Transacted Value | Value of Held Shares | Form |
|---|---|---|---|---|---|---|---|---|---|---|
| 1 | Creed, Joseph E | Chief Executive Officer | Direct | Sell | 9012026 | 808.98 | 32,401 | 26,211,764 | 27,954,307 | Form |
| 2 | Johnson, Denise C | Group President | Direct | Sell | 5152026 | 907.91 | 12,605 | 11,444,170 | 45,236,474 | Form |
| 3 | Johnson, Denise C | Group President | Direct | Sell | 5142026 | 909.79 | 6,196 | 5,637,081 | 45,330,466 | Form |
| 4 | Schaupp, William E | Chief Accounting Officer | Direct | Sell | 5142026 | 906.00 | 360 | 326,160 | 480,180 | Form |
| 5 | Fassino, Anthony D | Group President | Direct | Sell | 5122026 | 916.80 | 16,283 | 14,928,266 | 42,210,423 | Form |
| # | Owner | Title | Holding | Action | Filing Date | Price | Shares | Transacted Value | Value of Held Shares | Form |
|---|---|---|---|---|---|---|---|---|---|---|
| 1 | Creed, Joseph E | Chief Executive Officer | Direct | Sell | 9012026 | 808.98 | 32,401 | 26,211,764 | 27,954,307 | Form |
| 2 | Johnson, Denise C | Group President | Direct | Sell | 5152026 | 907.91 | 12,605 | 11,444,170 | 45,236,474 | Form |
| 3 | Johnson, Denise C | Group President | Direct | Sell | 5142026 | 909.79 | 6,196 | 5,637,081 | 45,330,466 | Form |
| 4 | Schaupp, William E | Chief Accounting Officer | Direct | Sell | 5142026 | 906.00 | 360 | 326,160 | 480,180 | Form |
| 5 | Fassino, Anthony D | Group President | Direct | Sell | 5122026 | 916.80 | 16,283 | 14,928,266 | 42,210,423 | Form |
| 6 | De, Lange Bob | Group President | Direct | Sell | 5072026 | 922.92 | 24,222 | 22,354,978 | 79,397,919 | Form |
| 7 | Fassino, Anthony D | Group President | Direct | Sell | 5072026 | 926.25 | 9,152 | 8,477,067 | 42,645,612 | Form |
| 8 | Bonfield, Andrew R J | CFO Emeritus | Direct | Sell | 5072026 | 918.71 | 15,674 | 14,399,861 | 48,631,914 | Form |
| 9 | Kaiser, Jason | Group President | Direct | Sell | 5052026 | 883.03 | 5,642 | 4,982,055 | 8,471,790 | Form |
| 10 | MacLennan, David | Direct | Buy | 5052026 | 876.84 | 250 | 219,210 | 7,195,349 | Form | |
| 11 | Creed, Joseph E | Chief Executive Officer | Direct | Sell | 3062026 | 718.93 | 2,500 | 1,797,317 | 25,222,107 | Form |
| 12 | Shurman, Rodney Michael | Group President | Direct | Sell | 2242026 | 759.61 | 2,278 | 1,730,392 | 1,096,117 | Form |
| 13 | Shurman, Rodney Michael | Group President | Direct | Sell | 2182026 | 763.39 | 1,764 | 1,346,620 | 1,099,282 | Form |
| 14 | Schaupp, William E | Chief Accounting Officer | Direct | Sell | 2182026 | 764.20 | 972 | 742,802 | 629,701 | Form |
| 15 | Fassino, Anthony D | Group President | Direct | Sell | 2172026 | 776.90 | 7,891 | 6,130,518 | 36,236,947 | Form |
| 16 | Kaiser, Jason | Group President | Direct | Sell | 2132026 | 776.70 | 1,690 | 1,312,623 | 6,726,999 | Form |
| 17 | De, Lange Bob | Group President | Direct | Sell | 2132026 | 767.08 | 12,507 | 9,593,870 | 65,199,499 | Form |
| 18 | De, Lange Bob | Group President | Direct | Sell | 2092026 | 720.11 | 22,656 | 16,314,812 | 57,574,955 | Form |
| 19 | Fassino, Anthony D | Group President | Direct | Sell | 2092026 | 722.15 | 6,033 | 4,356,731 | 29,717,195 | Form |
| 20 | De, Lange Bob | Group President | Direct | Sell | 2052026 | 704.97 | 16,070 | 11,328,811 | 56,364,183 | Form |
| 21 | Fassino, Anthony D | Group President | Direct | Sell | 2032026 | 680.45 | 10,671 | 7,261,082 | 28,001,198 | Form |
| 22 | De, Lange Bob | Group President | Direct | Sell | 2032026 | 682.99 | 15,977 | 10,912,131 | 54,607,099 | Form |
| 23 | Bonfield, Andrew R J | Chief Financial Officer | Direct | Sell | 1052026 | 575.06 | 10,000 | 5,750,589 | 26,142,178 | Form |
| 24 | Bonfield, Andrew R J | Chief Financial Officer | Direct | Sell | 12022025 | 571.44 | 10,000 | 5,714,448 | 31,692,328 | Form |
| 25 | Kaiser, Jason | Group President | Direct | Sell | 11132025 | 563.60 | 10,707 | 6,034,490 | 4,874,597 | Form |
| 26 | Fassino, Anthony D | Group President | Direct | Sell | 11122025 | 570.18 | 8,184 | 4,666,353 | 23,669,312 | Form |
| 27 | De, Lange Bob | Group President | Direct | Sell | 11072025 | 562.36 | 14,638 | 8,231,826 | 45,106,333 | Form |
| 28 | MacLennan, David | Direct | Buy | 11062025 | 568.86 | 300 | 170,658 | 4,520,730 | Form | |
| 29 | Schaupp, William E | Chief Accounting Officer | Direct | Sell | 11062025 | 572.22 | 1,200 | 686,664 | 757,047 | Form |
| 30 | Umpleby, Iii Donald J | Executive Chairman | Direct | Sell | 10142025 | 505.29 | 17,166 | 8,673,808 | 226,457,335 | Form |
| 31 | Umpleby, Iii Donald J | Executive Chairman | Direct | Sell | 9232025 | 462.65 | 17,166 | 7,941,850 | 215,289,088 | Form |
| 32 | Umpleby, Iii Donald J | Executive Chairman | Direct | Sell | 9032025 | 412.87 | 17,168 | 7,088,152 | 199,211,839 | Form |
Investor Activity (13F)
Updated Sep 9, 2026Active managers (13F portfolio over $250M, at least 3 holdings) with a position over $5M that is either over 10% of their portfolio or held in a concentrated book of 50 or fewer total positions. Index/ETF, sovereign, bank, community-bank and charitable/donor-advised filers are excluded.
| Active Manager | Value | % of Portfolio | Total Positions | QoQ | Filing |
|---|---|---|---|---|---|
| Gates Foundation Trust | $4.5 Bil | 14.2% | 22 | Hold | 13F |
| Westchester Capital Management, Inc. | $41.7 Mil | 8.4% | 45 | Hold | 13F |
| Regents Gate Capital LLP | $17.7 Mil | 3.8% | 36 | New | 13F |
| Minneapolis Portfolio Management Group, LLC | $35.2 Mil | 3.7% | 33 | TRIM -28.1% | 13F |
| Oribel Capital Management, LP | $21.3 Mil | 3.2% | 41 | New | 13F |
| DKRT Investments Corp. | $10.6 Mil | 2.7% | 48 | Hold | 13F |
| Cumberland Advisors Inc | $6.7 Mil | 2.6% | 48 | Hold | 13F |
| Blackhill Capital Inc | $42.2 Mil | 2.2% | 49 | Hold | 13F |
| Albar Capital Partners LLP | $10.7 Mil | 1.7% | 36 | TRIM -71.1% | 13F |
| Active Manager | Value | % of Portfolio | Total Positions | QoQ | As Of | Filing |
|---|---|---|---|---|---|---|
| Electron Capital Partners, LLC | $42.8 Mil | 2.0% | 40 | Exited | Dec 31, 2025 | 13F |
| Generali Powszechne Towarzystwo Emerytalne | $14.4 Mil | 2.5% | 30 | Exited | Dec 31, 2025 | 13F |
| Albar Capital Partners LLP | $10.7 Mil | 1.7% | 36 | TRIM -71.1% | Mar 31, 2026 | 13F |
| Minneapolis Portfolio Management Group, LLC | $35.2 Mil | 3.7% | 33 | TRIM -28.1% | Mar 31, 2026 | 13F |
| Active Manager | Value | % of Portfolio | Total Positions | QoQ | Filing |
|---|---|---|---|---|---|
| Gates Foundation Trust | $4.5 Bil | 14.2% | 22 | Hold | 13F |
| Blackhill Capital Inc | $42.2 Mil | 2.2% | 49 | Hold | 13F |
| Westchester Capital Management, Inc. | $41.7 Mil | 8.4% | 45 | Hold | 13F |
| Minneapolis Portfolio Management Group, LLC | $35.2 Mil | 3.7% | 33 | TRIM -28.1% | 13F |
| Oribel Capital Management, LP | $21.3 Mil | 3.2% | 41 | New | 13F |
| Regents Gate Capital LLP | $17.7 Mil | 3.8% | 36 | New | 13F |
| Albar Capital Partners LLP | $10.7 Mil | 1.7% | 36 | TRIM -71.1% | 13F |
| DKRT Investments Corp. | $10.6 Mil | 2.7% | 48 | Hold | 13F |
| Cumberland Advisors Inc | $6.7 Mil | 2.6% | 48 | Hold | 13F |
CAT Trade Sentinel
High Conviction
CONVICTION RATIONALE
Conviction is high due to a record $72 billion backlog that provides exceptional, multi-year revenue visibility, a feature rarely seen in this industry. This is driven by a structural shift in data center demand, confirmed by multi-gigawatt orders. Management's consistent history of raising guidance reinforces confidence in their ability to execute on this opportunity.
STOCK ARCHETYPE
Cyclical Capital Goods Manufacturer with a Large Services Tail(Number of Units Sold * Average Selling Price) + Services Revenue + Financial Products Revenue Operating leverage from higher sales volume, favorable price realization against input costs (including tariffs), and the mix of sales towards higher-margin segments like Power & Energy.
INVESTMENT THESIS
Yes. A surge in data center demand is driving a multi-year order book, providing unprecedented revenue visibility.
- Order backlog grew to a record $72 billion in Q2 2026, up 92% year-over-year.
- Full-year 2026 sales growth guidance was raised to 'mid- to high teens'.
- Power & Energy customers are placing orders as far out as 2030.
- The company has booked four orders of at least one gigawatt for data center prime power.
- Retail sales to users accelerated in Q2, with Construction up 22% and growth in Resources.
PRIMARY RISK
The company faces significant margin pressure from tariffs at what could be the peak of its traditional machinery cycle, risking a sharp contraction if demand falters.
- Full-year 2026 tariff costs are expected to be around $2.2 billion.
- Q2 2026 tariff costs were about $400 million, a direct margin headwind.
- Management guided for a dealer inventory reduction of over $1 billion in Q4 2026.
- Trailing-twelve-month operating margin of 17.5% is down from 18.2% a year earlier.
| KPI | Status | Rationale |
|---|---|---|
| Order Backlog | $72 billion as of the end of Q2 2026 - Accelerating | Backlog growth has shown significant acceleration, with the year-over-year growth rate increasing from 71% in Q4 2025 to 79% in Q1 2026, and now 92% in Q2 2026. Management stated on the August earnings call that all three primary segments contributed to both the year-over-year and sequential growth, indicating broad-based demand strength. |
| Sales to Users (Retail Sales) | Broad-based growth in Q2 2026: Construction Industries +22%, Resource Industries +17%, Power & Energy +33% - Accelerating | Sales to end-users, a proxy for retail demand, showed accelerating momentum. Construction Industries growth jumped to 22% in Q2 from 7% in Q1. Resource Industries accelerated to 17% growth in Q2 from 6% in Q1. The Power & Energy segment maintained its robust growth, posting a 33% increase in Q2 after a 32% increase in Q1. |
| Sales to Users Growth (Total) | 22% year-over-year (Q2 2026) | Measures retail demand from end customers, providing a clearer picture of underlying market health independent of dealer inventory changes. Strong growth indicates robust end-market activity. |
| Dealer Inventory Change (Construction Industries) | +$400 million (Q2 2026) | Reflects dealers' expectations of future demand. An increase suggests dealers are stocking up in anticipation of strong sales, which can be a tailwind to Caterpillar's factory sales. |
Secular backlog vs. cyclical margin pressure
BULL VIEW
The multi-year, $72 billion backlog from the data center buildout provides enough visibility and volume to power through tariff headwinds and any softness in traditional construction markets.
CORE TENSION
Can the secular demand driving a $72B backlog offset the $2.2B annual tariff headwind and a guided $1B+ Q4 inventory drawdown?
PREVAILING SENTIMENT
Current evidence favors the bull view. The backlog is not just large but accelerating, growing $9 billion sequentially, and management raised full-year revenue guidance alongside the tariff news.
BEAR VIEW
The $2.2 billion annual tariff impact will erode profitability just as the cyclical machinery businesses roll over, and the high-visibility backlog will not be enough to offset the margin decline.
| Timeline | Event & Metric To Watch |
|---|---|
fourth quarter | Medium-Speed Engine Shipments Begin Watch: Shipments are expected to begin for the 10-megawatt medium-speed gas reciprocating engine platform. |
10/19/2026 | Peer Performance Signal Watch: PCAR's reported revenue, order intake, and management outlook for heavy truck and industrial markets. |
10/27/2026 | Tariff Cost Impact on Margins Watch: Actual Q3 tariff costs and their impact on operating margin versus guidance and consensus expectations. |
10/27/2026 | Next Earnings Report Watch: Caterpillar is scheduled to report its next quarterly earnings. |
11/4/2026 | Peer Cummins Earnings Watch: Peer Cummins (CMI) is scheduled to report earnings. |
11/25/2026 | Peer Deere Earnings Watch: Peer Deere (DE) is scheduled to report earnings. |
second half of the year | Manufacturing Throughput Increase Watch: The company expects to increase manufacturing throughput. |
fourth quarter | Construction Inventory Headwind Watch: Commentary on dealer destocking progress and its quantified impact on Construction Industries' sales growth in the Q3 report. |
| Date | Event | Stock Impact |
|---|---|---|
2026-08-04 | Record Q2 Earnings Report Details: Reported record second-quarter sales and revenues of $20.5 billion, up 24%, and adjusted profit per share of $8.17. The company raised its full-year revenue forecast. | +4.9% $830.03 -> $871.08 |
2026-07-07 | Skycatch Acquisition Announced Details: Acquired Skycatch, Inc., a provider of spatial data capture and analysis solutions, to expand mining technology capabilities. | -2.3% $968.12 -> $946.32 |
2026-06-10 | Quarterly Dividend Increased Details: The Board of Directors raised the quarterly dividend by 12 cents to $1.63 per share. | -1.9% $913.01 -> $895.97 |
2026-04-30 | Strong Q1 Earnings Report Details: Reported Q1 2026 sales and revenues of $17.4 billion, an increase of 22%, and adjusted profit per share of $8.17. The two-day stock reaction was 10.0%. | +9.8% $808.55 -> $888.02 |
2026-04-30 | RPMGlobal Acquisition Completed Details: Resource Industries completed the acquisition of RPMGlobal, a leader in mining software technology, to strengthen its ability to deliver integrated solutions for customers. | +9.8% $808.55 -> $888.02 |
2026-03-02 | CONEXPO Technology Showcase Details: At CONEXPO, the company launched Cat Compact, a streamlined customer experience for small contractors, and expanded its AI and autonomy capabilities across the jobsite. | -2.8% $740.05 -> $719.47 |
Position Sizing
2% - 4%
REDUCED POSITION
Sizing is volatility-based: CAT trades at roughly 42% annualized options-implied volatility versus about 13% for the S&P 500 (3.3x the market), around the 85th percentile of its own trailing year. A 2% - 4% position keeps a single-name swing of that size within a diversified portfolio's risk budget.
Diversification Alternatives
DE - Deere & Company
Pure-play agriculture cycleDeere offers more direct exposure to the agricultural and turf equipment markets, which operate on different cycles than Caterpillar's core mining and energy segments.
CMI - Cummins Inc.
Engine technology transitionCummins is a key competitor in engines and power generation, offering a more focused bet on powertrain technology, including the transition to new fuel sources.
A cyclical industrial leader capturing powerful secular tailwinds from the global build-out of data centers and infrastructure.
Caterpillar is experiencing a period of exceptionally strong demand, driven by both cyclical recovery and secular growth trends. The Power & Energy segment is capitalizing on the explosive growth in data centers, while Construction Industries benefits from government infrastructure spending. This has led to a record $72 billion backlog, providing significant revenue visibility and de-risking the near-term outlook despite macroeconomic uncertainties and tariff-related cost pressures.
Continued sequential growth in the order backlog, sustained double-digit 'Sales to Users' growth, and management raising full-year guidance again.
A sharp decline in key commodity prices (copper, gold), announcements of major data center project cancellations, or a significant sequential decline in the order backlog.
Month-to-month fluctuations in regional sales data, minor shifts in dealer inventory that are within seasonal norms.
Repricing Catalyst
The record $72 billion backlog and the company raising its full-year 2026 sales growth guidance to 'mid- to high teens' in the August 2026 earnings report, signaling that demand momentum is accelerating beyond prior expectations.
Power & Energy
$33.4B TTM (47% of Total)What It Is
Sells reciprocating engines, turbines, generator sets, and related services to customers in oil and gas, power generation (including data centers), industrial, marine, and rail applications.
Who Pays & How
Energy companies, data center operators, and industrial firms pay for reliable and efficient power solutions. Customers choose Caterpillar for its broad product portfolio, including reciprocating engines and turbines, that supports critical applications from gas compression to prime and backup power for data centers.
Competition
Construction Industries
$27.0B TTM (38% of Total)What It Is
Sells a range of construction machinery like excavators, wheel loaders, and asphalt pavers to customers in infrastructure, building construction, rental, and quarry and aggregates industries.
Who Pays & How
Construction contractors, rental companies, and quarry operators pay for equipment. Customers in developed economies prioritize productivity and low lifetime owning/operating costs, while those in developing economies may prioritize purchase price, for which Caterpillar offers differentiated products like its SEM brand.
Competition
Resource Industries
$12.6B TTM (18% of Total)What It Is
Sells large machinery like mining trucks, electric rope shovels, and large track-type tractors to customers in mining, heavy construction, and quarry and aggregates.
Who Pays & How
Mining companies and heavy construction firms pay for highly productive and reliable equipment that provides the lowest total cost of ownership. Customers use the equipment to extract commodities like copper, iron ore, coal, and gold.
Competition
Financial Products Segment
$4.3B TTM (6% of Total)What It Is
Provides retail and wholesale financing and leasing for Caterpillar products to customers and dealers worldwide. Also offers insurance and risk management products.
Who Pays & How
End-customers and dealers use financing to purchase and lease Caterpillar equipment. They choose Cat Financial due to its deep knowledge of asset values, industry trends, and integration with Caterpillar's sales process, including financial merchandising programs.
Competition
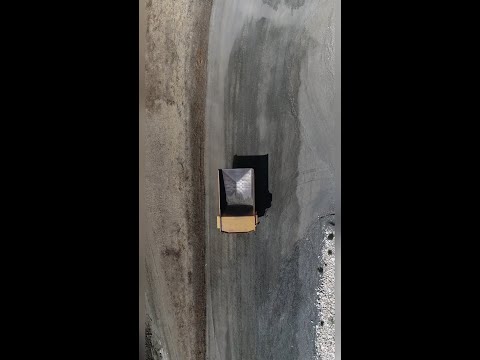
Caterpillar — Investor Video Playlist




Industry Resources
| Industrials Resources |
| IndustryWeek |
| Manufacturing.net |
| Aviation Week |
| Construction Machinery & Heavy Transportation Equipment Resources |
| Equipment World |
| Construction Equipment |
| OEM Off-Highway |
External Quote Links
| Y Finance | Barrons |
| TradingView | Morningstar |
| SeekingAlpha | ValueLine |
| Motley Fool | Robinhood |
| CNBC | Etrade |
| MarketWatch | Unusual Whales |
| YCharts | Perplexity Finance |
| FinViz |
Prefer one of these to Trefis? Tell us why.