
Space Exploration Technologies (SPCX)
Market Price (9/21/2026): $153.65 | Market Cap: $901.0 BilSector: Industrials | Industry: Aerospace & Defense
Space Exploration Technologies (SPCX)
Market Price (9/21/2026): $153.65Market Cap: $901.0 BilSector: IndustrialsIndustry: Aerospace & Defense
Investment Highlights Why It Matters Detailed financial logic regarding cash flow yields vs trend-riding momentum.
Attractive cash flow generationCFO/Rev LTMCash Flow from Operations / Revenue (Sales), Last Twelve Months (LTM) is 18%, CFO LTM is 3.8 Bil Stock buyback supportStock Buyback 3Y Total is 4.9 Bil Megatrend and thematic driversMegatrends include Advanced Aviation & Space. Themes include Commercial Space Exploration, Satellite Internet, and Space Infrastructure & Logistics. | Weak multi-year price returns2Y Excs Rtn is -41%, 3Y Excs Rtn is -76% | Not profitable at operating income levelOp Inc LTMOperating Income, Last Twelve Months is -2.8 Bil, Op Mgn LTMOperating Margin = Operating Income / Revenue Reflects profitability before taxes and before impact of capital structure (interest payments). is -14% Expensive valuation multiplesP/SPrice/Sales ratio is 43x, P/CFOPrice/(Cash Flow from Operations). CFO is cash before capital expenditures. is 235x Significant share based compensationSBC/Rev LTMShare Based Compensation / Revenue (Sales), Last Twelve Months (LTM) is 10% Not cash flow generativeFCF/Rev LTMFree Cash Flow / Revenue (Sales), Last Twelve Months (LTM) is -158% Yield minus risk free rate is negativeERPEquity Risk Premium (ERP) = Total Yield - Risk Free Rate, Reflects the premium above risk free assets offered by the investment. is -4.9% Key risksSPCX key risks include [1] the significant investment in its next-generation Starship program with no guaranteed returns and [2] sustained, Show more. |
| Attractive cash flow generationCFO/Rev LTMCash Flow from Operations / Revenue (Sales), Last Twelve Months (LTM) is 18%, CFO LTM is 3.8 Bil |
| Stock buyback supportStock Buyback 3Y Total is 4.9 Bil |
| Megatrend and thematic driversMegatrends include Advanced Aviation & Space. Themes include Commercial Space Exploration, Satellite Internet, and Space Infrastructure & Logistics. |
| Weak multi-year price returns2Y Excs Rtn is -41%, 3Y Excs Rtn is -76% |
| Not profitable at operating income levelOp Inc LTMOperating Income, Last Twelve Months is -2.8 Bil, Op Mgn LTMOperating Margin = Operating Income / Revenue Reflects profitability before taxes and before impact of capital structure (interest payments). is -14% |
| Expensive valuation multiplesP/SPrice/Sales ratio is 43x, P/CFOPrice/(Cash Flow from Operations). CFO is cash before capital expenditures. is 235x |
| Significant share based compensationSBC/Rev LTMShare Based Compensation / Revenue (Sales), Last Twelve Months (LTM) is 10% |
| Not cash flow generativeFCF/Rev LTMFree Cash Flow / Revenue (Sales), Last Twelve Months (LTM) is -158% |
| Yield minus risk free rate is negativeERPEquity Risk Premium (ERP) = Total Yield - Risk Free Rate, Reflects the premium above risk free assets offered by the investment. is -4.9% |
| Key risksSPCX key risks include [1] the significant investment in its next-generation Starship program with no guaranteed returns and [2] sustained, Show more. |
Qualitative Assessment
AI Analysis | Feedback
Space Exploration Technologies (SPCX) stock has lost about 5% since it went public on 6/12/2026 because of the following key factors:
1. Post-IPO Valuation Correction: Space Exploration Technologies (SPCX) experienced significant volatility following its initial public offering on June 12, 2026. After closing its first trading day at $160.95 per share, the stock initially surged to an intraday high of $225.64 by June 16, driven by considerable market enthusiasm. However, this was quickly followed by a sharp correction, as the stock fell to a post-IPO low of $104.83 in early August, reflecting a re-evaluation of its high valuation by investors.
2. High Capital Expenditures and Operating Losses in Growth Segments: Despite strong revenue growth, the company's financial results for fiscal Q2 2026 (which ended June 30, 2026), reported on August 4, 2026, revealed substantial capital expenditures and ongoing operating losses in its Space and burgeoning AI segments. SpaceX reported a net loss of $541 million in Q2 2026, with total capital expenditure for the quarter reaching $18.4 billion, including $15.8 billion specifically allocated to AI infrastructure. These significant investments and associated losses in key growth areas raised investor concerns regarding the prolonged path to sustained profitability and the potential for future equity dilution.
Show more
Space Exploration Technologies (SPCX) stock has lost about 5% since it went public on 6/12/2026 because of the following key factors:
1. Post-IPO Valuation Correction: Space Exploration Technologies (SPCX) experienced significant volatility following its initial public offering on June 12, 2026. After closing its first trading day at $160.95 per share, the stock initially surged to an intraday high of $225.64 by June 16, driven by considerable market enthusiasm. However, this was quickly followed by a sharp correction, as the stock fell to a post-IPO low of $104.83 in early August, reflecting a re-evaluation of its high valuation by investors.
2. High Capital Expenditures and Operating Losses in Growth Segments: Despite strong revenue growth, the company's financial results for fiscal Q2 2026 (which ended June 30, 2026), reported on August 4, 2026, revealed substantial capital expenditures and ongoing operating losses in its Space and burgeoning AI segments. SpaceX reported a net loss of $541 million in Q2 2026, with total capital expenditure for the quarter reaching $18.4 billion, including $15.8 billion specifically allocated to AI infrastructure. These significant investments and associated losses in key growth areas raised investor concerns regarding the prolonged path to sustained profitability and the potential for future equity dilution.
3. Lock-up Expiration and Increased Share Supply: The staggered expiration of IPO lock-up periods for early investors and employees generated considerable supply-side pressure on the stock. The first major lock-up expiration occurred on August 6, 2026, making approximately 911.5 million shares eligible for public trading, which effectively doubled the existing public float. This substantial increase in tradable shares contributed to the stock's decline, particularly in early August when it reached its lowest point post-IPO. Additional tranches of shares were also scheduled for release on September 10 and September 24, 2026.
4. Uncertainty from Potential Tesla Merger Speculation: Comments from Elon Musk in September 2026, hinting at a potential merger between SpaceX and Tesla, introduced a new layer of uncertainty and volatility for SPCX investors. The prospect of combining these two distinct and capital-intensive businesses raised concerns about the strategic rationale and potential dilution for existing shareholders, contributing to a more cautious market sentiment during this period.
Show less
Stock Movement Drivers
Fundamental Drivers
nullnull
Market Drivers
5/31/2026 to 9/20/2026| Return | Correlation | |
|---|---|---|
| SPCX | ||
| Market (SPY) | 0.9% | 43.9% |
| Sector (XLI) | -2.0% | 30.7% |
Fundamental Drivers
nullnull
Market Drivers
2/28/2026 to 9/20/2026| Return | Correlation | |
|---|---|---|
| SPCX | ||
| Market (SPY) | 11.6% | 43.9% |
| Sector (XLI) | -3.9% | 30.7% |
Fundamental Drivers
nullnull
Market Drivers
8/31/2025 to 9/20/2026| Return | Correlation | |
|---|---|---|
| SPCX | ||
| Market (SPY) | 19.4% | 43.9% |
| Sector (XLI) | 12.8% | 30.7% |
Fundamental Drivers
nullnull
Market Drivers
8/31/2023 to 9/20/2026| Return | Correlation | |
|---|---|---|
| SPCX | ||
| Market (SPY) | 75.6% | 43.9% |
| Sector (XLI) | 63.4% | 30.7% |
Price Returns Compared
| 2021 | 2022 | 2023 | 2024 | 2025 | 2026 | Total [1] | |
|---|---|---|---|---|---|---|---|
| Returns | |||||||
| SPCX Return | - | - | - | - | - | -4% | -4% |
| Peers Return | -9% | -14% | 69% | -8% | 88% | -15% | 93% |
| S&P 500 Return | 27% | -19% | 24% | 23% | 16% | 12% | 103% |
Monthly Win Rates [3] | |||||||
| SPCX Win Rate | - | - | - | - | - | 75% | |
| Peers Win Rate | 42% | 50% | 58% | 25% | 52% | 49% | |
| S&P 500 Win Rate | 75% | 42% | 67% | 75% | 67% | 44% | |
Max Drawdowns [4] | |||||||
| SPCX Max Drawdown | - | - | - | - | - | - | |
| Peers Max Drawdown | -51% | -48% | -35% | -33% | -24% | -51% | |
| S&P 500 Max Drawdown | -5% | -25% | -10% | -8% | -19% | -9% | |
[1] Cumulative total returns since the beginning of 2021
[2] Peers: FLY, ATRO, FBDT, LYNX, SPCX.
[3] Win Rate = % of calendar months in which monthly returns were positive
[4] Max drawdown represents maximum peak-to-trough decline within a year
[5] 2026 data is for the year up to 9/18/2026 (YTD)
How Low Can It Go
SPCX has limited trading history. Below is the Industrials sector ETF (XLI) in its place.
| Event | XLI | S&P 500 |
|---|---|---|
| 2025 US Tariff Shock | ||
| % Loss | -15.8% | -18.8% |
| % Gain to Breakeven | 18.8% | 23.1% |
| Time to Breakeven | 34 days | 79 days |
| Summer-Fall 2023 Five Percent Yield Shock | ||
| % Loss | -11.7% | -9.5% |
| % Gain to Breakeven | 13.2% | 10.5% |
| Time to Breakeven | 45 days | 24 days |
| 2022 Inflation Shock & Fed Tightening | ||
| % Loss | -20.1% | -24.5% |
| % Gain to Breakeven | 25.1% | 32.4% |
| Time to Breakeven | 125 days | 427 days |
| 2020 COVID-19 Crash | ||
| % Loss | -41.6% | -33.7% |
| % Gain to Breakeven | 71.2% | 50.9% |
| Time to Breakeven | 231 days | 140 days |
| Q4 2018 Fed Policy Error / Growth Scare | ||
| % Loss | -23.7% | -19.2% |
| % Gain to Breakeven | 31.1% | 23.8% |
| Time to Breakeven | 120 days | 105 days |
| 2015-2016 China Devaluation / Global Growth Scare | ||
| % Loss | -11.1% | -12.2% |
| % Gain to Breakeven | 12.5% | 13.9% |
| Time to Breakeven | 51 days | 62 days |
In The Past
State Street Industrial Select Sector SPDR ETF's stock fell -15.8% during the 2025 US Tariff Shock. Such a loss loss requires a 18.8% gain to breakeven.
Preserve Wealth
Limiting losses and compounding gains is essential to preserving wealth.
Asset Allocation
Actively managed asset allocation strategies protect wealth. Learn more.
SPCX has limited trading history. Below is the Industrials sector ETF (XLI) in its place.
| Event | XLI | S&P 500 |
|---|---|---|
| 2022 Inflation Shock & Fed Tightening | ||
| % Loss | -20.1% | -24.5% |
| % Gain to Breakeven | 25.1% | 32.4% |
| Time to Breakeven | 125 days | 427 days |
| 2020 COVID-19 Crash | ||
| % Loss | -41.6% | -33.7% |
| % Gain to Breakeven | 71.2% | 50.9% |
| Time to Breakeven | 231 days | 140 days |
| Q4 2018 Fed Policy Error / Growth Scare | ||
| % Loss | -23.7% | -19.2% |
| % Gain to Breakeven | 31.1% | 23.8% |
| Time to Breakeven | 120 days | 105 days |
| 2011 US Debt Ceiling Crisis & European Contagion | ||
| % Loss | -22.5% | -17.9% |
| % Gain to Breakeven | 29.0% | 21.8% |
| Time to Breakeven | 114 days | 123 days |
| 2008-2009 Global Financial Crisis | ||
| % Loss | -60.5% | -53.4% |
| % Gain to Breakeven | 153.2% | 114.4% |
| Time to Breakeven | 700 days | 1085 days |
In The Past
State Street Industrial Select Sector SPDR ETF's stock fell -15.8% during the 2025 US Tariff Shock. Such a loss loss requires a 18.8% gain to breakeven.
Preserve Wealth
Limiting losses and compounding gains is essential to preserving wealth.
Asset Allocation
Actively managed asset allocation strategies protect wealth. Learn more.
About Space Exploration Technologies (SPCX)
Space Exploration Technologies (SPCX) is a vertically integrated technology company dedicated to advancing humanity's future across space, global connectivity, and artificial intelligence (AI). Its overarching mission is to enable multiplanetary life, deepen our understanding of the universe, and extend consciousness, achieved by designing, manufacturing, launching, and operating advanced hardware and software infrastructure. The company uniquely combines these capabilities to build foundational technologies that are redefining existing industries and creating new ones.
SPCX's core operations are divided into three main segments. The Space segment offers revolutionary, affordable access to orbit using its highly successful Falcon family of reusable rockets, and is developing the next-generation Starship. It transports satellites, astronauts, and other payloads for government and commercial clients worldwide. Its Connectivity segment, powered by the Starlink constellation of approximately 9,600 satellites, delivers high-speed, low-latency broadband internet to millions of consumers, enterprises, and governments in 164 markets, particularly prioritizing underserved rural and remote communities. Additionally, a dedicated satellite-to-mobile constellation provides connectivity services in mobile "dead zones."
The AI segment, incorporating xAI and its frontier model Grok, focuses on developing truth-seeking AI for scientific discovery and advanced reasoning. SPCX is rapidly building gigawatt-scale AI compute infrastructure, with ambitious plans to extend this into space with orbital AI compute satellites by 2028. Grok benefits from deep integration with the X platform, leveraging real-time data for enhanced capabilities. This strategic convergence of SPCX's launch capabilities, global connectivity network, and advanced AI development aims to unlock unprecedented economic expansion and utilize AI as a transformative force for understanding the universe and improving human life.
AI Analysis | Feedback
Here are 1-3 brief analogies for Space Exploration Technologies (SPCX):
- Like Tesla, but for rockets, global internet, and advanced AI.
- The Amazon Web Services (AWS) of space and AI, building foundational infrastructure for humanity's future on Earth and beyond.
AI Analysis | Feedback
Space Launch Services: SpaceX provides reliable and affordable access to space for various payloads, including satellites and astronauts, using its Falcon family of reusable rockets and developing Starship.
Starlink Broadband Internet Service: This global network delivers high-speed, low-latency internet connectivity, primarily targeting underserved rural and remote communities, through its constellation of LEO satellites.
Starlink Satellite-to-Mobile Connectivity: Offering direct data, voice, and messaging services from dedicated satellites to standard mobile devices, substantially reducing "dead zones" worldwide.
Grok AI Model: A truth-seeking artificial intelligence model focused on scientific discovery and understanding the universe, which benefits from real-time data integration with the X platform.
AI Compute Infrastructure: SpaceX designs, builds, and operates advanced compute infrastructure for AI model training and inference, with plans to extend these capabilities to orbital data centers.
Starlink Kits: Essential hardware components, including a dish and router, that enable customers to connect to the Starlink broadband internet network.
AI Analysis | Feedback
Space Exploration Technologies (SPCX) serves a diverse customer base across its various segments. Based on the provided description, the company primarily serves the following three categories of customers:
- Consumer Customers: This category includes millions of individuals who subscribe to Starlink for high-speed, low-latency global broadband internet, especially in underserved rural and remote communities. Additionally, Grok's AI features and the X platform are utilized by millions of monthly active users, falling under the consumer category for AI applications.
- Enterprise Customers: SpaceX provides connectivity services through Starlink to businesses and organizations. The AI segment also targets enterprise AI applications with Grok, indicating businesses as a key customer type for its advanced AI models and compute infrastructure.
- Government Customers: SpaceX's Space segment transports astronauts, satellites, and other payloads on missions, including those for government agencies (e.g., NASA, defense departments). Starlink also delivers connectivity to government customers across various markets.
AI Analysis | Feedback
AI Analysis | Feedback
Elon Musk founded Space Exploration Technologies (SpaceX) in 2002 to advance space exploration. He also co-founded Zip2 in 1995, which was acquired by Compaq Computer Corporation in 1999 for $307 million, and co-founded PayPal (originally X.com) in 1999, which eBay acquired for $1.5 billion in 2002. Musk currently serves as CEO of Tesla, Inc., founder and CEO of xAI (acquired by SpaceX in early 2026), and founder and CTO of X Corp. (formerly Twitter). He is also a co-founder of Neuralink and The Boring Company.
Gwynne Shotwell, President and Chief Operating Officer
Gwynne Shotwell joined SpaceX in 2002 as the 11th employee and Vice President of Business Development. As President and COO, she manages all non-engineering aspects of the company, including legal, finance, sales, and operations, and is responsible for day-to-day operations and company growth. Prior to SpaceX, she spent over 10 years at The Aerospace Corporation in various roles in Space Systems Engineering, Technology, and Project Management, and also served as director of the space systems division at Microcosm Inc.
Bret Johnsen, Chief Financial Officer
Bret Johnsen has served as the Chief Financial Officer of Space Exploration Technologies (SpaceX) since joining in 2011, overseeing the company's financial strategy, planning, risk management, and capital structure. Before his tenure at SpaceX, he spent nearly a decade at Broadcom, advancing to Corporate Controller, and also held the position of Senior Vice President and CFO for Mindspeed Technologies. His experience includes extensive financial leadership in high-growth technology and publicly traded companies.
Phil Alden, Vice President of Starship Production
Phil Alden is responsible for overseeing the manufacturing and production processes of the Starship spacecraft. His expertise lies in production engineering and manufacturing systems. Before his current role, he held positions such as VP of Starlink Production and Senior Director of Production at Space Exploration Technologies (SpaceX), and also had leadership roles at BMW and Jaguar Land Rover.
Kiko Dontchev, Vice President of Launch
Kiko Dontchev oversees Space Exploration Technologies' (SpaceX) launch and recovery operations across sites in California and Florida, ensuring the safety, precision, and operational reliability of all launch missions. He began his career at SpaceX in 2010, initially focusing on developing lithium-ion batteries before transitioning to leadership in launch operations.
AI Analysis | Feedback
Key Risks to Space Exploration Technologies (SPCX)
- Significant Investment in Next-Generation Starship Program with No Guaranteed Returns: The Space segment is funding substantial research and development expenses for its next-generation Starship launch vehicle program, with $930 million in Q1 2026 and $3,004 million in 2025. This program, while key to the company's long-term growth strategy, represents a significant capital outlay with its success and return on investment yet to be fully realized, posing a financial risk.
- Early Stage and High Investment in AI Segment with Sustained Losses: The newly acquired AI segment is in an early stage of development and is currently operating at a significant loss. For the three months ended March 31, 2026, it generated a loss from operations of $(2,469) million and Segment Adjusted EBITDA of $(609) million, with even larger losses in 2025. Capital expenditures for the AI segment were also extremely high, at $7,723 million in Q1 2026 and $12,727 million in 2025. This indicates a high-risk, high-investment strategy with no immediate profitability, requiring sustained capital infusion and carrying the risk of future losses if market adoption or technological advancements do not meet expectations.
- Intense Capital Expenditure Requirements Across All Segments: SpaceX has exceptionally high capital expenditure requirements across all its segments. For the three months ended March 31, 2026, capital expenditures were $1,052 million for Space, $1,332 million for Connectivity, and a staggering $7,723 million for AI. Similarly, in 2025, these figures were $3,832 million for Space, $4,178 million for Connectivity, and $12,727 million for AI. These massive and ongoing capital investments are necessary to maintain and expand its operations and develop new technologies, but they also represent a significant drain on cash flow and expose the company to considerable financial risk if growth or profitability targets are not met.
AI Analysis | Feedback
The rapid advancement and intensifying compute arms race by other leading model providers in the AI industry. While Space Exploration Technologies states that its Grok model achieved "frontier-level performance... on a faster timeline than reported by other leading model providers" and claims a "dual advantage in both cost efficiency and deployment speed at scale" for its compute infrastructure, the existence and rapid progress of these "other leading model providers" represent a continuous and dynamic threat. The massive capital expenditures required for AI compute infrastructure, totaling $7,723 million for the three months ended March 31, 2026, and $12,727 million in 2025, underscore the immense investment needed to compete at the frontier. Should these competitors develop more advanced frontier AI models or superior compute capabilities, they could erode xAI's competitive advantages and challenge Grok's market position.
AI Analysis | Feedback
AI Analysis | Feedback
Space Exploration Technologies (SPCX) is expected to drive future revenue growth over the next 2-3 years through several key areas:
- Expansion of Starlink Connectivity Services: Starlink, primarily within the Connectivity segment, is expected to continue its rapid growth through subscriber acquisition and increasing enterprise adoption. The company explicitly states its intent to expand global access to high-speed internet, prioritizing underserved rural and remote communities. The deployment of Starlink Mobile constellation with satellite-to-mobile capabilities, which began in January 2024, is also a significant driver, aimed at reducing mobile "dead zones" and serving millions of unique devices across more countries.
- Advancement and Commercialization of Starship: The Space segment's significant investment in research and development for the next-generation Starship launch vehicle program is a crucial long-term growth driver. Starship is designed to enable a "step-function change in launch capability across reusability, payload capacity, and launch cadence," which will unlock entirely new categories of missions and revenue streams, fundamentally altering the economics of space access.
- Growth and Monetization of the AI Segment (xAI and Grok): The newly acquired xAI, with its Grok frontier model, is poised for substantial growth. SpaceX plans to prioritize investment in AI applications and compute infrastructure. The rapid construction of AI compute infrastructure, the integration of Grok with X (for real-time data and distribution), and the focus on truth-seeking AI for high-frequency, high-value use cases across consumer and enterprise applications are all expected to generate increasing revenue as the segment matures.
- Deployment of Orbital AI Compute Satellites: A significant future revenue driver is the planned deployment of orbital AI compute satellites, expected to begin as early as 2028. These satellites, leveraging SpaceX's launch capabilities and Starlink's connectivity, are intended to handle energy-intensive AI workloads at greater scale and efficiency than terrestrial alternatives, creating a new market for "orbital data centers" and delivering real-time intelligence globally. This represents a new product/service offering that integrates its core competencies.
AI Analysis | Feedback
Outbound Investments
- SpaceX acquired xAI in early 2026, integrating the AI company, founded in 2023, into its vertically integrated structure.
- The acquisition of xAI aims to unite SpaceX’s launch capabilities and global connectivity network with xAI’s AI development.
Capital Expenditures
- Capital expenditures in 2025 totaled $3,832 million for the Space segment, $4,178 million for the Connectivity segment, and $12,727 million for the AI segment.
- For the three months ended March 31, 2026, capital expenditures included $1,052 million for Space, $1,332 million for Connectivity, and $7,723 million for AI.
- A primary focus of these expenditures includes the Starship launch vehicle program and the rapid construction of AI compute infrastructure, with plans to deploy orbital AI compute satellites starting as early as 2028.
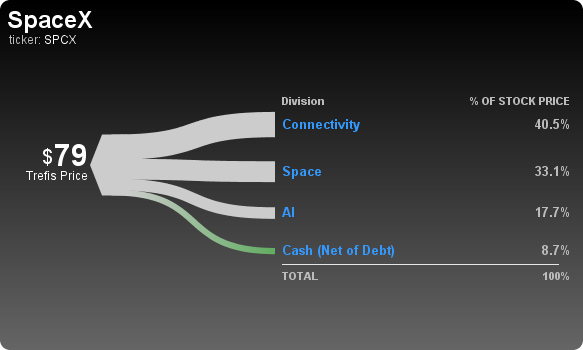
Peer Outperformance in Aerospace & Defense
null| Industry | Names | 1Y med | 3Y med | 5Y med | Top 3 by 5Y |
|---|---|---|---|---|---|
| Construction & Engineering | 31 | 7.0% | 104.6% | 189.6% | FIX 2338% · STRL 2296% · CDNL 2275% |
| Marine Transportation | 5 | 88.1% | 65.8% | 180.5% | HOS 44163% · MATX 208% · SFL 181% |
| Construction Machinery & Heavy Transportation Equipment | 13 | 11.7% | 58.9% | 128.8% | CAT 364% · ALSN 258% · WAB 236% |
| Aerospace & Defense ← | 55 | -6.5% | 68.9% | 75.0% | ATI 1076% · FTAI 1008% · HWM 661% |
| Rail Transportation | 7 | 29.3% | 58.4% | 59.0% | FSTR 147% · CSX 70% · RAIL 69% |
| Trading Companies & Distributors | 19 | 4.3% | 37.2% | 50.9% | DXPE 581% · AIT 305% · WCC 222% |
| Industrial Machinery & Supplies & Components | 72 | 9.1% | 51.5% | 43.2% | CRS 1278% · PSIX 1091% · EROC 652% |
| Diversified Support Services | 33 | 13.4% | 34.2% | 36.0% | LIME 3498% · TH 459% · WLFC 363% |
| Passenger Ground Transportation | 3 | -28.4% | 46.2% | 31.6% | UBER 59% · CAR 32% · LYFT -72% |
| Cargo Ground Transportation | 16 | 34.4% | 2.3% | 27.6% | R 251% · XPO 242% · CVLG 163% |
| Electrical Components & Equipment | 41 | 3.4% | 58.5% | 24.2% | POWL 2383% · BE 1333% · VRT 958% |
| Building Products | 33 | -14.7% | 3.4% | 20.0% | LMB 728% · GFF 398% · PPIH 301% |
| Industrial Conglomerates | 17 | 7.9% | 6.5% | 7.9% | RCMT 524% · CSW 142% · DD 76% |
| Agricultural & Farm Machinery | 17 | 6.4% | 4.5% | -2.4% | BLBD 214% · DE 117% · GENC 58% |
| Environmental & Facilities Services | 29 | -11.1% | 24.2% | -7.2% | CECO 929% · ADUR 404% · NVRI 376% |
| Research & Consulting Services | 13 | -12.7% | -22.8% | -10.5% | HURN 219% · CRAI 92% · GRNQ 67% |
| Data Processing & Outsourced Services | 6 | -33.4% | -14.8% | -24.6% | EXLS 46% · BR 10% · G -23% |
| Passenger Airlines | 11 | 3.2% | 13.3% | -27.7% | LTM 3169% · UAL 145% · SKYW 113% |
| Office Services & Supplies | 9 | 7.4% | 12.6% | -32.7% | PBI 202% · TILE 148% · HNI 51% |
| Human Resource & Employment Services | 22 | 6.5% | -15.5% | -36.3% | BBSI 89% · ADP 54% · PAYX 25% |
| Air Freight & Logistics | 12 | -18.0% | -19.7% | -39.1% | CHRW 97% · EXPD 67% · FDX 66% |
| Security & Alarm Services | 10 | -37.7% | 22.8% | -44.9% | CIX 157% · MG 128% · BCO 68% |
| Airport Services | 3 | -75.1% | -78.7% | -61.9% | JOBY -35% · ASLE -62% · UP -100% |
Research & Analysis
Invest in Strategies
Wealth Management
Peer Comparisons
| Peers to compare with: |
Financials
| Median | |
|---|---|
| Name | |
| Mkt Price | 20.97 |
| Mkt Cap | 3.4 |
| Rev LTM | 615 |
| Op Inc LTM | -184 |
| FCF LTM | -167 |
| FCF 3Y Avg | 27 |
| CFO LTM | 48 |
| CFO 3Y Avg | 48 |
Growth & Margins
| Median | |
|---|---|
| Name | |
| Rev Chg LTM | 96.8% |
| Rev Chg 3Y Avg | 15.0% |
| Rev Chg Q | 341.9% |
| QoQ Delta Rev Chg LTM | 30.7% |
| Op Inc Chg LTM | 103.5% |
| Op Inc Chg 3Y Avg | 556.3% |
| Op Mgn LTM | -65.8% |
| Op Mgn 3Y Avg | 6.0% |
| QoQ Delta Op Mgn LTM | 23.1% |
| CFO/Rev LTM | -40.6% |
| CFO/Rev 3Y Avg | 5.2% |
| FCF/Rev LTM | -135.6% |
| FCF/Rev 3Y Avg | 3.0% |
Segment Financials
Revenue by Segment| $ Mil | 2025 | 2024 | 2023 |
|---|---|---|---|
| Connectivity | 11,387 | 7,599 | 3,869 |
| Space | 4,086 | 3,796 | 3,557 |
| Artificial intelligence (AI) | 3,201 | 2,620 | 2,961 |
| Total | 18,674 | 14,015 | 10,387 |
| $ Mil | 2025 | 2024 | 2023 |
|---|---|---|---|
| Connectivity | 4,423 | 2,006 | 469 |
| Space | -657 | 21 | -1 |
| Artificial intelligence (AI) | -6,355 | -1,561 | -3,973 |
| Total | -2,589 | 466 | -3,505 |
Price Behavior
| 1M | 2M | 3M | 6M | 1Y | 3Y | |
|---|---|---|---|---|---|---|
| Beta | 4.51 | 2.76 | 1.35 | 0.51 | 0.62 | -0.52 |
| Up Beta | 3.57 | 2.83 | -2.96 | -2.63 | 1.27 | 1.31 |
| Down Beta | 4.35 | 1.37 | -1.44 | 1.12 | -2.20 | -0.88 |
| Up Capture | 723% | 263% | 311% | 118% | 54% | 5% |
| Bmk +ve Days | 10 | 21 | 32 | 68 | 138 | 427 |
| Stock +ve Days | 13 | 18 | 24 | 24 | 24 | 24 |
| Down Capture | 277% | 345% | 270% | 157% | 98% | 55% |
| Bmk -ve Days | 11 | 21 | 32 | 59 | 113 | 324 |
| Stock -ve Days | 8 | 24 | 30 | 30 | 30 | 30 |
[1] Upside and downside betas calculated using positive and negative benchmark daily returns respectively
Based On 1-Year Data
| Annualized Return | Annualized Volatility | Sharpe Ratio | Correlation with SPCX | |
|---|---|---|---|---|
| SPCX | -5.1% | 87.9% | 0.15 | - |
| Sector ETF (XLI) | 13.5% | 17.2% | 0.57 | 30.7% |
| Equity (SPY) | 16.9% | 12.9% | 0.94 | 43.9% |
| Gold (GLD) | 19.1% | 29.3% | 0.60 | 15.7% |
| Commodities (DBC) | 46.3% | 20.6% | 1.73 | -12.3% |
| Real Estate (VNQ) | 4.9% | 13.6% | 0.10 | -10.3% |
| Bitcoin (BTCUSD) | -30.6% | 44.3% | -0.70 | 11.8% |
Smart multi-asset allocation framework can stack odds in your favor. Learn How
Based On 5-Year Data
| Annualized Return | Annualized Volatility | Sharpe Ratio | Correlation with SPCX | |
|---|---|---|---|---|
| SPCX | -1.0% | 87.9% | 0.15 | - |
| Sector ETF (XLI) | 12.4% | 17.6% | 0.54 | 30.7% |
| Equity (SPY) | 12.9% | 17.2% | 0.57 | 43.9% |
| Gold (GLD) | 19.1% | 18.8% | 0.83 | 15.7% |
| Commodities (DBC) | 11.2% | 19.5% | 0.45 | -12.3% |
| Real Estate (VNQ) | 1.1% | 18.8% | -0.05 | -10.3% |
| Bitcoin (BTCUSD) | 12.5% | 52.5% | 0.42 | 11.8% |
Smart multi-asset allocation framework can stack odds in your favor. Learn How
Based On 10-Year Data
| Annualized Return | Annualized Volatility | Sharpe Ratio | Correlation with SPCX | |
|---|---|---|---|---|
| SPCX | -0.5% | 87.9% | 0.15 | - |
| Sector ETF (XLI) | 13.1% | 20.1% | 0.57 | 30.7% |
| Equity (SPY) | 15.1% | 18.0% | 0.72 | 43.9% |
| Gold (GLD) | 12.1% | 16.4% | 0.61 | 15.7% |
| Commodities (DBC) | 8.3% | 18.1% | 0.37 | -12.3% |
| Real Estate (VNQ) | 4.4% | 20.7% | 0.18 | -10.3% |
| Bitcoin (BTCUSD) | 62.6% | 66.2% | 1.02 | 11.8% |
Smart multi-asset allocation framework can stack odds in your favor. Learn How
Earnings Returns History
Updated 9/4/2026| Forward Returns | |||
|---|---|---|---|
| Earnings Date | 1D Returns | 5D Returns | 21D Returns |
| 8/4/2026 | -13.6% | 6.4% | 12.3% |
| SUMMARY STATS | |||
| # Positive | 0 | 1 | 1 |
| # Negative | 1 | 0 | 0 |
| Median Positive | 6.4% | 12.3% | |
| Median Negative | -13.6% | ||
| Max Positive | 6.4% | 12.3% | |
| Max Negative | -13.6% | ||
| Forward Returns | |||
|---|---|---|---|
| Earnings Date | 1D Returns | 5D Returns | 21D Returns |
| 8/4/2026 | -13.6% | 6.4% | 12.3% |
| SUMMARY STATS | |||
| # Positive | 0 | 1 | 1 |
| # Negative | 1 | 0 | 0 |
| Median Positive | 6.4% | 12.3% | |
| Median Negative | -13.6% | ||
| Max Positive | 6.4% | 12.3% | |
| Max Negative | -13.6% | ||
Insider Activity
Updated 9/15/2026| # | Owner | Title | Holding | Action | Filing Date | Price | Shares | Transacted Value | Value of Held Shares | Form |
|---|---|---|---|---|---|---|---|---|---|---|
| 1 | Musk, Elon | CEO, CTO & Chairman | Elon Musk Revocable Trust | Sell | 6172026 | 105.32 | 11,390 | 1,199,572 | 55,414,740,256 | Form |
| # | Owner | Title | Holding | Action | Filing Date | Price | Shares | Transacted Value | Value of Held Shares | Form |
|---|---|---|---|---|---|---|---|---|---|---|
| 1 | Musk, Elon | CEO, CTO & Chairman | Elon Musk Revocable Trust | Sell | 6172026 | 105.32 | 11,390 | 1,199,572 | 55,414,740,256 | Form |
Space Exploration Technologies — Investor Video Playlist


Industry Resources
| Industrials Resources |
| IndustryWeek |
| Manufacturing.net |
| Aviation Week |
| Aerospace & Defense Resources |
| Defense News |
| FlightGlobal |
External Quote Links
| Y Finance | Barrons |
| TradingView | Morningstar |
| SeekingAlpha | ValueLine |
| Motley Fool | Robinhood |
| CNBC | Etrade |
| MarketWatch | Unusual Whales |
| YCharts | Perplexity Finance |
| FinViz |
Prefer one of these to Trefis? Tell us why.