
Canadian Pacific Kansas City (CP)
Market Price (8/19/2026): $93.68 | Market Cap: $83.0 BilSector: Industrials | Industry: Rail Transportation
Canadian Pacific Kansas City (CP)
Market Price (8/19/2026): $93.68Market Cap: $83.0 BilSector: IndustrialsIndustry: Rail Transportation
Investment Highlights Why It Matters Detailed financial logic regarding cash flow yields vs trend-riding momentum.
Attractive yieldTotal YieldTotal Yield = Earnings Yield + Dividend Yield, Earnings Yield = Net Income / Market Cap Dividend Yield = Total Dividends / Market Cap is 5.6% Attractive operating marginsOp Mgn LTMOperating Margin = Operating Income / Revenue Reflects profitability before taxes and before impact of capital structure (interest payments). is 37% Attractive cash flow generationCFO/Rev LTMCash Flow from Operations / Revenue (Sales), Last Twelve Months (LTM) is 36%, FCF/Rev LTMFree Cash Flow / Revenue (Sales), Last Twelve Months (LTM) is 16%, CFO LTM is 5.5 Bil, FCF LTM is 2.4 Bil Stock buyback supportStock Buyback 3Y Total is 5.9 Bil Low stock price volatilityVol 12M is 23% Megatrend and thematic driversMegatrends include Future of Freight, E-commerce & DTC Adoption, Automation & Robotics, Sustainable Resource Management, Show more. | Trading close to highsDist 52W High is -0.3%, Dist 3Y High is -0.3% Weak multi-year price returns2Y Excs Rtn is -19%, 3Y Excs Rtn is -54% | Key risksCP key risks include [1] challenges integrating the Kansas City Southern acquisition and satisfying related regulatory conditions, Show more. |
| Attractive yieldTotal YieldTotal Yield = Earnings Yield + Dividend Yield, Earnings Yield = Net Income / Market Cap Dividend Yield = Total Dividends / Market Cap is 5.6% |
| Attractive operating marginsOp Mgn LTMOperating Margin = Operating Income / Revenue Reflects profitability before taxes and before impact of capital structure (interest payments). is 37% |
| Attractive cash flow generationCFO/Rev LTMCash Flow from Operations / Revenue (Sales), Last Twelve Months (LTM) is 36%, FCF/Rev LTMFree Cash Flow / Revenue (Sales), Last Twelve Months (LTM) is 16%, CFO LTM is 5.5 Bil, FCF LTM is 2.4 Bil |
| Stock buyback supportStock Buyback 3Y Total is 5.9 Bil |
| Low stock price volatilityVol 12M is 23% |
| Megatrend and thematic driversMegatrends include Future of Freight, E-commerce & DTC Adoption, Automation & Robotics, Sustainable Resource Management, Show more. |
| Trading close to highsDist 52W High is -0.3%, Dist 3Y High is -0.3% |
| Weak multi-year price returns2Y Excs Rtn is -19%, 3Y Excs Rtn is -54% |
| Key risksCP key risks include [1] challenges integrating the Kansas City Southern acquisition and satisfying related regulatory conditions, Show more. |
Qualitative Assessment
AI Analysis | Feedback
Canadian Pacific Kansas City (CP) stock has gained about 10% since 4/30/2026 because of the following key factors:
1. Robust Fiscal Q2 2026 Earnings Performance and Optimistic Guidance.
Canadian Pacific Kansas City (CP) reported stronger-than-expected results for fiscal Q2 2026 (period ending June 30, 2026), with diluted earnings per share (EPS) of $0.92, surpassing analysts' consensus estimates of $0.89 by 3.4%. Quarterly revenue also increased by 12.6% year-over-year to $2.93 billion, exceeding estimates of $2.89 billion. Management further bolstered confidence by reaffirming expectations for accelerated volume and earnings growth in the second half of 2026.
2. Record-Breaking Canadian Grain Volumes.
CPKC achieved an all-time record for transporting Canadian grain and grain products in the 2025-2026 crop year, moving 30.66 million metric tonnes (MMT), an 11% increase over the previous crop year. This strong performance included setting quarterly records in fiscal Q1 and fiscal Q2 2026, and monthly records in April, May, and June 2026, indicating robust freight demand across its network.
Show more
Canadian Pacific Kansas City (CP) stock has gained about 10% since 4/30/2026 because of the following key factors:
1. Robust Fiscal Q2 2026 Earnings Performance and Optimistic Guidance.
Canadian Pacific Kansas City (CP) reported stronger-than-expected results for fiscal Q2 2026 (period ending June 30, 2026), with diluted earnings per share (EPS) of $0.92, surpassing analysts' consensus estimates of $0.89 by 3.4%. Quarterly revenue also increased by 12.6% year-over-year to $2.93 billion, exceeding estimates of $2.89 billion. Management further bolstered confidence by reaffirming expectations for accelerated volume and earnings growth in the second half of 2026.
2. Record-Breaking Canadian Grain Volumes.
CPKC achieved an all-time record for transporting Canadian grain and grain products in the 2025-2026 crop year, moving 30.66 million metric tonnes (MMT), an 11% increase over the previous crop year. This strong performance included setting quarterly records in fiscal Q1 and fiscal Q2 2026, and monthly records in April, May, and June 2026, indicating robust freight demand across its network.
3. Positive Analyst Upgrades and Increased Price Targets.
During the specified period, several financial analysts reaffirmed positive outlooks and raised price targets for CP. For example, Wells Fargo & Company increased its price target from $90.00 to $100.00 in July, and Raymond James raised its target to C$140 from C$125 in July, citing strong rail traffic. The consensus rating remained a "Moderate Buy" with an average target price of $108.60, reflecting sustained investor confidence.
Show less
Stock Movement Drivers
Fundamental Drivers
The 8.0% change in CP stock from 4/30/2026 to 8/18/2026 was primarily driven by a 12.5% change in the company's P/E Multiple.| (LTM values as of) | 4302026 | 8182026 | Change |
|---|---|---|---|
| Stock Price ($) | 86.77 | 93.68 | 8.0% |
| Change Contribution By: | |||
| Total Revenues ($ Mil) | 14,984 | 15,449 | 3.1% |
| Net Income Margin (%) | 27.2% | 25.0% | -8.0% |
| P/E Multiple | 19.1 | 21.5 | 12.5% |
| Shares Outstanding (Mil) | 897 | 886 | 1.2% |
| Cumulative Contribution | 8.0% |
Market Drivers
4/30/2026 to 8/18/2026| Return | Correlation | |
|---|---|---|
| CP | 8.0% | |
| Market (SPY) | 6.8% | 10.1% |
| Sector (XLI) | 5.1% | 28.4% |
Fundamental Drivers
The 26.6% change in CP stock from 1/31/2026 to 8/18/2026 was primarily driven by a 35.9% change in the company's P/E Multiple.| (LTM values as of) | 1312026 | 8182026 | Change |
|---|---|---|---|
| Stock Price ($) | 74.03 | 93.68 | 26.6% |
| Change Contribution By: | |||
| Total Revenues ($ Mil) | 15,029 | 15,449 | 2.8% |
| Net Income Margin (%) | 28.4% | 25.0% | -11.8% |
| P/E Multiple | 15.8 | 21.5 | 35.9% |
| Shares Outstanding (Mil) | 910 | 886 | 2.7% |
| Cumulative Contribution | 26.6% |
Market Drivers
1/31/2026 to 8/18/2026| Return | Correlation | |
|---|---|---|
| CP | 26.6% | |
| Market (SPY) | 11.2% | 22.7% |
| Sector (XLI) | 11.3% | 46.7% |
Fundamental Drivers
The 28.5% change in CP stock from 7/31/2025 to 8/18/2026 was primarily driven by a 33.3% change in the company's P/E Multiple.| (LTM values as of) | 7312025 | 8182026 | Change |
|---|---|---|---|
| Stock Price ($) | 72.91 | 93.68 | 28.5% |
| Change Contribution By: | |||
| Total Revenues ($ Mil) | 14,917 | 15,449 | 3.6% |
| Net Income Margin (%) | 28.0% | 25.0% | -10.7% |
| P/E Multiple | 16.1 | 21.5 | 33.3% |
| Shares Outstanding (Mil) | 924 | 886 | 4.2% |
| Cumulative Contribution | 28.5% |
Market Drivers
7/31/2025 to 8/18/2026| Return | Correlation | |
|---|---|---|
| CP | 28.5% | |
| Market (SPY) | 22.4% | 28.0% |
| Sector (XLI) | 22.0% | 47.7% |
Fundamental Drivers
The 16.5% change in CP stock from 7/31/2023 to 8/18/2026 was primarily driven by a 51.3% change in the company's Total Revenues ($ Mil).| (LTM values as of) | 7312023 | 8182026 | Change |
|---|---|---|---|
| Stock Price ($) | 80.40 | 93.68 | 16.5% |
| Change Contribution By: | |||
| Total Revenues ($ Mil) | 10,214 | 15,449 | 51.3% |
| Net Income Margin (%) | 42.0% | 25.0% | -40.3% |
| P/E Multiple | 17.5 | 21.5 | 22.9% |
| Shares Outstanding (Mil) | 931 | 886 | 5.1% |
| Cumulative Contribution | 16.5% |
Market Drivers
7/31/2023 to 8/18/2026| Return | Correlation | |
|---|---|---|
| CP | 16.5% | |
| Market (SPY) | 73.6% | 45.8% |
| Sector (XLI) | 73.2% | 54.3% |
Price Returns Compared
| 2021 | 2022 | 2023 | 2024 | 2025 | 2026 | Total [1] | |
|---|---|---|---|---|---|---|---|
| Returns | |||||||
| CP Return | 5% | 5% | 7% | -8% | 3% | 28% | 41% |
| Peers Return | 22% | -12% | 10% | -7% | 11% | 30% | 59% |
| S&P 500 Return | 27% | -19% | 24% | 23% | 16% | 13% | 106% |
Monthly Win Rates [3] | |||||||
| CP Win Rate | 42% | 33% | 58% | 50% | 50% | 75% | |
| Peers Win Rate | 52% | 38% | 50% | 44% | 56% | 72% | |
| S&P 500 Win Rate | 75% | 42% | 67% | 75% | 67% | 50% | |
Max Drawdowns [4] | |||||||
| CP Max Drawdown | -22% | -20% | -17% | -22% | -17% | -13% | |
| Peers Max Drawdown | -15% | -28% | -18% | -18% | -18% | -12% | |
| S&P 500 Max Drawdown | -5% | -25% | -10% | -8% | -19% | -9% | |
[1] Cumulative total returns since the beginning of 2021
[2] Peers: UNP, CNI, CSX, NSC.
[3] Win Rate = % of calendar months in which monthly returns were positive
[4] Max drawdown represents maximum peak-to-trough decline within a year
[5] 2026 data is for the year up to 8/18/2026 (YTD)
How Low Can It Go
| Event | CP | S&P 500 |
|---|---|---|
| 2025 US Tariff Shock | ||
| % Loss | -14.1% | -18.8% |
| % Gain to Breakeven | 16.4% | 23.1% |
| Time to Breakeven | 35 days | 79 days |
| Summer-Fall 2023 Five Percent Yield Shock | ||
| % Loss | -16.0% | -9.5% |
| % Gain to Breakeven | 19.1% | 10.5% |
| Time to Breakeven | 100 days | 24 days |
| 2020 COVID-19 Crash | ||
| % Loss | -32.9% | -33.7% |
| % Gain to Breakeven | 49.0% | 50.9% |
| Time to Breakeven | 116 days | 140 days |
| Q4 2018 Fed Policy Error / Growth Scare | ||
| % Loss | -20.4% | -19.2% |
| % Gain to Breakeven | 25.7% | 23.8% |
| Time to Breakeven | 107 days | 105 days |
| 2015-2016 China Devaluation / Global Growth Scare | ||
| % Loss | -33.5% | -12.2% |
| % Gain to Breakeven | 50.3% | 13.9% |
| Time to Breakeven | 231 days | 62 days |
| 2014-2016 Oil Price Collapse | ||
| % Loss | -47.5% | -6.8% |
| % Gain to Breakeven | 90.6% | 7.3% |
| Time to Breakeven | 874 days | 15 days |
In The Past
Canadian Pacific Kansas City's stock fell -14.1% during the 2025 US Tariff Shock. Such a loss loss requires a 16.4% gain to breakeven.
Preserve Wealth
Limiting losses and compounding gains is essential to preserving wealth.
Asset Allocation
Actively managed asset allocation strategies protect wealth. Learn more.
| Event | CP | S&P 500 |
|---|---|---|
| 2020 COVID-19 Crash | ||
| % Loss | -32.9% | -33.7% |
| % Gain to Breakeven | 49.0% | 50.9% |
| Time to Breakeven | 116 days | 140 days |
| Q4 2018 Fed Policy Error / Growth Scare | ||
| % Loss | -20.4% | -19.2% |
| % Gain to Breakeven | 25.7% | 23.8% |
| Time to Breakeven | 107 days | 105 days |
| 2015-2016 China Devaluation / Global Growth Scare | ||
| % Loss | -33.5% | -12.2% |
| % Gain to Breakeven | 50.3% | 13.9% |
| Time to Breakeven | 231 days | 62 days |
| 2014-2016 Oil Price Collapse | ||
| % Loss | -47.5% | -6.8% |
| % Gain to Breakeven | 90.6% | 7.3% |
| Time to Breakeven | 874 days | 15 days |
| 2011 US Debt Ceiling Crisis & European Contagion | ||
| % Loss | -27.8% | -17.9% |
| % Gain to Breakeven | 38.6% | 21.8% |
| Time to Breakeven | 36 days | 123 days |
| 2008-2009 Global Financial Crisis | ||
| % Loss | -60.3% | -53.4% |
| % Gain to Breakeven | 152.0% | 114.4% |
| Time to Breakeven | 555 days | 1085 days |
In The Past
Canadian Pacific Kansas City's stock fell -14.1% during the 2025 US Tariff Shock. Such a loss loss requires a 16.4% gain to breakeven.
Preserve Wealth
Limiting losses and compounding gains is essential to preserving wealth.
Asset Allocation
Actively managed asset allocation strategies protect wealth. Learn more.
About Canadian Pacific Kansas City (CP)
Canadian Pacific Kansas City (CP) is a major North American railway company that owns and operates an extensive transcontinental freight railway network across Canada and the United States. The company's core business involves providing essential rail and intermodal transportation services through its vast network, which spans approximately 13,000 miles.
CP transports a diverse range of commodities and goods for various industries. This includes bulk commodities such as grain, coal, potash, fertilizers, and sulphur. It also handles a wide array of merchandise freight, supporting sectors like energy, chemicals, plastics, metals, minerals, automotive, and forest products, as well as general consumer goods.
Furthermore, the company plays a significant role in global supply chains by moving intermodal traffic, primarily retail goods shipped in overseas containers. Geographically, CP's services connect and serve key business centers in Quebec and British Columbia in Canada, and extend into the United States, covering the vital Northeast and Midwest regions, thereby facilitating trade across a substantial portion of North America.
AI Analysis | Feedback
Here are 1-3 brief analogies for Canadian Pacific Kansas City (CP):
- The FedEx or UPS of North American rail freight.
- Like Amazon's vast logistics network, but for heavy industrial goods and containers moved by train on its own tracks across North America.
AI Analysis | Feedback
- Freight Rail Transportation: Provides the movement of various goods and commodities across a vast transcontinental railway network.
- Bulk Commodity Transportation: Specializes in hauling large volumes of raw materials such as grain, coal, potash, fertilizers, and sulphur.
- Merchandise Freight Transportation: Offers transport for a diverse range of manufactured and finished goods, including energy, chemicals, metals, automotive, and forest products.
- Intermodal Transportation: Facilitates the movement of retail goods and consumer products in overseas containers, integrating rail with other shipping methods.
AI Analysis | Feedback
Canadian Pacific Kansas City (CP) primarily sells its services to other companies (B2B) rather than individuals. Its major customers are businesses that require freight transportation for bulk commodities, merchandise, and intermodal traffic across Canada and the United States.
Based on the commodities transported and CP's network, major customers typically include companies in the following sectors:
- Agricultural and Fertilizer Companies: Companies that produce, process, or distribute grain, potash, and other fertilizers.
- Nutrien Ltd. (NTR): A leading global producer of potash, nitrogen, and phosphate products, with significant operations in CP's service areas.
- Mining Companies: Businesses involved in the extraction and distribution of coal, metals, and other minerals.
- Teck Resources Ltd. (TECK): A major Canadian mining company, particularly for metallurgical coal, which relies heavily on rail for transport to ports.
- Automotive Manufacturers: Companies that produce and distribute vehicles and automotive parts.
- General Motors (GM): Along with other major automotive manufacturers (e.g., Ford, Stellantis), they utilize freight rail for the movement of finished vehicles and components across North America.
- Retail and Logistics Companies: Large retailers and their third-party logistics providers that use intermodal rail for transporting consumer goods in overseas containers.
- Walmart Inc. (WMT): Representing large retail chains and their extensive supply chains that rely on intermodal rail for efficient distribution of goods.
It's important to note that a major freight railway like CP serves thousands of customers across these sectors, and the companies listed above are prominent examples of the types of businesses that are significant users of their rail services.
AI Analysis | Feedback
AI Analysis | Feedback
Keith Creel, President and Chief Executive Officer
Keith Creel became the first President and CEO of Canadian Pacific Kansas City (CPKC) on April 14, 2023, following the combination of Canadian Pacific (CP) and Kansas City Southern. Prior to this, he served as President and Chief Executive Officer of CP, a position he assumed in January 2017. Mr. Creel joined CP in February 2013 as President and Chief Operating Officer. Before joining CP, he was Executive Vice-President and Chief Operating Officer at Canadian National (CN), where he spent 11 years and held various senior leadership roles, including Executive Vice-President Operations and Senior Vice-President for both the Eastern and Western Regions. Mr. Creel began his railroad career in 1992 at Burlington Northern Railway as an intermodal ramp manager, and also held operating and management positions at Grand Trunk Western Railroad and Illinois Central Railroad before its merger with CN in 1999. He is a commissioned officer in the U.S. Army and served in the Persian Gulf War.
Nadeem Velani, Executive Vice-President and Chief Financial Officer
Nadeem Velani serves as Executive Vice-President and Chief Financial Officer of CPKC. He previously held the roles of Executive Vice-President and Chief Financial Officer at Canadian Pacific (CP), having been appointed CFO in September 2016 after serving as Vice-President Investor Relations. Before joining CP in March 2013, Mr. Velani spent 15 years at Canadian National (CN), where he held various positions in Strategic and Financial Planning, Investor Relations, Sales and Marketing, and the Office of the President and CEO.
Mark Redd, Executive Vice-President and Chief Operating Officer
Mark Redd is the Executive Vice-President and Chief Operating Officer for Canadian Pacific Kansas City. He retained this role with the formation of CPKC following the merger.
John Brooks, Executive Vice-President and Chief Marketing Officer
John Brooks holds the position of Executive Vice-President and Chief Marketing Officer at Canadian Pacific Kansas City. He retained his role as Executive Vice-President and Chief Marketing Officer from Canadian Pacific after the merger.
James Clements, Executive Vice-President Strategic Planning and Corporate Services
James Clements is the Executive Vice-President, Strategic Planning and Corporate Services at Canadian Pacific Kansas City. He retained his role in strategic planning and technology with the merged company.
AI Analysis | Feedback
Key Risks to Canadian Pacific Kansas City (CP)
- Trade Uncertainty and Macroeconomic Headwinds: Canadian Pacific Kansas City (CPKC) is significantly exposed to the shifting landscape of U.S. trade policy, including potential tariffs on goods from Canada and Mexico. This trade uncertainty, along with broader macroeconomic risks such as recessions and economic downturns, can directly impact freight volumes and revenue, as evidenced by the company moderating its financial outlook due to such factors.
- Operational Risks and Hazardous Materials Transportation: As a Class I railroad, CPKC faces inherent operational risks, including casualty incidents like train derailments. Such events can lead to substantial increases in casualty expenses and negatively impact earnings. Furthermore, the transportation of hazardous materials poses a significant risk, with the potential for substantial claims that could exceed insurance coverage in the event of an accident.
- Regulatory and Environmental Risks: CPKC operates in a highly regulated environment across Canada, the U.S., and Mexico. This exposes the company to extensive governmental legislation, including evolving environmental, climate, and sustainability regulations, as well as stringent safety standards. Changes in these regulations, particularly those related to hazardous materials and emissions, can result in increased operational costs and compliance burdens.
AI Analysis | Feedback
AI Analysis | Feedback
Canadian Pacific Kansas City (CP) operates within substantial addressable markets across North America for its various freight transportation services.
Overall Rail Freight Market
- The North America rail freight transportation market is projected to grow by USD 37.53 billion at a compound annual growth rate (CAGR) of 7.3% between 2024 and 2029.
- The North America railroad market generated approximately USD 94.3 billion in revenue in 2024.
- The U.S. freight rail industry is a nearly $80 billion market.
- The United States Rail Freight Transport Market was valued at USD 74.17 billion in 2026, with projections to reach USD 87.42 billion by 2031 at a CAGR of 3.34% over 2026-2031.
- Canada's railroads market accounts for about 12.0% of North America's total market, valued at around $15 billion in 2024.
- The Canadian rail freight transport market is expected to register a CAGR of 3.5% during the forecast period (2025-2030), moving more than USD 320 billion worth of goods annually.
Intermodal Traffic
- The North American intermodal freight market is the largest globally, with an estimated value of $51 billion.
- The North America intermodal freight transportation market generated a revenue of USD 15,278.8 million in 2023 and is expected to reach USD 31,588.0 million by 2030, growing at a CAGR of 10.9% from 2024 to 2030.
- Globally, the intermodal freight transportation market was valued at USD 82.2 billion in 2023 and is projected to reach USD 172.8 billion by 2032, exhibiting a CAGR of over 9% between 2024 and 2032.
Main Products or Services Addressable Markets
- Grain: In 2018, U.S. Class I railroads earned $5.8 billion in gross revenue from transporting 147.2 million tons of grain. In 2025, U.S. Class I railroads moved a record 1.38 million grain carloads. CPKC originated 158,000 grain carloads in 2025, reflecting strong exports to Mexico.
- Coal: Freight railroads in the U.S. moved 3.4 million carloads of coal in 2022, accounting for approximately 70% of U.S. coal deliveries to power plants. Coal remains the largest single carload commodity by volume, representing 27.3% of total non-intermodal U.S. rail shipments in January 2025.
- Potash: Null. (Specific rail transportation market size for potash in North America is not readily available, though U.S. agriculture relies heavily on potash imports, with over 90% net-import reliance.)
- Fertilizers: Over 60% of fertilizer moves by rail year-round in the United States. Freight railroads moved 2.3 million carloads of plastics, fertilizers, and other chemicals in 2022. The global Agricultural Fertilizer Transportation Services Market was estimated at USD 4.78 billion in 2025 and is expected to reach USD 7.33 billion by 2032, at a CAGR of 6.28%.
- Sulphur: Null. (Specific rail transportation market size for sulphur in North America is not readily available.)
- Energy, Chemicals and Plastics: The North America Chemical Logistics market was valued at more than USD 72.74 billion in 2024. Railways are expected to dominate the chemical logistics market with a 34.6% share in 2025 in North America and Europe, driven by their cost-efficiency, safety, and suitability for bulk chemical movement over long distances. The U.S. chemical industry transports approximately 1 billion tons of chemical products per year, with over 2.3 million freight rail cars of plastics, fertilizers, and other dry and liquid bulk chemical products moved across U.S. tracks in 2023.
- Metals and Minerals: Mining & Minerals held 21.60% of the United States Rail Freight Transport market share in 2025.
- Automotive: The North America Automotive Logistics Market was valued at USD 51.93 billion in 2025. Transportation, including rail, generated 51.45% of this market in 2025.
- Forest Products: Null. (Specific rail transportation market size for forest products in North America is not readily available, though Canadian freight trains serve this sector.)
AI Analysis | Feedback
Canadian Pacific Kansas City (CP) is expected to drive future revenue growth over the next 2-3 years through several key initiatives and market trends:
- Synergies and Network Expansion from the Kansas City Southern (KCS) Merger: The successful integration of the Kansas City Southern network, creating the first single-line railroad linking Canada, the U.S., and Mexico, is a primary revenue driver. CPKC aims to realize substantial synergies, including leveraging its expanded cross-border and intra-Mexico freight capabilities. Strategic capital projects, such as the Laredo Bridge expansion, are expected to significantly increase throughput at North America's busiest rail border crossing.
- Increased Volume in Key Segments (Grain, Intermodal, and Automotive): CPKC anticipates strong volume growth across its core business segments. This includes expected bumper grain harvests in Canada and the U.S. boosting agricultural shipments. In intermodal, growth is driven by services like the Mexico Midwest Express (MMX) and new contracts aimed at converting truck freight to rail, offering competitive transit times. The automotive sector benefits from the Mexico–U.S. corridor and rising EV plant shipments from Mexico, with CPKC also planning to enhance its car supply to meet this demand.
- Pricing Power and Strategic Customer Wins: The company has demonstrated the ability to implement higher pricing and secure successful contract renewals, often exceeding its long-term outlook. CPKC is also focused on forming strategic partnerships and multi-year agreements with major carriers to attract freight from trucking to rail, thereby capturing new revenue streams.
- Operational Efficiency and Service Enhancements: While contributing to cost control, improved operational efficiency and enhanced service offerings are also expected to drive revenue growth. By optimizing its network speed, improving terminal dwell times, and increasing train velocity, CPKC aims to offer superior service reliability. These improvements, stemming from the Precision Scheduled Railroading (PSR) model and ongoing investments in capacity, safety, and power, are crucial for attracting and retaining customers by providing competitive and reliable transportation solutions.
AI Analysis | Feedback
Share Repurchases
- Canadian Pacific Kansas City completed its previous share repurchase program in 2025, buying back all 37,348,539 authorized shares at a weighted average price of $105.53 per share.
- A new normal course issuer bid (NCIB) commenced on February 2, 2026, and is scheduled to run through February 1, 2027, permitting net new repurchases of up to 44,865,624 common shares, representing approximately 5% of outstanding shares.
- In March 2021, Canadian Pacific temporarily suspended its normal course issuer bid program to manage leverage effectively after the Kansas City Southern acquisition.
Share Issuance
- To fund the stock consideration of the Kansas City Southern merger, Canadian Pacific issued 44.5 million new shares in March 2021, leading Kansas City Southern shareholders to own 25% of the combined company.
- Shares of CPKC underwent a 5-for-1 stock split on May 13, 2021.
Outbound Investments
- Canadian Pacific (CP) acquired Kansas City Southern (KCS) in a stock and cash transaction with an enterprise value of approximately $29 billion in March 2021, which included the assumption of $3.8 billion of KCS's outstanding debt. The merger officially created Canadian Pacific Kansas City (CPKC) in April 2023.
- The acquisition of Kansas City Southern was partly financed by raising approximately $8.6 billion in debt.
- CPKC sold its stake in the Panama Canal Railway, generating a $333 million pre-tax gain.
Capital Expenditures
- CPKC's capital expenditures were approximately $1.212 billion in 2021, $1.15 billion in 2022, $1.886 billion in 2023, $1.991 billion in 2024, and peaked at $2.288 billion in 2025.
- For 2025, the company had a C$3.2 billion capital expenditure plan focused on track upgrades, locomotives, and terminal automation, including high-return expansion projects like the Mexico–U.S. automotive and intermodal corridor.
- CPKC has targeted annual capital expenditures of approximately $2.6 billion to $2.8 billion for the 2024-2028 period, with a primary focus on safety, efficiency, and network expansion, such as the bridge expansion in Laredo and an $800 million investment in Tier 4 locomotives.
Peer Outperformance in Rail Transportation
| Industry | Names | 1Y med | 3Y med | 5Y med | Top 3 by 5Y |
|---|---|---|---|---|---|
| Construction & Engineering | 31 | 34.4% | 131.4% | 215.6% | CDNL 3372% · STRL 2462% · FIX 2322% |
| Marine Transportation | 4 | 54.2% | 63.4% | 163.0% | MATX 224% · KEX 165% · SFL 161% |
| Construction Machinery & Heavy Transportation Equipment | 13 | 14.4% | 56.3% | 127.2% | CAT 348% · ALSN 267% · WAB 255% |
| Aerospace & Defense | 54 | 13.2% | 77.2% | 95.6% | DFNS 2733% · ATI 1147% · FTAI 1018% |
| Passenger Ground Transportation | 3 | -13.3% | 52.1% | 59.3% | UBER 87% · CAR 59% · LYFT -64% |
| Industrial Machinery & Supplies & Components | 71 | 13.4% | 57.6% | 59.2% | CRS 1647% · PSIX 867% · GHM 841% |
| Cargo Ground Transportation | 16 | 46.9% | 13.3% | 52.4% | R 301% · XPO 297% · CVLG 225% |
| Diversified Support Services | 34 | 12.4% | 37.0% | 43.9% | LIME 4409% · TH 429% · WLFC 380% |
| Rail Transportation ← | 7 | 38.8% | 69.9% | 43.5% | FSTR 123% · CSX 60% · UNP 49% |
| Trading Companies & Distributors | 18 | 6.7% | 37.2% | 42.3% | DXPE 572% · AIT 330% · URI 250% |
| Electrical Components & Equipment | 40 | 24.1% | 42.2% | 35.9% | POWL 2534% · BE 969% · ELVA 956% |
| Building Products | 33 | -4.2% | 19.8% | 32.1% | GFF 444% · LMB 431% · PPIH 278% |
| Industrial Conglomerates | 17 | 25.8% | 28.8% | 11.6% | RCMT 812% · TTI 215% · CSW 163% |
| Office Services & Supplies | 10 | 18.1% | 30.7% | 7.1% | TILE 200% · PBI 168% · EBF 63% |
| Environmental & Facilities Services | 28 | -7.5% | 14.2% | 4.8% | CECO 972% · ADUR 642% · NVRI 300% |
| Research & Consulting Services | 13 | -9.4% | -20.9% | -5.0% | HURN 206% · CRAI 89% · GRNQ 87% |
| Agricultural & Farm Machinery | 17 | -6.1% | -17.7% | -16.7% | BLBD 201% · DE 75% · GENC 68% |
| Passenger Airlines | 11 | 10.9% | -3.7% | -21.4% | LTM 2330% · UAL 170% · SKYW 161% |
| Data Processing & Outsourced Services | 6 | -32.9% | -12.8% | -27.3% | EXLS 48% · BR 7% · MMS -27% |
| Human Resource & Employment Services | 21 | 13.5% | -21.7% | -31.5% | BBSI 87% · ADP 42% · KFY 39% |
| Air Freight & Logistics | 12 | -12.1% | -23.4% | -35.9% | CHRW 86% · FDX 69% · EXPD 61% |
| Security & Alarm Services | 10 | -31.9% | -19.0% | -47.1% | CIX 119% · MG 94% · BCO 52% |
| Airport Services | 3 | -69.5% | -68.1% | -56.0% | JOBY -10% · ASLE -56% · UP -100% |
Latest Trefis Analyses
| Title | Date | |
|---|---|---|
| DASHBOARDS | ||
| Is Canadian Pacific Kansas City Stock Built to Withstand a Pullback? | 10/17/2025 | |
| Fundamental Metrics: ... | 06/19/2024 | |
| ARTICLES | ||
| CP Tops Union Pacific Stock on Price & Potential | 04/09/2026 | |
| Better Value & Growth: CP Leads CSX Stock | 04/02/2026 | |
| Better Value & Growth: CP Leads Union Pacific Stock | 03/27/2026 | |
| CP Looks Smarter Buy Than Norfolk Southern Stock | 03/18/2026 | |
| Pay Less, Gain More: CP Tops CSX Stock | 03/18/2026 |
Research & Analysis
Invest in Strategies
Wealth Management
Peer Comparisons
| Peers to compare with: |
Financials
| Median | |
|---|---|
| Name | |
| Mkt Price | 126.55 |
| Mkt Cap | 83.0 |
| Rev LTM | 15,449 |
| Op Inc LTM | 5,679 |
| FCF LTM | 2,796 |
| FCF 3Y Avg | 2,563 |
| CFO LTM | 5,500 |
| CFO 3Y Avg | 5,214 |
Growth & Margins
| Median | |
|---|---|
| Name | |
| Rev Chg LTM | 3.6% |
| Rev Chg 3Y Avg | 0.7% |
| Rev Chg Q | 11.4% |
| QoQ Delta Rev Chg LTM | 2.9% |
| Op Inc Chg LTM | 4.3% |
| Op Inc Chg 3Y Avg | -1.3% |
| Op Mgn LTM | 36.8% |
| Op Mgn 3Y Avg | 37.7% |
| QoQ Delta Op Mgn LTM | -0.2% |
| CFO/Rev LTM | 36.7% |
| CFO/Rev 3Y Avg | 35.8% |
| FCF/Rev LTM | 19.3% |
| FCF/Rev 3Y Avg | 17.7% |
Price Behavior
| Market Price | $93.68 | |
| Market Cap ($ Bil) | 83.0 | |
| First Trading Date | 12/30/1983 | |
| Distance from 52W High | -0.3% | |
| 50 Days | 200 Days | |
| DMA Price | $89.92 | $81.47 |
| DMA Trend | up | up |
| Distance from DMA | 4.2% | 15.0% |
| 3M | 1YR | |
| Volatility | 20.9% | 22.6% |
| Downside Capture | -14.26 | 37.80 |
| Upside Capture | 26.68 | 58.50 |
| Correlation (SPY) | -1.1% | 27.2% |
| 1M | 2M | 3M | 6M | 1Y | 3Y | |
|---|---|---|---|---|---|---|
| Beta | -0.77 | -0.17 | 0.11 | 0.36 | 0.49 | 0.68 |
| Up Beta | -1.24 | -1.06 | -0.33 | 0.30 | 0.44 | 0.81 |
| Down Beta | -0.30 | 0.21 | 0.44 | 0.59 | 0.54 | 0.42 |
| Up Capture | -56% | -5% | 15% | 41% | 45% | 39% |
| Bmk +ve Days | 11 | 22 | 35 | 67 | 138 | 427 |
| Stock +ve Days | 13 | 22 | 32 | 67 | 127 | 369 |
| Down Capture | -106% | -4% | 7% | 18% | 53% | 93% |
| Bmk -ve Days | 11 | 21 | 28 | 59 | 114 | 326 |
| Stock -ve Days | 8 | 20 | 30 | 58 | 123 | 379 |
[1] Upside and downside betas calculated using positive and negative benchmark daily returns respectively
Based On 1-Year Data
| Annualized Return | Annualized Volatility | Sharpe Ratio | Correlation with CP | |
|---|---|---|---|---|
| CP | 27.4% | 22.6% | 0.99 | - |
| Sector ETF (XLI) | 23.4% | 17.0% | 1.06 | 47.4% |
| Equity (SPY) | 20.4% | 12.8% | 1.17 | 27.1% |
| Gold (GLD) | 29.8% | 28.5% | 0.91 | 17.3% |
| Commodities (DBC) | 40.2% | 20.2% | 1.56 | -8.8% |
| Real Estate (VNQ) | 13.1% | 13.9% | 0.65 | 49.8% |
| Bitcoin (BTCUSD) | -45.4% | 42.7% | -1.30 | 9.3% |
Smart multi-asset allocation framework can stack odds in your favor. Learn How
Based On 5-Year Data
| Annualized Return | Annualized Volatility | Sharpe Ratio | Correlation with CP | |
|---|---|---|---|---|
| CP | 6.2% | 24.4% | 0.22 | - |
| Sector ETF (XLI) | 13.7% | 17.6% | 0.60 | 60.5% |
| Equity (SPY) | 13.1% | 17.2% | 0.59 | 54.0% |
| Gold (GLD) | 19.8% | 18.6% | 0.87 | 15.0% |
| Commodities (DBC) | 9.8% | 19.6% | 0.39 | 18.3% |
| Real Estate (VNQ) | 2.4% | 18.9% | 0.02 | 52.0% |
| Bitcoin (BTCUSD) | 7.1% | 52.6% | 0.32 | 19.7% |
Smart multi-asset allocation framework can stack odds in your favor. Learn How
Based On 10-Year Data
| Annualized Return | Annualized Volatility | Sharpe Ratio | Correlation with CP | |
|---|---|---|---|---|
| CP | 13.5% | 25.5% | 0.51 | - |
| Sector ETF (XLI) | 14.1% | 20.0% | 0.62 | 67.4% |
| Equity (SPY) | 15.2% | 17.9% | 0.72 | 63.3% |
| Gold (GLD) | 12.1% | 16.2% | 0.61 | 9.9% |
| Commodities (DBC) | 7.8% | 18.1% | 0.35 | 28.7% |
| Real Estate (VNQ) | 4.8% | 20.7% | 0.20 | 54.3% |
| Bitcoin (BTCUSD) | 59.9% | 66.0% | 1.00 | 16.4% |
Smart multi-asset allocation framework can stack odds in your favor. Learn How
Returns Analyses
Earnings Returns History
Updated 8/7/2026| Forward Returns | |||
|---|---|---|---|
| Earnings Date | 1D Returns | 5D Returns | 21D Returns |
| 7/29/2026 | -3.4% | 0.2% | |
| 4/29/2026 | 3.2% | 2.0% | 6.0% |
| 1/28/2026 | 5.7% | 10.8% | 22.0% |
| 10/29/2025 | -0.8% | -3.9% | -1.1% |
| 7/30/2025 | -2.9% | 1.0% | 0.7% |
| 4/30/2025 | 0.4% | 1.9% | 12.7% |
| 1/29/2025 | 1.2% | -1.0% | -1.2% |
| 10/23/2024 | -0.4% | -0.8% | -4.6% |
| ... | |||
| SUMMARY STATS | |||
| # Positive | 15 | 15 | 13 |
| # Negative | 9 | 9 | 10 |
| Median Positive | 1.6% | 2.4% | 6.0% |
| Median Negative | -1.2% | -3.6% | -2.5% |
| Max Positive | 5.7% | 10.8% | 22.0% |
| Max Negative | -6.6% | -10.6% | -8.5% |
| Forward Returns | |||
|---|---|---|---|
| Earnings Date | 1D Returns | 5D Returns | 21D Returns |
| 7/29/2026 | -3.4% | 0.2% | |
| 4/29/2026 | 3.2% | 2.0% | 6.0% |
| 1/28/2026 | 5.7% | 10.8% | 22.0% |
| 10/29/2025 | -0.8% | -3.9% | -1.1% |
| 7/30/2025 | -2.9% | 1.0% | 0.7% |
| 4/30/2025 | 0.4% | 1.9% | 12.7% |
| 1/29/2025 | 1.2% | -1.0% | -1.2% |
| 10/23/2024 | -0.4% | -0.8% | -4.6% |
| 7/30/2024 | 2.1% | -5.5% | 0.5% |
| 4/24/2024 | -6.6% | -10.6% | -8.5% |
| 1/30/2024 | 1.3% | 6.1% | 7.1% |
| 10/25/2023 | 0.1% | 2.8% | 3.5% |
| 7/27/2023 | -0.0% | -2.6% | -5.4% |
| 4/26/2023 | 0.7% | 1.9% | -0.6% |
| 1/31/2023 | -1.2% | -1.5% | -0.8% |
| 10/26/2022 | 0.5% | 0.4% | 11.3% |
| 7/28/2022 | 0.8% | 1.0% | 5.7% |
| 4/27/2022 | 3.9% | 3.2% | -3.8% |
| 1/27/2022 | -1.9% | -3.6% | -4.6% |
| 10/20/2021 | 1.6% | 2.8% | 1.7% |
| 7/28/2021 | 2.0% | 2.4% | -1.2% |
| 4/21/2021 | 3.5% | 5.4% | 13.4% |
| 1/27/2021 | 5.1% | 6.2% | 7.8% |
| 10/20/2020 | -0.8% | -4.5% | 4.7% |
| SUMMARY STATS | |||
| # Positive | 15 | 15 | 13 |
| # Negative | 9 | 9 | 10 |
| Median Positive | 1.6% | 2.4% | 6.0% |
| Median Negative | -1.2% | -3.6% | -2.5% |
| Max Positive | 5.7% | 10.8% | 22.0% |
| Max Negative | -6.6% | -10.6% | -8.5% |
SEC Filings
Expand for More| Report Date | Filing Date | Filing |
|---|---|---|
| 03/31/2026 | 04/30/2026 | 10-Q |
| 12/31/2025 | 02/26/2026 | 10-K |
| 09/30/2025 | 10/30/2025 | 10-Q |
| 06/30/2025 | 07/31/2025 | 10-Q |
| 03/31/2025 | 05/01/2025 | 10-Q |
| 12/31/2024 | 02/27/2025 | 10-K |
| 09/30/2024 | 10/24/2024 | 10-Q |
| 06/30/2024 | 07/31/2024 | 10-Q |
| 03/31/2024 | 04/24/2024 | 10-Q |
| 12/31/2023 | 02/27/2024 | 10-K |
| 09/30/2023 | 10/26/2023 | 10-Q |
| 06/30/2023 | 07/28/2023 | 10-Q |
| 03/31/2023 | 04/27/2023 | 10-Q |
| 12/31/2022 | 02/24/2023 | 10-K |
| 09/30/2022 | 10/27/2022 | 10-Q |
| 06/30/2022 | 07/28/2022 | 10-Q |
| Report Date | Filing Date | Filing |
|---|---|---|
| 03/31/2026 | 04/30/2026 | 10-Q |
| 12/31/2025 | 02/26/2026 | 10-K |
| 09/30/2025 | 10/30/2025 | 10-Q |
| 06/30/2025 | 07/31/2025 | 10-Q |
| 03/31/2025 | 05/01/2025 | 10-Q |
| 12/31/2024 | 02/27/2025 | 10-K |
| 09/30/2024 | 10/24/2024 | 10-Q |
| 06/30/2024 | 07/31/2024 | 10-Q |
| 03/31/2024 | 04/24/2024 | 10-Q |
| 12/31/2023 | 02/27/2024 | 10-K |
| 09/30/2023 | 10/26/2023 | 10-Q |
| 06/30/2023 | 07/28/2023 | 10-Q |
| 03/31/2023 | 04/27/2023 | 10-Q |
| 12/31/2022 | 02/24/2023 | 10-K |
| 09/30/2022 | 10/27/2022 | 10-Q |
| 06/30/2022 | 07/28/2022 | 10-Q |
| 03/31/2022 | 04/28/2022 | 10-Q |
| 12/31/2021 | 02/23/2022 | 10-K |
| 09/30/2021 | 10/20/2021 | 10-Q |
| 06/30/2021 | 07/29/2021 | 10-Q |
| 03/31/2021 | 04/22/2021 | 10-Q |
| 12/31/2020 | 02/18/2021 | 10-K |
| 09/30/2020 | 10/20/2020 | 10-Q |
| 06/30/2020 | 07/22/2020 | 10-Q |
| 03/31/2020 | 04/22/2020 | 10-Q |
| 12/31/2019 | 02/20/2020 | 10-K |
| 09/30/2019 | 10/24/2019 | 10-Q |
| 06/30/2019 | 07/16/2019 | 10-Q |
Investor Activity (13F)
Updated Aug 19, 2026Active managers (13F portfolio over $250M, at least 3 holdings) with a position over $5M that is either over 10% of their portfolio or held in a concentrated book of 50 or fewer total positions. Index/ETF, sovereign, bank, community-bank and charitable/donor-advised filers are excluded.
| Active Manager | Value | % of Portfolio | Total Positions | QoQ | Filing |
|---|---|---|---|---|---|
| TCI Fund Management LTD | $3.7 Bil | 8.1% | 10 | Hold | 13F |
| Rothschild & Co Wealth Management UK Ltd | $414.1 Mil | 6.3% | 25 | Hold | 13F |
| Consulta Ltd | $106.2 Mil | 5.3% | 13 | TRIM -40.7% | 13F |
| Maren Capital LLC | $82.4 Mil | 4.3% | 19 | TRIM -17.8% | 13F |
| Wgi DM, LLC | $34.9 Mil | 3.5% | 6 | Hold | 13F |
| Heathbridge Capital Management Ltd. | $9.2 Mil | 3.3% | 29 | Hold | 13F |
| Partners Group Holding AG | $38.6 Mil | 2.9% | 50 | Hold | 13F |
| Minneapolis Portfolio Management Group, LLC | $26.8 Mil | 2.8% | 33 | Hold | 13F |
| Coleford Investment Management Ltd. | $10.6 Mil | 2.6% | 24 | Hold | 13F |
| Ycg, LLC | $26.6 Mil | 2.4% | 42 | TRIM -13.3% | 13F |
| Scheer, Rowlett & Associates Investment Management Ltd. | $33.4 Mil | 2.4% | 33 | Hold | 13F |
| Walter Public Investments Inc. | $8.9 Mil | 2.1% | 48 | TRIM -20.7% | 13F |
| Mirova US LLC | $152.9 Mil | 1.7% | 42 | Hold | 13F |
| Locust Wood Capital Advisers, LLC | $51.2 Mil | 1.4% | 27 | TRIM -26.7% | 13F |
| Skye Global Management LP | $13.9 Mil | 0.3% | 44 | TRIM -8.3% | 13F |
| Woodbridge Co Ltd | $11.0 Mil | 0.0% | 46 | New | 13F |
| Active Manager | Value | % of Portfolio | Total Positions | QoQ | As Of | Filing |
|---|---|---|---|---|---|---|
| Prevatt Capital Ltd | $20.6 Mil | 6.0% | 11 | Exited | Dec 31, 2025 | 13F |
| DKRT Investments Corp. | $5.3 Mil | 1.5% | 45 | Exited | Dec 31, 2025 | 13F |
| Consulta Ltd | $106.2 Mil | 5.3% | 13 | TRIM -40.7% | Mar 31, 2026 | 13F |
| Locust Wood Capital Advisers, LLC | $51.2 Mil | 1.4% | 27 | TRIM -26.7% | Mar 31, 2026 | 13F |
| Walter Public Investments Inc. | $8.9 Mil | 2.1% | 48 | TRIM -20.7% | Mar 31, 2026 | 13F |
| Maren Capital LLC | $82.4 Mil | 4.3% | 19 | TRIM -17.8% | Mar 31, 2026 | 13F |
| Ycg, LLC | $26.6 Mil | 2.4% | 42 | TRIM -13.3% | Mar 31, 2026 | 13F |
| Skye Global Management LP | $13.9 Mil | 0.3% | 44 | TRIM -8.3% | Mar 31, 2026 | 13F |
| Active Manager | Value | % of Portfolio | Total Positions | QoQ | Filing |
|---|---|---|---|---|---|
| TCI Fund Management LTD | $3.7 Bil | 8.1% | 10 | Hold | 13F |
| Rothschild & Co Wealth Management UK Ltd | $414.1 Mil | 6.3% | 25 | Hold | 13F |
| Mirova US LLC | $152.9 Mil | 1.7% | 42 | Hold | 13F |
| Consulta Ltd | $106.2 Mil | 5.3% | 13 | TRIM -40.7% | 13F |
| Maren Capital LLC | $82.4 Mil | 4.3% | 19 | TRIM -17.8% | 13F |
| Locust Wood Capital Advisers, LLC | $51.2 Mil | 1.4% | 27 | TRIM -26.7% | 13F |
| Partners Group Holding AG | $38.6 Mil | 2.9% | 50 | Hold | 13F |
| Wgi DM, LLC | $34.9 Mil | 3.5% | 6 | Hold | 13F |
| Scheer, Rowlett & Associates Investment Management Ltd. | $33.4 Mil | 2.4% | 33 | Hold | 13F |
| Minneapolis Portfolio Management Group, LLC | $26.8 Mil | 2.8% | 33 | Hold | 13F |
| Ycg, LLC | $26.6 Mil | 2.4% | 42 | TRIM -13.3% | 13F |
| Skye Global Management LP | $13.9 Mil | 0.3% | 44 | TRIM -8.3% | 13F |
| Woodbridge Co Ltd | $11.0 Mil | 0.0% | 46 | New | 13F |
| Coleford Investment Management Ltd. | $10.6 Mil | 2.6% | 24 | Hold | 13F |
| Heathbridge Capital Management Ltd. | $9.2 Mil | 3.3% | 29 | Hold | 13F |
| Walter Public Investments Inc. | $8.9 Mil | 2.1% | 48 | TRIM -20.7% | 13F |
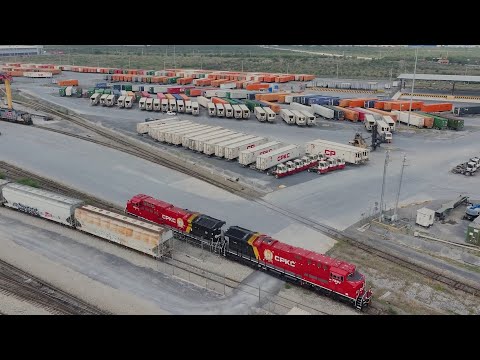
Canadian Pacific Kansas City — Investor Video Playlist




Industry Resources
| Industrials Resources |
| IndustryWeek |
| Manufacturing.net |
| Aviation Week |
| Rail Transportation Resources |
| Railway Gazette International |
| Progressive Railroading |
| Railway Age |
External Quote Links
| Y Finance | Barrons |
| TradingView | Morningstar |
| SeekingAlpha | ValueLine |
| Motley Fool | Robinhood |
| CNBC | Etrade |
| MarketWatch | Unusual Whales |
| YCharts | Perplexity Finance |
| FinViz |
Prefer one of these to Trefis? Tell us why.