
ERock (EROC)
Market Price (10/10/2026): $11.955 | Market Cap: $575.9 MilSector: Industrials | Industry: Industrial Machinery & Supplies & Components
ERock (EROC)
Market Price (10/10/2026): $11.955Market Cap: $575.9 MilSector: IndustrialsIndustry: Industrial Machinery & Supplies & Components
Investment Highlights Why It Matters Detailed financial logic regarding cash flow yields vs trend-riding momentum.
Cash is significant % of market capNet D/ENet Debt/Equity. Debt net of cash. Negative indicates net cash. Equity is taken as the Market Capitalization is -104% Attractive cash flow generationCFO/Rev LTMCash Flow from Operations / Revenue (Sales), Last Twelve Months (LTM) is 164%, FCF/Rev LTMFree Cash Flow / Revenue (Sales), Last Twelve Months (LTM) is 157% Attractive yieldFCF Yield is 45% | Meaningful short interestShort Interest % of Basic SharesShort Interest % of Basic Shares = (Short Interest Quantity) / (Basic Shares Outstanding). A high fraction of short interest can indicate potential risk of a short squeeze. is 19% | Not profitable at operating income levelOp Inc LTMOperating Income, Last Twelve Months is -50 Mil, Op Mgn LTMOperating Margin = Operating Income / Revenue Reflects profitability before taxes and before impact of capital structure (interest payments). is -31% Stock price has recently run up significantly6M Rtn6 month market price return is 587%, 12M Rtn12 month market price return is 587% Yield minus risk free rate is negativeERPEquity Risk Premium (ERP) = Total Yield - Risk Free Rate, Reflects the premium above risk free assets offered by the investment. is -20% High stock price volatilityVol 12M is 980% Key risksEROC key risks include [1] a market and regulatory shift away from its core natural gas technology, Show more. |
| Cash is significant % of market capNet D/ENet Debt/Equity. Debt net of cash. Negative indicates net cash. Equity is taken as the Market Capitalization is -104% |
| Attractive cash flow generationCFO/Rev LTMCash Flow from Operations / Revenue (Sales), Last Twelve Months (LTM) is 164%, FCF/Rev LTMFree Cash Flow / Revenue (Sales), Last Twelve Months (LTM) is 157% |
| Attractive yieldFCF Yield is 45% |
| Meaningful short interestShort Interest % of Basic SharesShort Interest % of Basic Shares = (Short Interest Quantity) / (Basic Shares Outstanding). A high fraction of short interest can indicate potential risk of a short squeeze. is 19% |
| Not profitable at operating income levelOp Inc LTMOperating Income, Last Twelve Months is -50 Mil, Op Mgn LTMOperating Margin = Operating Income / Revenue Reflects profitability before taxes and before impact of capital structure (interest payments). is -31% |
| Stock price has recently run up significantly6M Rtn6 month market price return is 587%, 12M Rtn12 month market price return is 587% |
| Yield minus risk free rate is negativeERPEquity Risk Premium (ERP) = Total Yield - Risk Free Rate, Reflects the premium above risk free assets offered by the investment. is -20% |
| High stock price volatilityVol 12M is 980% |
| Key risksEROC key risks include [1] a market and regulatory shift away from its core natural gas technology, Show more. |
Qualitative Assessment
AI Analysis | Feedback
ERock (EROC) stock has lost about 20% since 6/30/2026 because of the following key factors:
1. Persistent profitability challenges despite revenue growth. ERock reported a net loss of $67.7 million for fiscal Q2 2026 (ended June 30, 2026), primarily due to a $48.8 million debt extinguishment charge. While the company's revenue of $39.9 million surpassed analyst estimates and it achieved a record $1.7 billion contracted backlog, its adjusted EBITDA remained negative at $14 million for the quarter. Although management anticipates reaching positive adjusted EBITDA in the second half of fiscal year 2026, the ongoing unprofitability and differing analyst expectations regarding full-year profitability contribute to investor apprehension.
2. Broader sell-off in AI-related stocks and rising interest rates. ERock's stock decline since mid-June 2026 coincided with a broader downturn in AI-related equities, with the iShares AI Innovation & Tech ETF (BAI) experiencing a 21% decline during the same period. This indicates a significant sector-wide negative sentiment impacting valuation. Concurrently, rising government borrowing costs, noted by Goldman Sachs analysts in October 2026, pose a challenge for capital-intensive businesses like ERock. Higher interest rates increase the cost of borrowing for large construction projects, making it more expensive to fund manufacturing and installation, even with a substantial backlog.
Show more
ERock (EROC) stock has lost about 20% since 6/30/2026 because of the following key factors:
1. Persistent profitability challenges despite revenue growth. ERock reported a net loss of $67.7 million for fiscal Q2 2026 (ended June 30, 2026), primarily due to a $48.8 million debt extinguishment charge. While the company's revenue of $39.9 million surpassed analyst estimates and it achieved a record $1.7 billion contracted backlog, its adjusted EBITDA remained negative at $14 million for the quarter. Although management anticipates reaching positive adjusted EBITDA in the second half of fiscal year 2026, the ongoing unprofitability and differing analyst expectations regarding full-year profitability contribute to investor apprehension.
2. Broader sell-off in AI-related stocks and rising interest rates. ERock's stock decline since mid-June 2026 coincided with a broader downturn in AI-related equities, with the iShares AI Innovation & Tech ETF (BAI) experiencing a 21% decline during the same period. This indicates a significant sector-wide negative sentiment impacting valuation. Concurrently, rising government borrowing costs, noted by Goldman Sachs analysts in October 2026, pose a challenge for capital-intensive businesses like ERock. Higher interest rates increase the cost of borrowing for large construction projects, making it more expensive to fund manufacturing and installation, even with a substantial backlog.
3. Significant insider selling post-IPO. An insider at ERock executed a sale of 465,116 units on September 4, 2026, as part of an IPO restructuring. Valued at approximately $6.97 million (assuming an average stock price of $15 per share during that period), this transaction exceeds the $5 million threshold. Such substantial insider selling can signal a lack of confidence from informed individuals within the company, potentially contributing to negative investor sentiment.
Show less
Stock Movement Drivers
Fundamental Drivers
The -17.6% change in EROC stock from 6/30/2026 to 10/9/2026 was primarily driven by a 0.0% change in the company's Shares Outstanding (Mil).| (LTM values as of) | 6302026 | 10092026 | Change |
|---|---|---|---|
| Stock Price ($) | 14.50 | 11.95 | -17.6% |
| Change Contribution By: | |||
| Total Revenues ($ Mil) | � | � | 0.0% |
| Net Income Margin (%) | � | � | 0.0% |
| P/E Multiple | � | � | 0.0% |
| Shares Outstanding (Mil) | 48 | 48 | 0.0% |
| Cumulative Contribution | 0.0% |
Market Drivers
6/30/2026 to 10/9/2026| Return | Correlation | |
|---|---|---|
| EROC | -17.6% | |
| Market (SPY) | 4.3% | 45.1% |
| Sector (XLI) | -8.6% | 44.0% |
Fundamental Drivers
nullnull
Market Drivers
3/31/2026 to 10/9/2026| Return | Correlation | |
|---|---|---|
| EROC | 586.8% | |
| Market (SPY) | 20.0% | 36.3% |
| Sector (XLI) | 4.9% | 31.2% |
Fundamental Drivers
nullnull
Market Drivers
9/30/2025 to 10/9/2026| Return | Correlation | |
|---|---|---|
| EROC | 586.8% | |
| Market (SPY) | 17.8% | 36.3% |
| Sector (XLI) | 10.7% | 31.2% |
Fundamental Drivers
nullnull
Market Drivers
9/30/2023 to 10/9/2026| Return | Correlation | |
|---|---|---|
| EROC | 586.8% | |
| Market (SPY) | 88.4% | 36.3% |
| Sector (XLI) | 73.6% | 31.2% |
Price Returns Compared
| 2021 | 2022 | 2023 | 2024 | 2025 | 2026 | Total [1] | |
|---|---|---|---|---|---|---|---|
| Returns | |||||||
| EROC Return | 0% | 0% | 0% | 0% | 0% | 602% | 602% |
| Peers Return | -1% | -19% | 64% | 66% | 21% | -13% | 130% |
| S&P 500 Return | 27% | -19% | 24% | 23% | 16% | 13% | 107% |
Monthly Win Rates [3] | |||||||
| EROC Win Rate | 0% | 0% | 0% | 0% | 0% | 30% | |
| Peers Win Rate | 50% | 42% | 67% | 54% | 58% | 33% | |
| S&P 500 Win Rate | 75% | 42% | 67% | 75% | 67% | 50% | |
Max Drawdowns [4] | |||||||
| EROC Max Drawdown | 0% | 0% | 0% | 0% | 0% | -52% | |
| Peers Max Drawdown | -22% | -40% | -22% | -20% | -31% | -28% | |
| S&P 500 Max Drawdown | -5% | -25% | -10% | -8% | -19% | -9% | |
[1] Cumulative total returns since the beginning of 2021
[2] Peers: GGG, GHM, ADVEN, BENN, CEPL.
[3] Win Rate = % of calendar months in which monthly returns were positive
[4] Max drawdown represents maximum peak-to-trough decline within a year
[5] 2026 data is for the year up to 10/9/2026 (YTD)
How Low Can It Go
| Event | EROC | S&P 500 |
|---|---|---|
| 2015-2016 China Devaluation / Global Growth Scare | ||
| % Loss | -26.2% | -12.2% |
| % Gain to Breakeven | 35.5% | 13.9% |
| Time to Breakeven | 7 days | 62 days |
| 2014-2016 Oil Price Collapse | ||
| % Loss | -71.5% | -6.8% |
| % Gain to Breakeven | 250.7% | 7.3% |
| Time to Breakeven | 3946 days | 15 days |
| 2013 Taper Tantrum | ||
| % Loss | -56.0% | -0.2% |
| % Gain to Breakeven | 127.2% | 0.2% |
| Time to Breakeven | 4430 days | 1 days |
| 2011 US Debt Ceiling Crisis & European Contagion | ||
| % Loss | -19.6% | -17.9% |
| % Gain to Breakeven | 24.3% | 21.8% |
| Time to Breakeven | 64 days | 123 days |
| 2010 Eurozone Sovereign Debt Crisis / Flash Crash | ||
| % Loss | -26.5% | -15.4% |
| % Gain to Breakeven | 36.0% | 18.2% |
| Time to Breakeven | 71 days | 125 days |
| 2008-2009 Global Financial Crisis | ||
| % Loss | -75.7% | -53.4% |
| % Gain to Breakeven | 312.1% | 114.4% |
| Time to Breakeven | 6371 days | 1085 days |
In The Past
ERock's stock fell -26.2% during the 2015-2016 China Devaluation / Global Growth Scare. Such a loss loss requires a 35.5% gain to breakeven.
Preserve Wealth
Limiting losses and compounding gains is essential to preserving wealth.
Asset Allocation
Actively managed asset allocation strategies protect wealth. Learn more.
| Event | EROC | S&P 500 |
|---|---|---|
| 2015-2016 China Devaluation / Global Growth Scare | ||
| % Loss | -26.2% | -12.2% |
| % Gain to Breakeven | 35.5% | 13.9% |
| Time to Breakeven | 7 days | 62 days |
| 2014-2016 Oil Price Collapse | ||
| % Loss | -71.5% | -6.8% |
| % Gain to Breakeven | 250.7% | 7.3% |
| Time to Breakeven | 3946 days | 15 days |
| 2013 Taper Tantrum | ||
| % Loss | -56.0% | -0.2% |
| % Gain to Breakeven | 127.2% | 0.2% |
| Time to Breakeven | 4430 days | 1 days |
| 2010 Eurozone Sovereign Debt Crisis / Flash Crash | ||
| % Loss | -26.5% | -15.4% |
| % Gain to Breakeven | 36.0% | 18.2% |
| Time to Breakeven | 71 days | 125 days |
| 2008-2009 Global Financial Crisis | ||
| % Loss | -75.7% | -53.4% |
| % Gain to Breakeven | 312.1% | 114.4% |
| Time to Breakeven | 6371 days | 1085 days |
In The Past
ERock's stock fell -26.2% during the 2015-2016 China Devaluation / Global Growth Scare. Such a loss loss requires a 35.5% gain to breakeven.
Preserve Wealth
Limiting losses and compounding gains is essential to preserving wealth.
Asset Allocation
Actively managed asset allocation strategies protect wealth. Learn more.
About ERock (EROC)
ERock (EROC) is a vertically integrated company that designs, deploys, operates, and maintains multi-purpose distributed power systems. Their core offering includes proprietary, low-emission, quick-response natural gas generators and embedded software technology. These systems are delivered through their comprehensive "ERock Platform," which encompasses equipment, supply, installation (ESI), ongoing operations and maintenance (O&M), and asset management services, providing customers with turnkey power solutions.
The company's power systems are utilized for three main applications: bridge power, which provides immediate prime power to accelerate time-to-power ahead of long-lead grid upgrades; backup power, ensuring high reliability and resiliency for mission-critical operations during grid disruptions; and dispatchable power, where systems act as on-demand, fast-response resources for flexible capacity, such as peak-load management or grid-stability services. ERock also offers market operations and dispatch management services, enabling customers to optimize and monetize their power systems by participating in grid support events.
ERock primarily serves data centers, utilities, and large commercial & industrial (C&I) businesses. They have a significant operating footprint and anticipate disproportionate growth in high-demand areas like California and Texas, among other U.S. states. With over 15 years of operational experience, an installed base of approximately 1,000 MW, and a substantial sales backlog, ERock is a well-established provider in the distributed power generation market, counting leading companies like Microsoft, Entergy, and Walmart among its customers.
AI Analysis | Feedback
Here are 1-2 brief analogies for ERock:
- AWS for distributed, on-demand industrial power infrastructure. (Like Amazon Web Services provides computing infrastructure as a service, ERock provides comprehensive, managed power infrastructure as a service for industrial and data center clients.)
- Starlink for fast, reliable, distributed industrial power. (Similar to how Starlink offers rapidly deployable, distributed internet to bypass traditional infrastructure limitations, ERock provides quickly deployed, reliable, distributed power systems that can supplement or replace traditional grid power.)
AI Analysis | Feedback
- Distributed Natural Gas Power Systems: Proprietary, low-emission, quick-response natural gas generators with embedded software technology, designed for various power applications.
- ERock Platform Services: A comprehensive, turnkey service offering that includes the design, delivery, installation, operations, maintenance, and asset management of their distributed power systems.
- Market Operations and Grid Dispatch Management: Services to optimize customer-owned power systems for grid support, peak-load management, and monetization through strategic dispatch.
AI Analysis | Feedback
Major Customers of ERock (EROC)
ERock (EROC) primarily sells its proprietary power systems and related services to other businesses. Its major customer categories and examples of companies served include:
- Data Centers and AI Ecosystem Companies:
- Microsoft (MSFT)
- Wistron
- Foxconn
- Electric and Gas Utilities:
- Entergy (ETR)
- ComEd (part of Exelon, EXC)
- Large C&I (Commercial & Industrial) Businesses:
- H-E-B
- Walmart (WMT)
AI Analysis | Feedback
AI Analysis | Feedback
John Carrington, Chief Executive Officer and Director
John Carrington was appointed Chief Executive Officer of ERock in December 2025, having previously served as the Executive Chairman of the company's Board of Directors since June 2025. He is a seasoned energy and technology executive with decades of experience in scaling high-growth companies and bringing advanced power technologies to market. Prior to ERock, he served as CEO of Stem, Inc., where he led the company through its IPO and rapid commercial expansion. His career also includes senior leadership roles at Miasole, First Solar, and GE, where he drove substantial global growth across energy and industrial markets.
Ian Blakely, Chief Financial Officer
Ian Blakely joined ERock in 2015. Before joining ERock, Blakely worked with venture capital and private equity funds that specialized in energy, supporting teams in developing, commercializing, and scaling technology businesses. He also previously held the roles of Chief Strategy Officer and CTO at ERock.
Corey Amthor, President
Corey Amthor, who previously served as CEO until December 2025, returned to his role as President, leading the daily operations of the business. He has been with ERock since 2014 and has held prior leadership roles at companies such as Calpine, ConAgra, DuPont/Conoco, and Statoil.
Paul Froutan, Chief Operating Officer
Paul Froutan previously served as CFO/COO at Xenex and also led Google's Global Data Center Operations.
Allan Schurr, Chief Commercial Officer
Allan Schurr is the Chief Commercial Officer at ERock.
AI Analysis | Feedback
Key Risks to ERock (EROC)
- Risk of Regulatory and Market Shift Away from Natural Gas: ERock’s core business model is centered on proprietary, low-emission natural gas generators. A significant risk stems from the accelerating global and domestic energy transition, which may lead to increasingly stringent environmental regulations, higher carbon pricing, or a stronger market preference for entirely zero-emission energy solutions. These factors could decrease the demand for natural gas-based power systems, elevate operating costs, or render alternative renewable energy solutions more economically attractive, thereby potentially undermining the long-term viability of ERock's primary offering.
- Intensifying Competition from Advanced Renewable Energy and Storage Solutions: Although ERock provides highly reliable, quick-response power systems, the distributed power generation market is undergoing rapid technological evolution. Ongoing advancements and cost reductions in renewable energy sources, such as solar and wind, combined with increasingly sophisticated and cost-effective battery storage solutions, could present direct and strong competition for bridge, backup, and dispatchable power applications. These alternatives often offer zero-emission profiles, which could challenge ERock's market position, despite its "low emission" natural gas technology.
- Concentration Risk in Key Geographic Markets and Customer Segments: ERock highlights its largest operating footprints and anticipated disproportionate growth in California and Texas, primarily driven by high data center demand. This significant concentration exposes the company to specific regulatory changes, economic downturns, or shifts in demand dynamics within these two critical states and the data center industry. Adverse developments in these key markets could substantially impact ERock's growth trajectory and overall financial performance.
AI Analysis | Feedback
The clear emerging threat for ERock is the rapid advancement and increasing deployment of large-scale battery energy storage systems (BESS) and other zero-emission distributed energy resources. While ERock's natural gas generators are described as "low emission," the broader market trend, especially among data centers and utilities, is towards decarbonization and net-zero solutions. BESS can provide many of the same core functions as ERock's systems, including fast-response backup power, dispatchable capacity, and grid support services, but with zero on-site emissions. As BESS technology continues to improve in cost, energy density, and performance, it poses a direct competitive threat to natural gas-fired distributed generation in the applications ERock serves.
AI Analysis | Feedback
ERock (EROC) operates within several addressable markets related to distributed power generation in the U.S., primarily serving data centers, utilities, and large commercial and industrial (C&I) businesses. The key addressable markets for ERock's products and services include:
-
U.S. Distributed Energy Generation Market: The distributed energy generation market in the United States was valued at an estimated USD 142.50 billion in 2025 and is projected to reach USD 340.50 billion by 2033, growing at a Compound Annual Growth Rate (CAGR) of 11.1% over the forecast period from 2026 to 2033. Another estimate places the U.S. distributed energy generation market revenue at USD 105,141.9 million in 2025, expected to reach USD 124,014.9 million by 2033, with a CAGR of 2.1% from 2026 to 2033. More specifically, the distributed fuel-based generation market in the U.S. is projected to grow 240% from 2022 to 2027. The North American Distributed Natural Gas Fueled Generation Market alone was valued at USD 9.3 billion in 2024 and is expected to contribute to a global market projected to reach USD 66.1 billion by 2034, growing at a CAGR of 9.4% from 2025 to 2034.
-
U.S. Backup Power Systems Market: The United States Backup Power Systems Market was valued at USD 5.53 billion in 2025 and is estimated to grow to USD 7.55 billion by 2031, at a CAGR of 5.28% during the forecast period (2026-2031). Natural gas generators held a 40.2% revenue share in this market in 2025. Additionally, the U.S. standby generator sets market was valued at USD 6.6 billion in 2024 and is estimated to grow at a 6.8% CAGR from 2025 to 2034, reaching USD 12.9 billion by 2034.
-
U.S. Data Center Power Market: The United States data center power market size is expected to grow from USD 15.22 billion in 2025 to USD 21.89 billion by 2031, at a 6.25% CAGR. The North America data center power market size is estimated at USD 16.88 billion in 2026, growing from USD 15.81 billion in 2025 and projected to reach USD 23.39 billion by 2031, with a 6.75% CAGR over 2026-2031. The U.S. data center power industry is expected to grow significantly at a CAGR of 15.4% from 2025 to 2033.
AI Analysis | Feedback
ERock (EROC) is expected to drive future revenue growth over the next 2-3 years through several key areas:
- Growing Demand in Data Center and AI Ecosystem: The company anticipates disproportionate growth and market potential, particularly in California and Texas, driven by high demand from data centers and AI ecosystem companies for bridge, backup, and dispatchable power applications.
- Conversion of Contracted Power System Sales Backlog: With a significant Contracted Power System Sales Backlog of approximately $1.3 billion as of March 31, 2026, the conversion and execution of these contracts into deployed systems and services will be a primary driver of future revenue.
- Expansion of Assembly Capacity: ERock is targeting an increase in its annual assembly capacity to approximately 1.2 GW by the end of 2026 through the development of its Hyperion facility, alongside its Titan facility. This expansion will enable the company to meet growing customer demand and fulfill its backlog more rapidly.
- Increased Adoption of ERock Platform Services: A substantial portion of ERock's sales includes the comprehensive design, delivery, installation, and long-term services provided by its ERock Platform, encompassing equipment, supply and installation (ESI), operations and maintenance (O&M), and asset management services. Continued growth in the adoption and utilization of these turnkey solutions will contribute to revenue growth.
- Monetization through Market Operations and Dispatch Management: ERock assists customers in maximizing the return on their investment by leveraging multi-purpose dispatchable power capabilities through its market operations and dispatch management platform. These services, including participation in over 236,000 Grid Support Events over the past eight years, allow for asset optimization and compensation, reducing costs for customers and generating service-based revenue for ERock.
AI Analysis | Feedback
Share Issuance
- ERock completed its Initial Public Offering (IPO) on June 10, 2026, offering 27,906,977 shares of Class A common stock at a price of $21.50 per share.
- The IPO was expected to raise approximately $600 million.
- The company granted underwriters a 30-day option to purchase up to an additional 4,186,046 shares of Class A common stock.
Inbound Investments
- ERock is backed by the investment firm Energy Impact Partners.
- The company's IPO in June 2026 represented a significant inbound investment from public investors, aiming for a valuation of up to $5 billion.
Capital Expenditures
- For the trailing twelve months ended March 31, 2026, capital expenditures were reported as $7.6 million.
- ERock plans to increase its annual assembly capacity to approximately 1.2 GW by the end of 2026 through the development of its Hyperion facility in Houston, Texas.
Peer Outperformance in Industrial Machinery & Supplies & Components
| Industry | Names | 1Y med | 3Y med | 5Y med | Top 3 by 5Y |
|---|---|---|---|---|---|
| Construction & Engineering | 31 | 3.5% | 117.5% | 193.9% | FIX 2132% · STRL 2095% · CDNL 1525% |
| Marine Transportation | 5 | 101.3% | 65.7% | 162.0% | HOS 39216% · MATX 193% · KEX 162% |
| Construction Machinery & Heavy Transportation Equipment | 13 | -3.1% | 39.0% | 96.3% | CAT 347% · ALSN 232% · WAB 228% |
| Aerospace & Defense | 54 | -14.9% | 65.1% | 61.3% | ATI 1032% · FTAI 842% · HWM 622% |
| Industrial Machinery & Supplies & Components ← | 72 | 12.5% | 42.0% | 46.4% | PSIX 1201% · CRS 1127% · EROC 587% |
| Rail Transportation | 7 | 22.7% | 56.3% | 43.9% | FSTR 124% · CSX 55% · RAIL 47% |
| Trading Companies & Distributors | 19 | 7.3% | 30.2% | 41.1% | DXPE 475% · AIT 264% · WCC 224% |
| Cargo Ground Transportation | 16 | 33.3% | 0.1% | 31.1% | XPO 286% · R 223% · CVLG 139% |
| Electrical Components & Equipment | 39 | -5.6% | 61.6% | 28.9% | POWL 2302% · BE 1365% · VRT 988% |
| Diversified Support Services | 32 | 6.6% | 29.1% | 28.0% | LIME 3223% · TH 366% · CXW 250% |
| Building Products | 33 | -14.6% | 0.3% | 15.8% | LMB 728% · GFF 332% · PPIH 263% |
| Industrial Conglomerates | 17 | 8.9% | 3.4% | -4.4% | RCMT 567% · CSW 116% · DD 69% |
| Agricultural & Farm Machinery | 17 | 8.6% | -10.7% | -8.6% | BLBD 178% · DE 93% · GENC 62% |
| Environmental & Facilities Services | 30 | -36.9% | 14.0% | -9.1% | CECO 823% · ADUR 403% · NVRI 320% |
| Research & Consulting Services | 13 | -3.6% | -27.0% | -11.3% | HURN 232% · CRAI 76% · GRNQ 22% |
| Security & Alarm Services | 9 | -42.7% | -3.4% | -17.5% | CIX 164% · MG 113% · BCO 72% |
| Passenger Ground Transportation | 3 | -25.5% | 45.1% | -19.3% | UBER 50% · CAR -19% · LYFT -70% |
| Data Processing & Outsourced Services | 6 | -29.5% | -11.4% | -23.5% | EXLS 46% · BR 7% · G -23% |
| Office Services & Supplies | 9 | 25.1% | 17.4% | -26.0% | PBI 181% · TILE 125% · HNI 47% |
| Passenger Airlines | 11 | 7.9% | 17.8% | -34.2% | LTM 3338% · UAL 119% · DAL 96% |
| Air Freight & Logistics | 12 | -25.6% | -27.8% | -36.2% | FDX 80% · EXPD 79% · CHRW 77% |
| Human Resource & Employment Services | 22 | 7.9% | -21.1% | -42.3% | BBSI 64% · ADP 47% · KFY 4% |
| Airport Services | 3 | -77.1% | -79.3% | -70.7% | JOBY -40% · ASLE -71% · UP -100% |
Research & Analysis
Invest in Strategies
Wealth Management
Peer Comparisons
| Peers to compare with: |
Financials
| Median | |
|---|---|
| Name | |
| Mkt Price | 45.08 |
| Mkt Cap | 0.8 |
| Rev LTM | 213 |
| Op Inc LTM | 9 |
| FCF LTM | 131 |
| FCF 3Y Avg | 283 |
| CFO LTM | 137 |
| CFO 3Y Avg | 337 |
Growth & Margins
| Median | |
|---|---|
| Name | |
| Rev Chg LTM | 5.4% |
| Rev Chg 3Y Avg | 11.7% |
| Rev Chg Q | 3.3% |
| QoQ Delta Rev Chg LTM | 0.8% |
| Op Inc Chg LTM | 7.8% |
| Op Inc Chg 3Y Avg | 69.8% |
| Op Mgn LTM | 4.9% |
| Op Mgn 3Y Avg | 5.6% |
| QoQ Delta Op Mgn LTM | 0.6% |
| CFO/Rev LTM | 17.0% |
| CFO/Rev 3Y Avg | 18.9% |
| FCF/Rev LTM | 15.3% |
| FCF/Rev 3Y Avg | 13.3% |
Price Behavior
| 1M | 2M | 3M | 6M | 1Y | 3Y | |
|---|---|---|---|---|---|---|
| Beta | 3.40 | 4.70 | 4.70 | -19.62 | -8.69 | -2.12 |
| Up Beta | 2.00 | 0.86 | 4.57 | 1.33 | 0.81 | 0.13 |
| Down Beta | 2.42 | 5.73 | 5.55 | -77.59 | -26.43 | -5.31 |
| Up Capture | 419% | 816% | 532% | 159% | 70% | 6% |
| Bmk +ve Days | 6 | 16 | 27 | 66 | 132 | 424 |
| Stock +ve Days | 11 | 22 | 31 | 36 | 36 | 36 |
| Down Capture | 315% | 439% | 394% | -996% | -514% | -296% |
| Bmk -ve Days | 16 | 26 | 37 | 60 | 120 | 328 |
| Stock -ve Days | 11 | 20 | 33 | 42 | 42 | 42 |
[1] Upside and downside betas calculated using positive and negative benchmark daily returns respectively
Based On 1-Year Data
| Annualized Return | Annualized Volatility | Sharpe Ratio | Correlation with EROC | |
|---|---|---|---|---|
| EROC | -36.4% | 108.7% | -0.75 | - |
| Sector ETF (XLI) | 9.8% | 17.4% | 0.37 | 31.2% |
| Equity (SPY) | 16.7% | 13.0% | 0.91 | 36.3% |
| Gold (GLD) | 3.3% | 29.5% | 0.11 | 19.0% |
| Commodities (DBC) | 44.8% | 20.9% | 1.67 | -8.4% |
| Real Estate (VNQ) | 4.8% | 13.8% | 0.09 | -2.9% |
| Bitcoin (BTCUSD) | -33.8% | 44.2% | -0.81 | 13.3% |
Smart multi-asset allocation framework can stack odds in your favor. Learn How
Based On 5-Year Data
| Annualized Return | Annualized Volatility | Sharpe Ratio | Correlation with EROC | |
|---|---|---|---|---|
| EROC | -8.6% | 108.7% | -0.75 | - |
| Sector ETF (XLI) | 12.9% | 17.6% | 0.56 | 31.2% |
| Equity (SPY) | 13.9% | 17.1% | 0.62 | 36.3% |
| Gold (GLD) | 18.5% | 18.9% | 0.79 | 19.0% |
| Commodities (DBC) | 10.0% | 19.6% | 0.39 | -8.4% |
| Real Estate (VNQ) | 1.3% | 18.8% | -0.04 | -2.9% |
| Bitcoin (BTCUSD) | 11.2% | 52.0% | 0.39 | 13.3% |
Smart multi-asset allocation framework can stack odds in your favor. Learn How
Based On 10-Year Data
| Annualized Return | Annualized Volatility | Sharpe Ratio | Correlation with EROC | |
|---|---|---|---|---|
| EROC | -4.4% | 108.7% | -0.75 | - |
| Sector ETF (XLI) | 13.2% | 20.0% | 0.58 | 31.2% |
| Equity (SPY) | 15.5% | 17.9% | 0.73 | 36.3% |
| Gold (GLD) | 11.8% | 16.4% | 0.59 | 19.0% |
| Commodities (DBC) | 8.2% | 18.1% | 0.37 | -8.4% |
| Real Estate (VNQ) | 4.5% | 20.7% | 0.18 | -2.9% |
| Bitcoin (BTCUSD) | 63.3% | 66.2% | 1.03 | 13.3% |
Smart multi-asset allocation framework can stack odds in your favor. Learn How
Earnings Returns History
Updated 9/14/2026| Forward Returns | |||
|---|---|---|---|
| Earnings Date | 1D Returns | 5D Returns | 21D Returns |
| 8/11/2026 | 22.8% | 35.3% | 5.5% |
| SUMMARY STATS | |||
| # Positive | 1 | 1 | 1 |
| # Negative | 0 | 0 | 0 |
| Median Positive | 22.8% | 35.3% | 5.5% |
| Median Negative | |||
| Max Positive | 22.8% | 35.3% | 5.5% |
| Max Negative | |||
| Forward Returns | |||
|---|---|---|---|
| Earnings Date | 1D Returns | 5D Returns | 21D Returns |
| 8/11/2026 | 22.8% | 35.3% | 5.5% |
| SUMMARY STATS | |||
| # Positive | 1 | 1 | 1 |
| # Negative | 0 | 0 | 0 |
| Median Positive | 22.8% | 35.3% | 5.5% |
| Median Negative | |||
| Max Positive | 22.8% | 35.3% | 5.5% |
| Max Negative | |||
ERock — Investor Video Playlist
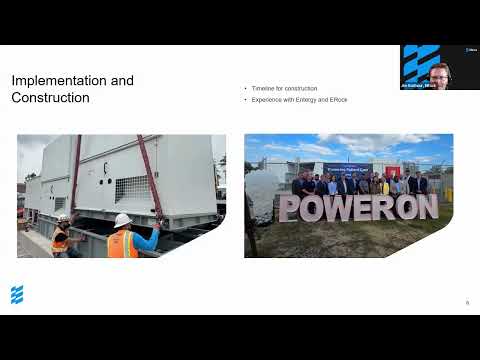


Industry Resources
| Industrials Resources |
| IndustryWeek |
| Manufacturing.net |
| Aviation Week |
| Industrial Machinery & Supplies & Components Resources |
| Machine Design |
| Modern Machine Shop |
| Industrial Equipment News (IEN) |
External Quote Links
| Y Finance | Barrons |
| TradingView | Morningstar |
| SeekingAlpha | ValueLine |
| Motley Fool | Robinhood |
| CNBC | Etrade |
| MarketWatch | Unusual Whales |
| YCharts | Perplexity Finance |
| FinViz |
Prefer one of these to Trefis? Tell us why.