
Bank of New York Mellon (BNY)
Market Price (10/16/2026): $143.0 | Market Cap: $98.1 BilSector: Financials | Industry: Asset Management & Custody Banks
Bank of New York Mellon (BNY)
Market Price (10/16/2026): $143.0Market Cap: $98.1 BilSector: FinancialsIndustry: Asset Management & Custody Banks
Investment Highlights Why It Matters Detailed financial logic regarding cash flow yields vs trend-riding momentum.
Attractive yieldTotal YieldTotal Yield = Earnings Yield + Dividend Yield, Earnings Yield = Net Income / Market Cap Dividend Yield = Total Dividends / Market Cap is 8.4%, ERPEquity Risk Premium (ERP) = Total Yield - Risk Free Rate, Reflects the premium above risk free assets offered by the investment. is 3.1% Cash is significant % of market capNet D/ENet Debt/Equity. Debt net of cash. Negative indicates net cash. Equity is taken as the Market Capitalization is -183% Attractive cash flow generationCFO/Rev LTMCash Flow from Operations / Revenue (Sales), Last Twelve Months (LTM) is 17%, CFO LTM is 3.6 Bil Stock buyback supportStock Buyback 3Y Total is 12 Bil Low stock price volatilityVol 12M is 22% Megatrend and thematic driversMegatrends include Digital & Alternative Assets, and Fintech & Digital Payments. Themes include Digital Asset Custody, Wealth Management Technology, Show more. | Expensive valuation multiplesP/CFOPrice/(Cash Flow from Operations). CFO is cash before capital expenditures. is 26x Key risksBNY key risks include [1] intense competition from established institutions and fintech firms in its core custody and fund administration services, Show more. |
| Attractive yieldTotal YieldTotal Yield = Earnings Yield + Dividend Yield, Earnings Yield = Net Income / Market Cap Dividend Yield = Total Dividends / Market Cap is 8.4%, ERPEquity Risk Premium (ERP) = Total Yield - Risk Free Rate, Reflects the premium above risk free assets offered by the investment. is 3.1% |
| Cash is significant % of market capNet D/ENet Debt/Equity. Debt net of cash. Negative indicates net cash. Equity is taken as the Market Capitalization is -183% |
| Attractive cash flow generationCFO/Rev LTMCash Flow from Operations / Revenue (Sales), Last Twelve Months (LTM) is 17%, CFO LTM is 3.6 Bil |
| Stock buyback supportStock Buyback 3Y Total is 12 Bil |
| Low stock price volatilityVol 12M is 22% |
| Megatrend and thematic driversMegatrends include Digital & Alternative Assets, and Fintech & Digital Payments. Themes include Digital Asset Custody, Wealth Management Technology, Show more. |
| Expensive valuation multiplesP/CFOPrice/(Cash Flow from Operations). CFO is cash before capital expenditures. is 26x |
| Key risksBNY key risks include [1] intense competition from established institutions and fintech firms in its core custody and fund administration services, Show more. |
Qualitative Assessment
AI Analysis | Feedback
Bank of New York Mellon (BNY) stock has lost about 5% since 6/30/2026 because of the following key factors:
1. Macroeconomic Headwinds from Surging Interest Rates and Persistent Inflation.
BNY Mellon's stock movement since June 30, 2026, has been influenced by broader macroeconomic factors, particularly the surge in long-term interest rates and persistent inflation. In fiscal Q3 2026 (July 1 to September 30, 2026), the 10-year Treasury bond yield reached decades-long highs, closing the quarter at 5.29%. This increase was compounded by the Federal Reserve's decision to hike its Federal Funds rate for the first time since 2023 on September 16, 2026. Persistent inflation throughout the period also contributed to a dynamic operating environment, which can impact financial institutions through various channels, including deposit margin compression and valuation pressures on certain assets.
2. Weakening Capital Ratios.
Despite reporting strong earnings, a key concern for investors was the decline in BNY Mellon's capital ratios during fiscal Q3 2026. The common equity Tier 1 (CET1) ratio, a crucial measure of a bank's financial strength, fell to 10.9% as of September 30, 2026, down from 11.7% recorded on September 30, 2025. Similarly, the Tier 1 leverage ratio decreased from 6.1% to 5.7% over the same annual period. These reduced capital levels can signal to the market a potential decrease in financial flexibility or an increase in perceived risk, which can lead to downward pressure on the stock.
Show more
Bank of New York Mellon (BNY) stock has lost about 5% since 6/30/2026 because of the following key factors:
1. Macroeconomic Headwinds from Surging Interest Rates and Persistent Inflation.
BNY Mellon's stock movement since June 30, 2026, has been influenced by broader macroeconomic factors, particularly the surge in long-term interest rates and persistent inflation. In fiscal Q3 2026 (July 1 to September 30, 2026), the 10-year Treasury bond yield reached decades-long highs, closing the quarter at 5.29%. This increase was compounded by the Federal Reserve's decision to hike its Federal Funds rate for the first time since 2023 on September 16, 2026. Persistent inflation throughout the period also contributed to a dynamic operating environment, which can impact financial institutions through various channels, including deposit margin compression and valuation pressures on certain assets.
2. Weakening Capital Ratios.
Despite reporting strong earnings, a key concern for investors was the decline in BNY Mellon's capital ratios during fiscal Q3 2026. The common equity Tier 1 (CET1) ratio, a crucial measure of a bank's financial strength, fell to 10.9% as of September 30, 2026, down from 11.7% recorded on September 30, 2025. Similarly, the Tier 1 leverage ratio decreased from 6.1% to 5.7% over the same annual period. These reduced capital levels can signal to the market a potential decrease in financial flexibility or an increase in perceived risk, which can lead to downward pressure on the stock.
3. Increased Operating Expenses and Deposit Margin Compression.
BNY Mellon experienced an 8% year-over-year increase in total non-interest expenses during fiscal Q3 2026, reaching $3.49 billion. This rise was primarily attributed to higher revenue-related costs and strategic investments, which partially offset efficiency gains. Furthermore, while net interest income (NII) grew 15% year-over-year, it saw a 2% sequential decline quarter-over-quarter in fiscal Q3 2026 due to seasonally lower deposit balances and deposit margin compression. These factors suggest ongoing cost pressures and challenges in optimizing interest income margins, which can temper investor sentiment despite overall revenue growth.
4. Cumulative Net Outflows in Assets Under Management (AUM).
Although BNY Mellon reported a 2% year-over-year increase in Assets Under Management (AUM) to $2.2 trillion as of September 30, 2026, driven by higher market values, the company also faced cumulative net outflows. Specifically, fiscal Q3 2026 saw $22 billion in cash outflows, which significantly offset $6 billion in long-term active-strategy inflows and $4 billion in index inflows. These net outflows can be a negative indicator for investors, as they signal a reduction in client assets and could imply a potential headwind for future fee revenue growth.
Show less
Stock Movement Drivers
Fundamental Drivers
nullnull
Market Drivers
6/30/2026 to 10/15/2026| Return | Correlation | |
|---|---|---|
| BNY | -4.4% | |
| Market (SPY) | 3.4% | 39.7% |
| Sector (XLF) | 1.7% | 54.5% |
Fundamental Drivers
nullnull
Market Drivers
3/31/2026 to 10/15/2026| Return | Correlation | |
|---|---|---|
| BNY | 16.9% | |
| Market (SPY) | 19.0% | 36.1% |
| Sector (XLF) | 10.8% | 52.5% |
Fundamental Drivers
nullnull
Market Drivers
9/30/2025 to 10/15/2026| Return | Correlation | |
|---|---|---|
| BNY | 28.5% | |
| Market (SPY) | 16.8% | 45.5% |
| Sector (XLF) | 2.4% | 60.2% |
Fundamental Drivers
nullnull
Market Drivers
9/30/2023 to 10/15/2026| Return | Correlation | |
|---|---|---|
| BNY | 247.2% | |
| Market (SPY) | 86.7% | 58.6% |
| Sector (XLF) | 71.6% | 71.4% |
Price Returns Compared
| 2021 | 2022 | 2023 | 2024 | 2025 | 2026 | Total [1] | |
|---|---|---|---|---|---|---|---|
| Returns | |||||||
| BNY Return | 41% | -19% | 19% | 52% | 54% | 20% | 279% |
| Peers Return | 36% | -14% | 7% | 28% | 31% | 12% | 133% |
| S&P 500 Return | 27% | -19% | 24% | 23% | 16% | 14% | 108% |
Monthly Win Rates [3] | |||||||
| BNY Win Rate | 67% | 42% | 58% | 83% | 75% | 60% | |
| Peers Win Rate | 60% | 45% | 47% | 67% | 65% | 50% | |
| S&P 500 Win Rate | 75% | 42% | 67% | 75% | 67% | 50% | |
Max Drawdowns [4] | |||||||
| BNY Max Drawdown | -14% | -40% | -23% | -7% | -18% | -17% | |
| Peers Max Drawdown | -13% | -40% | -29% | -13% | -23% | -17% | |
| S&P 500 Max Drawdown | -5% | -25% | -10% | -8% | -19% | -9% | |
[1] Cumulative total returns since the beginning of 2021
[2] Peers: STT, NTRS, JPM, BLK, SCHW.
[3] Win Rate = % of calendar months in which monthly returns were positive
[4] Max drawdown represents maximum peak-to-trough decline within a year
[5] 2026 data is for the year up to 10/15/2026 (YTD)
How Low Can It Go
| Event | BNY | S&P 500 |
|---|---|---|
| 2025 US Tariff Shock | ||
| % Loss | -17.0% | -18.8% |
| % Gain to Breakeven | 20.5% | 23.1% |
| Time to Breakeven | 39 days | 79 days |
| 2023 SVB Regional Banking Crisis | ||
| % Loss | -22.9% | -6.7% |
| % Gain to Breakeven | 29.7% | 7.1% |
| Time to Breakeven | 211 days | 31 days |
| 2022 Inflation Shock & Fed Tightening | ||
| % Loss | -34.8% | -24.5% |
| % Gain to Breakeven | 53.4% | 32.4% |
| Time to Breakeven | 457 days | 427 days |
| 2020 COVID-19 Crash | ||
| % Loss | -40.1% | -33.7% |
| % Gain to Breakeven | 67.0% | 50.9% |
| Time to Breakeven | 289 days | 140 days |
| Q4 2018 Fed Policy Error / Growth Scare | ||
| % Loss | -14.2% | -19.2% |
| % Gain to Breakeven | 16.6% | 23.8% |
| Time to Breakeven | 25 days | 105 days |
| 2015-2016 China Devaluation / Global Growth Scare | ||
| % Loss | -25.0% | -12.2% |
| % Gain to Breakeven | 33.4% | 13.9% |
| Time to Breakeven | 256 days | 62 days |
In The Past
Bank of New York Mellon's stock fell -17.0% during the 2025 US Tariff Shock. Such a loss loss requires a 20.5% gain to breakeven.
Preserve Wealth
Limiting losses and compounding gains is essential to preserving wealth.
Asset Allocation
Actively managed asset allocation strategies protect wealth. Learn more.
| Event | BNY | S&P 500 |
|---|---|---|
| 2023 SVB Regional Banking Crisis | ||
| % Loss | -22.9% | -6.7% |
| % Gain to Breakeven | 29.7% | 7.1% |
| Time to Breakeven | 211 days | 31 days |
| 2022 Inflation Shock & Fed Tightening | ||
| % Loss | -34.8% | -24.5% |
| % Gain to Breakeven | 53.4% | 32.4% |
| Time to Breakeven | 457 days | 427 days |
| 2020 COVID-19 Crash | ||
| % Loss | -40.1% | -33.7% |
| % Gain to Breakeven | 67.0% | 50.9% |
| Time to Breakeven | 289 days | 140 days |
| 2015-2016 China Devaluation / Global Growth Scare | ||
| % Loss | -25.0% | -12.2% |
| % Gain to Breakeven | 33.4% | 13.9% |
| Time to Breakeven | 256 days | 62 days |
| 2011 US Debt Ceiling Crisis & European Contagion | ||
| % Loss | -30.9% | -17.9% |
| % Gain to Breakeven | 44.6% | 21.8% |
| Time to Breakeven | 395 days | 123 days |
| 2010 Eurozone Sovereign Debt Crisis / Flash Crash | ||
| % Loss | -22.1% | -15.4% |
| % Gain to Breakeven | 28.4% | 18.2% |
| Time to Breakeven | 187 days | 125 days |
| 2008-2009 Global Financial Crisis | ||
| % Loss | -62.4% | -53.4% |
| % Gain to Breakeven | 165.7% | 114.4% |
| Time to Breakeven | 2247 days | 1085 days |
In The Past
Bank of New York Mellon's stock fell -17.0% during the 2025 US Tariff Shock. Such a loss loss requires a 20.5% gain to breakeven.
Preserve Wealth
Limiting losses and compounding gains is essential to preserving wealth.
Asset Allocation
Actively managed asset allocation strategies protect wealth. Learn more.
About Bank of New York Mellon (BNY)
Bank of New York Mellon (BNY) is a venerable global financial services company that primarily operates as a foundational partner for institutions and high-net-worth individuals, rather than a traditional consumer bank. With a history spanning over two centuries, BNY Mellon specializes in helping clients manage and service their financial assets across various markets. It acts as a critical back-office and asset management provider, underpinning much of the global financial infrastructure.
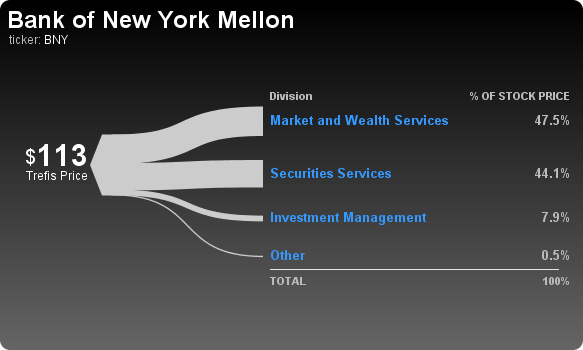
The company's core offerings span several key areas. Through its Securities Services segment, BNY Mellon provides essential administrative support for financial assets, including custody, trust and depositary services, accounting, and securities lending for institutional investors. Its Market and Wealth Services segment offers broader financial solutions such as clearing, technology platforms, trading, prime brokerage, and integrated cash management services covering payments, foreign exchange, and liquidity for corporations. Furthermore, the Investment and Wealth Management segment delivers investment strategies, wealth planning, private banking, and asset management services.
BNY Mellon serves a diverse and sophisticated client base globally. Its primary customers include central banks, sovereign wealth funds, financial institutions, asset managers, insurance companies, and large corporations. Additionally, it caters to the specialized needs of high-net-worth individuals and family offices, providing comprehensive wealth and estate planning, investment management, and private banking solutions.
AI Analysis | Feedback
Here are 1-3 brief analogies for Bank of New York Mellon:
The AWS for Wall Street.
The 'Intel Inside' for financial institutions.
AI Analysis | Feedback
- Global Custody & Trust Services: Safekeeping of assets, fiduciary, and administrative services for institutional clients globally.
- Fund Administration & Accounting: Comprehensive operational and accounting support for various investment funds, including ETFs and private equity.
- Clearing & Collateral Management: Services for processing and settling securities transactions and managing associated collateral.
- Investment Management: Developing and distributing diverse investment strategies and products for institutional and individual clients.
- Wealth Management & Private Banking: Integrated wealth and estate planning, custody, and private banking services for high-net-worth individuals and family offices.
- Cash & Payment Management: Solutions for corporate payments, foreign exchange, liquidity management, and trade finance.
- Securities Lending & Liquidity Services: Facilitating short-term borrowing and lending of securities and providing liquidity solutions.
- Technology & Data Solutions: Offering enterprise data management and technology platforms to financial institutions.
AI Analysis | Feedback
The public company Bank of New York Mellon (BNY) primarily serves a diverse range of institutional clients and high-net-worth individuals. While specific customer names are not disclosed in the provided company description, its major customer categories include:
- Central banks and sovereigns
- Financial institutions
- Asset managers
- Insurance companies
- Corporations
- Local authorities
- High net-worth individuals
- Family offices
AI Analysis | Feedback
Alphabet Inc. (GOOGL)
Microsoft Corporation (MSFT)
London Stock Exchange Group plc (LSEG)
AI Analysis | Feedback
Robin Vince, Chief Executive Officer
Robin Vince became CEO of BNY Mellon in 2022, having joined the company in 2020. Prior to his tenure at BNY Mellon, he spent 26 years at Goldman Sachs, where he held various leadership positions including chief risk officer, treasurer, head of operations, and CEO of Goldman Sachs International Bank.
Dermot McDonogh, Chief Financial Officer
Dermot McDonogh was appointed Chief Financial Officer of BNY Mellon, effective February 1, 2023, and joined the company in 2022. Before joining BNY Mellon, he worked at Goldman Sachs for over 25 years, where he held leadership roles such as Chief Operating Officer for EMEA and Chief Executive Officer of Goldman Sachs International Bank.
James T. Crowley, Executive Vice Chair
James T. Crowley serves as an Executive Vice Chair at BNY. He is also the Chief Executive Officer for Pershing, a BNY Mellon company, a role he assumed in July 2019. He previously served as Pershing's Chief Operating Officer. Crowley has held various roles in operations and relationship management during his career at Pershing, which he joined in August 2017. He is on the Board of Governors of FINRA.
Hani Kablawi, Executive Vice Chair, Head of Middle East, Africa and Asia Pacific
Hani Kablawi is an Executive Vice Chair and Head of Middle East, Africa and Asia Pacific for BNY. He joined the Bank of New York in 1997. His career at BNY Mellon has included roles such as CEO for the Middle East and Africa in 2008, CEO of global client management for EMEA, and CEO of EMEA asset servicing. Previously, he was also CEO of global asset servicing and chairman of EMEA.
Rajashree Datta, Chief Risk Officer
Rajashree Datta is the Chief Risk Officer at BNY and a member of the company's Executive Committee. She joined BNY in December 2024 as Deputy Chief Risk Officer and is set to succeed as Chief Risk Officer in 2025. Prior to BNY, Datta spent 24 years at Goldman Sachs, where she was a Partner and Global Head of Finance Risk, overseeing liquidity, capital, and accrual rate risks. She began her career in Investment Banking at Goldman Sachs in 2000.
AI Analysis | Feedback
Key Risks to Bank of New York Mellon (BNY)
- Competition and Technological Disruption: The financial services sector in which BNY Mellon operates is highly competitive. The company faces significant challenges from both established financial institutions like JPMorgan Chase, State Street, and Northern Trust, as well as rapidly evolving fintech firms. These competitors are vying for market share across BNY Mellon's various segments, including custody and fund administration services. The rise of digital assets and advancements in artificial intelligence are reshaping the industry, presenting both opportunities and threats. Fintech innovation, in particular, poses a substantial risk to traditional service models, requiring BNY Mellon to continuously invest in technology and adapt its offerings to maintain its competitive edge and diversify revenue streams.
- Regulatory and Economic Environment: BNY Mellon is highly susceptible to evolving regulatory frameworks and shifts in global economic conditions. Changes in regulations, including those related to data privacy, cybersecurity, and capital requirements, can increase compliance costs and impact business operations. Macroeconomic factors such as interest rate sensitivity and inflation can also significantly affect the company's financial performance. Successfully navigating these complex and often unpredictable regulatory and economic landscapes is crucial for maintaining market share and profitability.
- Operational Risks, including Cybersecurity: Given BNY Mellon's extensive global operations and its role in managing trillions in assets and processing vast numbers of transactions, it is exposed to significant operational risks. These risks encompass potential failures in internal processes, systems, or human error, as well as external events such as natural disasters or geopolitical incidents. Cybersecurity threats are a particularly prominent operational risk. Successful cyberattacks or significant technology failures could lead to financial losses, reputational damage, and disruptions to client services, underscoring the critical need for robust risk controls and advanced security measures.
AI Analysis | Feedback
The clear emerging threat for Bank of New York Mellon (BNY) is the potential disintermediation of its core custody, clearing, settlement, and payment services due to the advancement and adoption of distributed ledger technology (DLT), including tokenized assets and central bank digital currencies (CBDCs). DLT has the capability to enable direct, peer-to-peer ownership and transfer of securities and other assets, potentially reducing the need for traditional intermediaries that provide safekeeping, accounting, and transfer agency functions. Similarly, CBDCs could fundamentally alter the infrastructure for payments and interbank settlements, impacting BNY's cash management and treasury services by offering alternative, direct pathways for funds flow.
AI Analysis | Feedback
The Bank of New York Mellon Corporation (BNY) operates across various financial services segments. The addressable markets for its main products and services, on a global basis, are sized as follows:
Securities Services
- The global securities services market was valued at $120.8 billion in 2024 and is projected to reach $205.3 billion by 2033, growing at a compound annual growth rate (CAGR) of 6.1%.
- Specifically, the global custody services market size was estimated at $48.84 billion in 2025 and is expected to grow to $75.87 billion by 2030 at a CAGR of 9.3%. North America was the largest region in this market in 2025. Other estimates place the global custody services market at USD 41.61 billion in 2023, projected to reach USD 85.33 billion by 2033.
Investment and Wealth Management
- The global wealth management market was valued at $1.87 trillion in 2025 and is projected to expand to $3.43 trillion by 2034, advancing at a CAGR of 6.9% over the forecast period 2026 to 2034. North America dominated with a 38.6% revenue share in 2025.
- The global asset management market, specifically for services, was valued at USD 432.77 billion in 2025 and is projected to grow to USD 1,122.04 billion by 2034, exhibiting a CAGR of 12.6%. North America dominated this market with a 47.00% share in 2025.
- In terms of assets under management (AuM), the global asset management industry reached a record-breaking $128 trillion in 2024.
Cash Management Services
- The global cash management system market size was estimated at USD 17.6 billion in 2024 and is projected to reach USD 36.92 billion by 2030, growing at a CAGR of 13.3%.
- Another report indicates the cash management system market size is estimated at USD 21.78 billion in 2026, growing from USD 20.35 billion in 2025, and is projected to reach USD 30.56 billion by 2031. North America held a 39.05% share in 2025.
Foreign Exchange (FX) Services
- The global foreign exchange market size, focusing on the services aspect, was valued at USD 917.9 billion in 2025 and is projected to reach USD 1,592.1 billion by 2034, exhibiting a CAGR of 6.31%. North America dominates this market, holding a significant share of 25.8% in 2025.
- The daily turnover in the global foreign exchange market was $9.6 trillion in April 2025.
Prime Brokerage
- The global prime brokerage market was valued at $38.7 billion in 2024 and is projected to reach $65.2 billion by 2033, growing at a CAGR of 6.1%.
- Global prime brokerage equity finance revenues are projected to reach $37 billion in 2025.
AI Analysis | Feedback
The Bank of New York Mellon (BNY) anticipates several key drivers to fuel its revenue growth over the next two to three years:
- Net Interest Income (NII) Expansion: BNY Mellon expects continued growth in its net interest income, with guidance for approximately 10% year-over-year increase in NII for the full year 2026. This growth is primarily driven by the reinvestment of maturing securities at higher yields and overall balance sheet expansion.
- Broad-Based Fee Revenue Growth from Client Activity and New Business: The company is focused on generating broad-based fee revenue growth, particularly within its Securities Services and Market and Wealth Services segments. This growth is expected to come from higher client activity, strategic client wins, and the acquisition of new business across its diversified offerings.
- Strategic Investment and Expansion in Digital Assets and Artificial Intelligence (AI): BNY Mellon is heavily investing in and expanding its capabilities in digital assets, including custody services and leveraging AI. The integration of AI is aimed at developing new products, enhancing existing platforms, improving operational efficiency, and creating critical technical capabilities, with over 200 AI solutions already in production.
- Scaling Integrated, Multi-Platform Client Solutions: A core component of BNY Mellon's growth strategy involves deepening client relationships and delivering integrated, multi-platform solutions. This "One BNY" approach focuses on encouraging clients to utilize a wider range of the company's services across different business lines, thereby driving organic growth and increasing client engagement.
AI Analysis | Feedback
Share Repurchases
- In April 2026, the Board of Directors approved a new share buyback program totaling $10 billion.
- The company authorized $6.0 billion for common share repurchases in April 2024, building upon an existing January 2023 authorization of up to $5.0 billion.
- In 2025, BNY repurchased 36.8 million common shares for a total of $3.5 billion.
Share Issuance
- The number of outstanding common shares has generally decreased over the last few years, primarily due to share repurchases.
- Outstanding shares decreased by 5.29% in 2024 and 5.48% in 2023.
- As of December 31, 2025, BNY had 688,236,337 common shares outstanding.
Outbound Investments
- BNY Mellon completed the acquisition of Archer, a technology-driven investment management solutions provider, noted as an accomplishment between 2022 and 2025.
Capital Expenditures
- Investments have focused on transforming the company into a "platform company" model to streamline client delivery and internal operations.
- Significant capital has been allocated to technology and innovation, including the development and embrace of artificial intelligence (AI) initiatives such as the Eliza AI platform.
- The company is committed to advancing global financial markets and infrastructure, including investments in distributed ledger and other emerging technologies.
Peer Outperformance in Asset Management & Custody Banks
| Industry | Names | 1Y med | 3Y med | 5Y med | Top 3 by 5Y |
|---|---|---|---|---|---|
| Reinsurance | 6 | 21.7% | 64.9% | 115.6% | SPNT 168% · RGA 142% · RNR 141% |
| Diversified Banks | 12 | 27.2% | 128.9% | 90.2% | CM 138% · JPM 128% · RY 123% |
| Investment Banking & Brokerage | 13 | -9.8% | 97.3% | 81.5% | IBKR 397% · SNEX 192% · GS 148% |
| Life & Health Insurance | 20 | 12.2% | 52.2% | 80.4% | JXN 487% · UNM 291% · MFC 175% |
| Multi-Sector Holdings | 4 | 5.9% | 51.0% | 68.9% | BRK-B 85% · VOYA 53% · JEF 29% |
| Property & Casualty Insurance | 42 | 9.8% | 72.7% | 63.1% | TRV 171% · PGR 162% · ACGL 146% |
| Multi-line Insurance | 9 | 6.1% | 60.9% | 59.6% | GNW 106% · L 92% · AIZ 89% |
| Regional Banks | 263 | 26.4% | 89.6% | 50.2% | CBC 221% · FCNCA 150% · FBP 141% |
| Financial Exchanges & Data | 15 | 5.7% | 35.6% | 30.5% | VIRT 162% · CBOE 162% · CME 69% |
| Consumer Finance | 30 | -0.6% | 75.7% | 20.9% | ENVA 392% · EZPW 314% · FCFS 166% |
| Insurance Brokers | 15 | -14.6% | -0.5% | 10.9% | LIFE 347% · ARX 88% · AJG 62% |
| Diversified Financial Services | 4 | -8.1% | 16.6% | 9.3% | FRHC 178% · EQH 87% |
| Asset Management & Custody Banks ← | 83 | -12.2% | 14.9% | 5.9% | WT 298% · AAMI 244% · VCTR 237% |
| Specialized Finance | 3 | 12.0% | 32.7% | -10.6% | CACC -11% · HASI -21% |
| Commercial & Residential Mortgage Finance | 14 | -55.3% | 17.0% | -10.6% | FNMA 383% · FMCC 344% · ACT 163% |
| Mortgage REITs | 33 | -19.8% | -3.5% | -32.7% | RITM 23% · DX 20% · AGNC 9% |
| Transaction & Payment Processing Services | 17 | 2.8% | 1.4% | -44.9% | V 80% · MA 78% · CPAY 44% |
| Diversified Capital Markets | 20 | -48.2% | 14.3% | -66.0% | LPLA 94% · TW 37% · RIOT -46% |
Latest Trefis Analyses
| Title | Date | |
|---|---|---|
| ARTICLES | ||
| Large Cap Stocks Trading At 52-Week High | 04/21/2026 | |
| Bank of New York Mellon Stock Surges 12%, With A 7-Day Winning Spree | 04/09/2026 | |
| S&P 500 Stocks Trading At 52-Week High | 02/06/2026 | |
| How Will Bank of New York Mellon Stock React To Its Upcoming Earnings? | 01/10/2026 |
| Title | |
|---|---|
| DASHBOARDS |
Research & Analysis
Invest in Strategies
Wealth Management
Peer Comparisons
| Peers to compare with: |
Financials
| Median | |
|---|---|
| Name | |
| Mkt Price | 166.20 |
| Mkt Cap | 130.9 |
| Rev LTM | 23,545 |
| Op Inc LTM | 9,006 |
| FCF LTM | 1,806 |
| FCF 3Y Avg | 1,732 |
| CFO LTM | 3,522 |
| CFO 3Y Avg | 2,898 |
Growth & Margins
| Median | |
|---|---|
| Name | |
| Rev Chg LTM | 14.0% |
| Rev Chg 3Y Avg | 9.5% |
| Rev Chg Q | 19.3% |
| QoQ Delta Rev Chg LTM | 4.6% |
| Op Inc Chg LTM | 17.2% |
| Op Inc Chg 3Y Avg | 13.9% |
| Op Mgn LTM | 33.0% |
| Op Mgn 3Y Avg | 35.0% |
| QoQ Delta Op Mgn LTM | 0.3% |
| CFO/Rev LTM | 15.7% |
| CFO/Rev 3Y Avg | 18.2% |
| FCF/Rev LTM | 10.2% |
| FCF/Rev 3Y Avg | 13.4% |
Segment Financials
Revenue by Segment| $ Mil | 2025 | 2024 | 2023 | 2022 | 2021 |
|---|---|---|---|---|---|
| Securities Services | 9,730 | 8,916 | 8,598 | 8,002 | 7,244 |
| Market and Wealth Services | 7,000 | 6,264 | 5,870 | 5,299 | 4,741 |
| Investment and wealth management | 3,258 | 3,389 | 3,155 | 3,563 | 4,042 |
| Other | 58 | 37 | 72 | -322 | -108 |
| Total | 20,046 | 18,606 | 17,695 | 16,542 | 15,919 |
| $ Mil | 2015 | 2014 | 2013 | 2012 | 2011 |
|---|---|---|---|---|---|
| Investment Services | 3,138 | 1,935 | 2,754 | 2,251 | 3,114 |
| Investment Management | 1,050 | 901 | 994 | 923 | 723 |
| Other | -17 | 643 | -186 | 52 | -270 |
| Total | 4,171 | 3,479 | 3,562 | 3,226 | 3,567 |
| $ Mil | 2004 |
|---|---|
| Financial Markets | 49,615 |
| Servicing & Fiduciary Businesses | 22,450 |
| Corporate Banking | 17,482 |
| Retail Banking | 5,645 |
| Total | 95,192 |
Price Behavior
| Market Price | $137.64 | |
| Market Cap ($ Bil) | 94.4 | |
| First Trading Date | 05/03/1973 | |
| Distance from 52W High | -16.5% | |
| 50 Days | 200 Days | |
| DMA Price | $154.74 | $137.31 |
| DMA Trend | down | up |
| Distance from DMA | -11.1% | 0.2% |
| 3M | 1YR | |
| Volatility | 17.9% | 21.7% |
| Downside Capture | 85.05 | 75.79 |
| Upside Capture | 14.07 | 97.32 |
| Correlation (S&P 500) | 35.5% | 44.4% |
| 1M | 2M | 3M | 6M | 1Y | 3Y | |
|---|---|---|---|---|---|---|
| Beta | 0.71 | 0.41 | 0.80 | 0.60 | 0.76 | 0.82 |
| Up Beta | -0.37 | 0.19 | 0.46 | 0.20 | 0.53 | 0.75 |
| Down Beta | -0.13 | 1.39 | 1.51 | 0.58 | 0.72 | 0.96 |
| Up Capture | 38% | 9% | 72% | 83% | 95% | 87% |
| Bmk +ve Days | 6 | 16 | 27 | 66 | 132 | 424 |
| Stock +ve Days | 8 | 20 | 31 | 70 | 140 | 438 |
| Down Capture | 207% | 91% | 82% | 67% | 81% | 83% |
| Bmk -ve Days | 16 | 26 | 37 | 60 | 120 | 328 |
| Stock -ve Days | 14 | 22 | 33 | 56 | 110 | 310 |
[1] Upside and downside betas calculated using positive and negative benchmark daily returns respectively
Based On 1-Year Data
| Annualized Return | Annualized Volatility | Sharpe Ratio | Correlation with BNY | |
|---|---|---|---|---|
| BNY | 30.9% | 21.7% | 1.15 | - |
| Sector ETF (XLF) | 3.7% | 14.6% | 0.02 | 59.3% |
| Equity (SPY) | 17.6% | 12.7% | 0.99 | 45.2% |
| Gold (GLD) | 0.5% | 29.5% | 0.02 | 24.2% |
| Commodities (DBC) | 50.9% | 20.7% | 1.88 | 0.5% |
| Real Estate (VNQ) | 4.7% | 13.7% | 0.08 | 24.7% |
| Bitcoin (BTCUSD) | -28.1% | 43.7% | -0.63 | 27.7% |
Smart multi-asset allocation framework can stack odds in your favor. Learn How
Based On 5-Year Data
| Annualized Return | Annualized Volatility | Sharpe Ratio | Correlation with BNY | |
|---|---|---|---|---|
| BNY | 23.7% | 24.3% | 0.84 | - |
| Sector ETF (XLF) | 8.8% | 18.3% | 0.34 | 77.8% |
| Equity (SPY) | 13.4% | 17.1% | 0.60 | 63.0% |
| Gold (GLD) | 18.5% | 18.9% | 0.79 | 8.6% |
| Commodities (DBC) | 9.7% | 19.5% | 0.38 | 16.5% |
| Real Estate (VNQ) | 1.1% | 18.8% | -0.05 | 49.7% |
| Bitcoin (BTCUSD) | 8.7% | 51.8% | 0.35 | 24.2% |
Smart multi-asset allocation framework can stack odds in your favor. Learn How
Based On 10-Year Data
| Annualized Return | Annualized Volatility | Sharpe Ratio | Correlation with BNY | |
|---|---|---|---|---|
| BNY | 15.8% | 26.9% | 0.57 | - |
| Sector ETF (XLF) | 12.8% | 22.1% | 0.53 | 80.9% |
| Equity (SPY) | 15.4% | 17.9% | 0.73 | 65.3% |
| Gold (GLD) | 12.2% | 16.4% | 0.61 | 0.4% |
| Commodities (DBC) | 8.2% | 18.1% | 0.37 | 25.5% |
| Real Estate (VNQ) | 5.0% | 20.7% | 0.20 | 50.7% |
| Bitcoin (BTCUSD) | 63.1% | 66.2% | 1.03 | 17.6% |
Smart multi-asset allocation framework can stack odds in your favor. Learn How
Earnings Returns History
Updated 10/15/2026| Forward Returns | |||
|---|---|---|---|
| Earnings Date | 1D Returns | 5D Returns | 21D Returns |
| 7/15/2026 | 5.1% | 2.8% | 5.9% |
| 4/16/2026 | 2.2% | 3.0% | 3.5% |
| 1/13/2026 | 1.9% | 0.0% | 1.3% |
| 10/16/2025 | -2.0% | -1.7% | 2.4% |
| 7/15/2025 | -0.1% | 3.5% | 9.4% |
| 4/11/2025 | 1.4% | -0.4% | 14.4% |
| 1/15/2025 | 8.0% | 11.0% | 15.0% |
| 10/11/2024 | -0.4% | 4.4% | 4.1% |
| ... | |||
| SUMMARY STATS | |||
| # Positive | 15 | 16 | 20 |
| # Negative | 9 | 8 | 4 |
| Median Positive | 3.8% | 3.5% | 6.5% |
| Median Negative | -2.0% | -2.4% | -7.5% |
| Max Positive | 8.0% | 11.0% | 15.0% |
| Max Negative | -7.3% | -9.8% | -9.5% |
| Forward Returns | |||
|---|---|---|---|
| Earnings Date | 1D Returns | 5D Returns | 21D Returns |
| 7/15/2026 | 5.1% | 2.8% | 5.9% |
| 4/16/2026 | 2.2% | 3.0% | 3.5% |
| 1/13/2026 | 1.9% | 0.0% | 1.3% |
| 10/16/2025 | -2.0% | -1.7% | 2.4% |
| 7/15/2025 | -0.1% | 3.5% | 9.4% |
| 4/11/2025 | 1.4% | -0.4% | 14.4% |
| 1/15/2025 | 8.0% | 11.0% | 15.0% |
| 10/11/2024 | -0.4% | 4.4% | 4.1% |
| 7/12/2024 | 5.2% | 3.3% | 4.5% |
| 4/16/2024 | -2.0% | 3.8% | 6.7% |
| 1/12/2024 | 4.0% | 5.2% | 6.3% |
| 10/17/2023 | 3.8% | -0.8% | 12.1% |
| 7/18/2023 | 4.1% | 4.5% | 2.9% |
| 4/18/2023 | 1.5% | -0.9% | -9.5% |
| 1/13/2023 | 1.8% | 3.0% | 8.6% |
| 10/17/2022 | 5.1% | 4.7% | 14.5% |
| 7/15/2022 | 7.3% | 7.5% | 12.0% |
| 4/18/2022 | -2.3% | -6.5% | -7.8% |
| 1/18/2022 | -1.1% | -7.4% | -1.6% |
| 10/19/2021 | 0.4% | 3.5% | 3.6% |
| 7/15/2021 | -1.2% | 1.6% | 12.1% |
| 4/16/2021 | -4.0% | -3.0% | 8.6% |
| 1/20/2021 | -7.3% | -9.8% | -7.2% |
| 10/16/2020 | 2.1% | 0.9% | 4.9% |
| SUMMARY STATS | |||
| # Positive | 15 | 16 | 20 |
| # Negative | 9 | 8 | 4 |
| Median Positive | 3.8% | 3.5% | 6.5% |
| Median Negative | -2.0% | -2.4% | -7.5% |
| Max Positive | 8.0% | 11.0% | 15.0% |
| Max Negative | -7.3% | -9.8% | -9.5% |
SEC Filings
Expand for More| Report Date | Filing Date | Filing |
|---|---|---|
| 06/30/2026 | 07/31/2026 | 10-Q |
| 03/31/2026 | 05/01/2026 | 10-Q |
| 12/31/2025 | 02/25/2026 | 10-K |
| 09/30/2025 | 10/31/2025 | 10-Q |
| 06/30/2025 | 08/01/2025 | 10-Q |
| 03/31/2025 | 05/02/2025 | 10-Q |
| 12/31/2024 | 02/27/2025 | 10-K |
| 09/30/2024 | 11/01/2024 | 10-Q |
| 06/30/2024 | 08/02/2024 | 10-Q |
| 03/31/2024 | 05/03/2024 | 10-Q |
| 12/31/2023 | 02/28/2024 | 10-K |
| 09/30/2023 | 11/03/2023 | 10-Q |
| 06/30/2023 | 08/04/2023 | 10-Q |
| 03/31/2023 | 05/05/2023 | 10-Q |
| 12/31/2022 | 02/27/2023 | 10-K |
| 09/30/2022 | 11/07/2022 | 10-Q |
| Report Date | Filing Date | Filing |
|---|---|---|
| 06/30/2026 | 07/31/2026 | 10-Q |
| 03/31/2026 | 05/01/2026 | 10-Q |
| 12/31/2025 | 02/25/2026 | 10-K |
| 09/30/2025 | 10/31/2025 | 10-Q |
| 06/30/2025 | 08/01/2025 | 10-Q |
| 03/31/2025 | 05/02/2025 | 10-Q |
| 12/31/2024 | 02/27/2025 | 10-K |
| 09/30/2024 | 11/01/2024 | 10-Q |
| 06/30/2024 | 08/02/2024 | 10-Q |
| 03/31/2024 | 05/03/2024 | 10-Q |
| 12/31/2023 | 02/28/2024 | 10-K |
| 09/30/2023 | 11/03/2023 | 10-Q |
| 06/30/2023 | 08/04/2023 | 10-Q |
| 03/31/2023 | 05/05/2023 | 10-Q |
| 12/31/2022 | 02/27/2023 | 10-K |
| 09/30/2022 | 11/07/2022 | 10-Q |
| 06/30/2022 | 08/05/2022 | 10-Q |
| 03/31/2022 | 05/06/2022 | 10-Q |
| 12/31/2021 | 02/25/2022 | 10-K |
| 09/30/2021 | 11/05/2021 | 10-Q |
| 06/30/2021 | 08/05/2021 | 10-Q |
| 03/31/2021 | 05/06/2021 | 10-Q |
| 12/31/2020 | 02/25/2021 | 10-K |
| 09/30/2020 | 11/05/2020 | 10-Q |
| 06/30/2020 | 08/06/2020 | 10-Q |
| 03/31/2020 | 05/07/2020 | 10-Q |
| 12/31/2019 | 02/27/2020 | 10-K |
| 09/30/2019 | 11/07/2019 | 10-Q |
Insider Activity
Updated 10/5/2026| # | Owner | Title | Holding | Action | Filing Date | Price | Shares | Transacted Value | Value of Held Shares | Form |
|---|---|---|---|---|---|---|---|---|---|---|
| 1 | Minaya, Jose | Senior Executive VP | Direct | Sell | 9302026 | 148.79 | 3,520 | 523,733 | 26,309,270 | Form |
| 2 | Minaya, Jose | Senior Executive VP | Direct | Sell | 8312026 | 162.64 | 3,520 | 572,489 | 29,330,960 | Form |
| 3 | McDonogh, Dermot | Chief Financial Officer | Family Trust | Sell | 7312026 | 155.26 | 31,800 | Form | ||
| 4 | Perez, Alejandro | Sr. Executive Vice President | Direct | Sell | 4212026 | 137.01 | 12,504 | 1,713,156 | 8,578,487 | Form |
| 5 | Kurimsky, Kurtis R | Corporate Controller | Direct | Sell | 4212026 | 136.02 | 5,290 | 719,523 | 2,347,495 | Form |
| # | Owner | Title | Holding | Action | Filing Date | Price | Shares | Transacted Value | Value of Held Shares | Form |
|---|---|---|---|---|---|---|---|---|---|---|
| 1 | Minaya, Jose | Senior Executive VP | Direct | Sell | 9302026 | 148.79 | 3,520 | 523,733 | 26,309,270 | Form |
| 2 | Minaya, Jose | Senior Executive VP | Direct | Sell | 8312026 | 162.64 | 3,520 | 572,489 | 29,330,960 | Form |
| 3 | McDonogh, Dermot | Chief Financial Officer | Family Trust | Sell | 7312026 | 155.26 | 31,800 | Form | ||
| 4 | Perez, Alejandro | Sr. Executive Vice President | Direct | Sell | 4212026 | 137.01 | 12,504 | 1,713,156 | 8,578,487 | Form |
| 5 | Kurimsky, Kurtis R | Corporate Controller | Direct | Sell | 4212026 | 136.02 | 5,290 | 719,523 | 2,347,495 | Form |
| 6 | McCarthy, J Kevin | SEVP & General Counsel | Direct | Sell | 4212026 | 136.50 | 30,000 | 4,094,919 | 6,857,298 | Form |
| 7 | Hobbs, Shannon Marie | Senior Executive VP | Direct | Sell | 4212026 | 137.05 | 297 | 40,705 | 2,084,029 | Form |
Bank of New York Mellon — Investor Video Playlist


Industry Resources
| Financials Resources |
| Federal Reserve Economic Data |
| Federal Reserve |
| FDIC Data |
| American Banker |
| The Banker |
| Banking Technology |
| Asset Management & Custody Banks Resources |
| Pensions & Investments |
| Institutional Investor |
| Ignites |
External Quote Links
| Y Finance | Barrons |
| TradingView | Morningstar |
| SeekingAlpha | ValueLine |
| Motley Fool | Robinhood |
| CNBC | Etrade |
| MarketWatch | Unusual Whales |
| YCharts | Perplexity Finance |
| FinViz |
Prefer one of these to Trefis? Tell us why.