
Travelers Companies (TRV)
Market Price (10/21/2026): $394.74 | Market Cap: $81.7 BilInvestor Relations Sector: Financials | Industry: Property & Casualty Insurance
Travelers Companies (TRV)
Market Price (10/21/2026): $394.74Market Cap: $81.7 BilSector: FinancialsIndustry: Property & Casualty Insurance
Investment Highlights Why It Matters Detailed financial logic regarding cash flow yields vs trend-riding momentum.
Attractive yieldTotal YieldTotal Yield = Earnings Yield + Dividend Yield, Earnings Yield = Net Income / Market Cap Dividend Yield = Total Dividends / Market Cap is 11%, ERPEquity Risk Premium (ERP) = Total Yield - Risk Free Rate, Reflects the premium above risk free assets offered by the investment. is 6.1%, FCF Yield is 13% Cash is significant % of market capNet D/ENet Debt/Equity. Debt net of cash. Negative indicates net cash. Equity is taken as the Market Capitalization is -105% Attractive cash flow generationCFO/Rev LTMCash Flow from Operations / Revenue (Sales), Last Twelve Months (LTM) is 22%, FCF/Rev LTMFree Cash Flow / Revenue (Sales), Last Twelve Months (LTM) is 22%, CFO LTM is 11 Bil, FCF LTM is 11 Bil Stock buyback supportStock Buyback 3Y Total is 9.1 Bil Low stock price volatilityVol 12M is 21% Megatrend and thematic driversMegatrends include AI in Financial Services, Cybersecurity, Electric Vehicles & Autonomous Driving, Sustainable Infrastructure, Show more. | Trading close to highsDist 52W High is 0.0%, Dist 3Y High is 0.0% | Weak revenue growthRev Chg QQuarterly Revenue Change % is -0.5% Key risksTRV key risks include [1] substantial losses from catastrophic events exacerbated by climate change, Show more. |
| Attractive yieldTotal YieldTotal Yield = Earnings Yield + Dividend Yield, Earnings Yield = Net Income / Market Cap Dividend Yield = Total Dividends / Market Cap is 11%, ERPEquity Risk Premium (ERP) = Total Yield - Risk Free Rate, Reflects the premium above risk free assets offered by the investment. is 6.1%, FCF Yield is 13% |
| Cash is significant % of market capNet D/ENet Debt/Equity. Debt net of cash. Negative indicates net cash. Equity is taken as the Market Capitalization is -105% |
| Attractive cash flow generationCFO/Rev LTMCash Flow from Operations / Revenue (Sales), Last Twelve Months (LTM) is 22%, FCF/Rev LTMFree Cash Flow / Revenue (Sales), Last Twelve Months (LTM) is 22%, CFO LTM is 11 Bil, FCF LTM is 11 Bil |
| Stock buyback supportStock Buyback 3Y Total is 9.1 Bil |
| Low stock price volatilityVol 12M is 21% |
| Megatrend and thematic driversMegatrends include AI in Financial Services, Cybersecurity, Electric Vehicles & Autonomous Driving, Sustainable Infrastructure, Show more. |
| Trading close to highsDist 52W High is 0.0%, Dist 3Y High is 0.0% |
| Weak revenue growthRev Chg QQuarterly Revenue Change % is -0.5% |
| Key risksTRV key risks include [1] substantial losses from catastrophic events exacerbated by climate change, Show more. |
Qualitative Assessment
AI Analysis | Feedback
Travelers Companies (TRV) stock has gained about 20% since 6/30/2026 because of the following key factors:
1. Exceptional Fiscal Q2 2026 and Q3 2026 Earnings Outperformance.
Travelers significantly surpassed analyst expectations for both fiscal Q2 and Q3 2026 earnings within the specified period. For fiscal Q2 2026, reported on July 17, 2026, the company posted earnings per share (EPS) of $10.04, substantially beating the consensus estimate of $5.41, with revenue reaching $12.15 billion against an $11.26 billion consensus. This strong momentum continued into fiscal Q3 2026, where Travelers reported core EPS of $9.18, significantly higher than analyst forecasts ranging from $7.07 to $7.39, on revenues of $12.41 billion, exceeding the anticipated $11.36 billion.
2. Robust Net Investment Income.
The company experienced a notable increase in net investment income, driven by higher yields on its fixed-income portfolio and growth in average invested assets. Travelers reported record pre-tax net investment income of $1.098 billion for fiscal Q3 2026, marking a 6% increase year-over-year. This rise in investment income provided a significant tailwind to the company's profitability during the period, supported by a macroeconomic environment of higher interest rates.
Show more
Travelers Companies (TRV) stock has gained about 20% since 6/30/2026 because of the following key factors:
1. Exceptional Fiscal Q2 2026 and Q3 2026 Earnings Outperformance.
Travelers significantly surpassed analyst expectations for both fiscal Q2 and Q3 2026 earnings within the specified period. For fiscal Q2 2026, reported on July 17, 2026, the company posted earnings per share (EPS) of $10.04, substantially beating the consensus estimate of $5.41, with revenue reaching $12.15 billion against an $11.26 billion consensus. This strong momentum continued into fiscal Q3 2026, where Travelers reported core EPS of $9.18, significantly higher than analyst forecasts ranging from $7.07 to $7.39, on revenues of $12.41 billion, exceeding the anticipated $11.36 billion.
2. Robust Net Investment Income.
The company experienced a notable increase in net investment income, driven by higher yields on its fixed-income portfolio and growth in average invested assets. Travelers reported record pre-tax net investment income of $1.098 billion for fiscal Q3 2026, marking a 6% increase year-over-year. This rise in investment income provided a significant tailwind to the company's profitability during the period, supported by a macroeconomic environment of higher interest rates.
3. Strong Underwriting Performance and Favorable Prior Year Reserve Development.
Travelers demonstrated strong underwriting discipline, evidenced by a consolidated combined ratio of 86.8% and a robust underlying combined ratio of 84.1% in fiscal Q3 2026, marking the ninth consecutive quarter with an underlying combined ratio below 86%. This operational excellence was further enhanced by significant net favorable prior year reserve development, which totaled $234 million pre-tax in fiscal Q3 2026, a substantial increase compared to $22 million in the prior-year quarter.
4. Significant Shareholder Returns.
Travelers actively returned capital to shareholders, boosting investor confidence. During fiscal Q3 2026, the company returned $1.8 billion to shareholders, which included $1.508 billion in share repurchases. This reduction in outstanding shares contributes positively to earnings per share and is a key driver for stock appreciation.
Show less
Stock Movement Drivers
Fundamental Drivers
The 20.3% change in TRV stock from 6/30/2026 to 10/20/2026 was primarily driven by a 9.6% change in the company's Net Income Margin (%).| (LTM values as of) | 6302026 | 10202026 | Change |
|---|---|---|---|
| Stock Price ($) | 329.00 | 395.73 | 20.3% |
| Change Contribution By: | |||
| Total Revenues ($ Mil) | 48,942 | 48,921 | 0.0% |
| Net Income Margin (%) | 15.5% | 17.0% | 9.6% |
| P/E Multiple | 9.3 | 9.8 | 5.5% |
| Shares Outstanding (Mil) | 215 | 207 | 4.0% |
| Cumulative Contribution | 20.3% |
Market Drivers
6/30/2026 to 10/20/2026| Return | Correlation | |
|---|---|---|
| TRV | 20.3% | |
| Market (SPY) | 3.0% | -20.9% |
| Sector (XLF) | 3.9% | 32.1% |
Fundamental Drivers
The 36.7% change in TRV stock from 3/31/2026 to 10/20/2026 was primarily driven by a 32.3% change in the company's Net Income Margin (%).| (LTM values as of) | 3312026 | 10202026 | Change |
|---|---|---|---|
| Stock Price ($) | 289.48 | 395.73 | 36.7% |
| Change Contribution By: | |||
| Total Revenues ($ Mil) | 48,828 | 48,921 | 0.2% |
| Net Income Margin (%) | 12.9% | 17.0% | 32.3% |
| P/E Multiple | 10.1 | 9.8 | -3.0% |
| Shares Outstanding (Mil) | 220 | 207 | 6.3% |
| Cumulative Contribution | 36.7% |
Market Drivers
3/31/2026 to 10/20/2026| Return | Correlation | |
|---|---|---|
| TRV | 36.7% | |
| Market (SPY) | 18.6% | -18.5% |
| Sector (XLF) | 13.3% | 36.9% |
Fundamental Drivers
The 43.9% change in TRV stock from 9/30/2025 to 10/20/2026 was primarily driven by a 55.3% change in the company's Net Income Margin (%).| (LTM values as of) | 9302025 | 10202026 | Change |
|---|---|---|---|
| Stock Price ($) | 275.02 | 395.73 | 43.9% |
| Change Contribution By: | |||
| Total Revenues ($ Mil) | 47,843 | 48,921 | 2.3% |
| Net Income Margin (%) | 11.0% | 17.0% | 55.3% |
| P/E Multiple | 11.8 | 9.8 | -17.0% |
| Shares Outstanding (Mil) | 226 | 207 | 9.2% |
| Cumulative Contribution | 43.9% |
Market Drivers
9/30/2025 to 10/20/2026| Return | Correlation | |
|---|---|---|
| TRV | 43.9% | |
| Market (SPY) | 16.4% | -7.6% |
| Sector (XLF) | 4.7% | 37.0% |
Fundamental Drivers
The 155.0% change in TRV stock from 9/30/2023 to 10/20/2026 was primarily driven by a 195.4% change in the company's Net Income Margin (%).| (LTM values as of) | 9302023 | 10202026 | Change |
|---|---|---|---|
| Stock Price ($) | 155.21 | 395.73 | 155.0% |
| Change Contribution By: | |||
| Total Revenues ($ Mil) | 38,753 | 48,921 | 26.2% |
| Net Income Margin (%) | 5.8% | 17.0% | 195.4% |
| P/E Multiple | 16.0 | 9.8 | -38.4% |
| Shares Outstanding (Mil) | 230 | 207 | 11.0% |
| Cumulative Contribution | 155.0% |
Market Drivers
9/30/2023 to 10/20/2026| Return | Correlation | |
|---|---|---|
| TRV | 155.0% | |
| Market (SPY) | 86.1% | 21.9% |
| Sector (XLF) | 75.4% | 50.0% |
Price Returns Compared
| 2021 | 2022 | 2023 | 2024 | 2025 | 2026 | Total [1] | |
|---|---|---|---|---|---|---|---|
| Returns | |||||||
| TRV Return | 14% | 22% | 4% | 29% | 22% | 34% | 207% |
| Peers Return | 29% | 17% | 10% | 33% | 14% | 7% | 171% |
| S&P 500 Return | 27% | -19% | 24% | 23% | 16% | 12% | 104% |
Monthly Win Rates [3] | |||||||
| TRV Win Rate | 58% | 58% | 58% | 75% | 58% | 50% | |
| Peers Win Rate | 52% | 62% | 62% | 65% | 60% | 48% | |
| S&P 500 Win Rate | 75% | 42% | 67% | 75% | 67% | 50% | |
Max Drawdowns [4] | |||||||
| TRV Max Drawdown | -10% | -19% | -17% | -12% | -12% | -10% | |
| Peers Max Drawdown | -15% | -19% | -23% | -11% | -16% | -15% | |
| S&P 500 Max Drawdown | -5% | -25% | -10% | -8% | -19% | -9% | |
[1] Cumulative total returns since the beginning of 2021
[2] Peers: PGR, CB, ALL, HIG, AIG. See TRV Returns vs. Peers.
[3] Win Rate = % of calendar months in which monthly returns were positive
[4] Max drawdown represents maximum peak-to-trough decline within a year
[5] 2026 data is for the year up to 10/20/2026 (YTD)
How Low Can It Go
| Event | TRV | S&P 500 |
|---|---|---|
| 2023 SVB Regional Banking Crisis | ||
| % Loss | -12.2% | -6.7% |
| % Gain to Breakeven | 13.9% | 7.1% |
| Time to Breakeven | 264 days | 31 days |
| 2020 COVID-19 Crash | ||
| % Loss | -38.9% | -33.7% |
| % Gain to Breakeven | 63.6% | 50.9% |
| Time to Breakeven | 236 days | 140 days |
| Q4 2018 Fed Policy Error / Growth Scare | ||
| % Loss | -12.5% | -19.2% |
| % Gain to Breakeven | 14.3% | 23.8% |
| Time to Breakeven | 57 days | 105 days |
| 2011 US Debt Ceiling Crisis & European Contagion | ||
| % Loss | -18.0% | -17.9% |
| % Gain to Breakeven | 22.0% | 21.8% |
| Time to Breakeven | 18 days | 123 days |
| 2008-2009 Global Financial Crisis | ||
| % Loss | -42.7% | -53.4% |
| % Gain to Breakeven | 74.6% | 114.4% |
| Time to Breakeven | 384 days | 1085 days |
| Summer 2007 Credit Crunch | ||
| % Loss | -10.4% | -8.6% |
| % Gain to Breakeven | 11.6% | 9.5% |
| Time to Breakeven | 57 days | 47 days |
In The Past
Travelers Companies's stock fell -3.1% during the 2025 US Tariff Shock. Such a loss loss requires a 3.2% gain to breakeven.
Preserve Wealth
Limiting losses and compounding gains is essential to preserving wealth.
Asset Allocation
Actively managed asset allocation strategies protect wealth. Learn more.
| Event | TRV | S&P 500 |
|---|---|---|
| 2020 COVID-19 Crash | ||
| % Loss | -38.9% | -33.7% |
| % Gain to Breakeven | 63.6% | 50.9% |
| Time to Breakeven | 236 days | 140 days |
| 2008-2009 Global Financial Crisis | ||
| % Loss | -42.7% | -53.4% |
| % Gain to Breakeven | 74.6% | 114.4% |
| Time to Breakeven | 384 days | 1085 days |
In The Past
Travelers Companies's stock fell -3.1% during the 2025 US Tariff Shock. Such a loss loss requires a 3.2% gain to breakeven.
Preserve Wealth
Limiting losses and compounding gains is essential to preserving wealth.
Asset Allocation
Actively managed asset allocation strategies protect wealth. Learn more.
About Travelers Companies (TRV)
The Travelers Companies, Inc. (TRV) is a major insurance provider offering a comprehensive range of commercial and personal property and casualty (P&C) insurance products and services. Operating in the United States and internationally, Travelers helps businesses, government entities, associations, and individuals manage various risks. The company structures its operations into three primary segments: Business Insurance, Bond & Specialty Insurance, and Personal Insurance.
Its Business Insurance segment caters to a diverse clientele, from small to large enterprises, as well as specialized industries like commercial trucking and agriculture. This segment provides a broad spectrum of coverages, including workers' compensation, commercial automobile and property, general liability, professional indemnity, marine, aviation, and even specialized products like kidnap and ransom insurance. The Bond & Specialty Insurance segment focuses on more specialized needs, offering surety, fidelity, and management and professional liability coverages, along with related risk management services.
The Personal Insurance segment addresses the insurance needs of individuals, primarily offering essential property and casualty products like automobile and homeowners insurance. Across all segments, Travelers primarily distributes its products and services through a network of independent agencies and brokers, as well as wholesale agents and program managers for its business clients. Essentially, Travelers plays a crucial role in safeguarding both the operations of diverse businesses and the personal assets of individuals.
AI Analysis | Feedback
Think of them as a combination of State Farm for your personal car and home, and a specialized insurer like Chubb for businesses of all sizes and unique risks.
They're like Geico or Progressive, but they don't just insure individuals; they also cover everything from a small shop's general liability to a multinational corporation's workers' compensation and specialized bonds.
AI Analysis | Feedback
- Commercial Property & Casualty Insurance: A comprehensive suite of policies protecting businesses against risks such as property damage, general liability, workers' compensation, commercial auto, professional indemnity, and specialized coverages.
- Surety & Fidelity Bonds: Guarantees the fulfillment of contractual obligations for businesses (surety) and provides protection against losses caused by employee dishonesty (fidelity).
- Management & Professional Liability Insurance: Provides coverage for corporate directors, officers, and professionals against liabilities arising from their roles and services.
- Personal Automobile Insurance: Offers coverage for individuals' personal vehicles against damage, theft, and liability claims.
- Homeowners Insurance: Protects individuals' residences and personal belongings from damage or loss, and includes personal liability coverage.
AI Analysis | Feedback
Major Customers of The Travelers Companies, Inc. (TRV)
The Travelers Companies, Inc. sells primarily to other companies and organizations through its Business Insurance and Bond & Specialty Insurance segments, though it also serves individuals through its Personal Insurance segment. Due to the diverse nature of its insurance offerings and broad customer base, specific names of major customer companies are not disclosed in the provided information. Instead, Travelers serves various categories of businesses and organizations, which include:
- Small businesses
- Mid-sized businesses
- Large companies
- Government units
- Associations
- Businesses in the commercial trucking industry
- Businesses in agricultural sectors
AI Analysis | Feedback
AI Analysis | Feedback
Alan D. Schnitzer Chairman and Chief Executive Officer
Alan D. Schnitzer became Chairman and Chief Executive Officer of Travelers in 2017 and 2015, respectively. He joined Travelers in 2007 as Vice Chairman and Chief Legal Officer. Prior to that, he was a partner at the law firm of Simpson Thacher & Bartlett LLP, where he advised corporate clients on various transactions and corporate governance matters, and also served as Travelers' lead outside counsel. He previously held key leadership roles at Travelers, including President of the company's Business Insurance and Bond & Specialty Insurance segments, and led the Financial, Professional and International Insurance segment and the Business and International Insurance segment.
Daniel S. Frey Executive Vice President and Chief Financial Officer
Daniel S. Frey is the Executive Vice President and Chief Financial Officer for Travelers. He joined Travelers in 2003 and has served in various financial management capacities, including Senior Vice President and Chief Financial Officer for the Personal Insurance segment and Chief Financial Officer for the Claim and Field Management organizations. Before joining Travelers, Frey was the Chief Financial Officer for Spalding Sports Worldwide, where he contributed to improving the company's performance and successfully managed the simultaneous sale of three product lines to three different buyers. He also held several finance positions at Duracell International, Inc. and started his career in public accounting at Deloitte & Touche.
Avrohom J. Kess Vice Chairman and Chief Legal Officer
Avrohom J. Kess serves as Vice Chairman and Chief Legal Officer of The Travelers Companies, Inc.
Gregory C. Toczydlowski Executive Vice President and President, Business Insurance
Gregory C. Toczydlowski holds the position of Executive Vice President and President, Business Insurance at Travelers.
Michael F. Klein Executive Vice President and President, Personal Insurance
Michael F. Klein is the Executive Vice President and President, Personal Insurance for Travelers.
AI Analysis | Feedback
AI Analysis | Feedback
Clear emerging threats for The Travelers Companies (TRV) include:
- The rise of direct-to-consumer digital insurance platforms (insurtechs) that leverage technology (e.g., AI, advanced data analytics, mobile-first applications) to offer insurance products directly to customers, often providing a more streamlined and personalized experience. This model bypasses the independent agencies and brokers that Travelers heavily relies on for distributing its personal and commercial insurance products, similar to how Netflix disrupted Blockbuster's traditional distribution.
- The increasing adoption of embedded insurance solutions, where insurance products are seamlessly integrated into the purchase or use of other goods and services (e.g., car insurance offered at the point of sale for a new vehicle, or home insurance bundled with smart home systems). This approach captures customers at an earlier stage in their buying journey, potentially before they interact with traditional insurance channels like independent agents and brokers, thereby challenging Travelers' established customer acquisition model.
AI Analysis | Feedback
Addressable Market Sizes for Travelers Companies' Main Products and Services
- Commercial Property & Casualty (P&C) Insurance
- The global P&C insurance market was valued at USD 2.4 trillion in 2024. North America held a 30.2% share of this market in 2023. The U.S. property and casualty insurance market is valued at USD 1.10 trillion in 2025 and is projected to reach USD 1.33 trillion by 2030.
- **U.S. Workers' Compensation Insurance:** The market size of the Workers' Compensation Insurance industry in the United States is $51.2 billion in 2026. Direct premiums written in the U.S. workers' compensation market totaled $57.48 billion in 2024.
- **U.S. Commercial Auto Insurance:** The U.S. commercial auto insurance market was valued at USD 40.45 billion in 2023 and is anticipated to exceed USD 90.41 billion by 2033. U.S. commercial automobile carriers saw direct premiums written increase to $72.18 billion in 2025.
- **Global Commercial Property Insurance:** The global commercial property insurance market size was worth around USD 298 billion in 2023 and is predicted to grow to around USD 621 billion by 2032.
- **Global Marine Insurance:** The global marine insurance market size was valued at USD 35.0 billion in 2024. Another estimate places the global marine insurance premiums at USD 39.92 billion in 2024.
- **Global Aviation Insurance:** The global aviation insurance market size was valued at USD 5.32 billion in 2025 and is predicted to increase to approximately USD 9.66 billion by 2035. North America held a dominant share of the aviation insurance market with 44.90% in 2025.
- Surety & Fidelity Bonds
- **U.S. Surety Bond Market:** The U.S. surety industry writes approximately $7-9 billion in premiums annually in 2026. The U.S. is the largest surety market in the world, accounting for well over half of the estimated $14 billion of bonds that were issued globally in 2021. The global surety market was estimated at USD 19.14 billion in 2024.
- Management and Professional Liability Insurance
- The global professional liability insurance market size is estimated at USD 51.415 billion in 2026 and is expected to rise to USD 69.227 billion by 2035. North America leads this market, with the United States accounting for more than 11 million active policies in 2024.
- Personal Automobile Insurance
- **U.S. Personal Auto Insurance:** Personal motor policies represented USD 359 billion in direct written premiums in 2024. The overall U.S. motor insurance market size is USD 532.45 billion in 2026 and is forecast to reach USD 826.30 billion by 2031. Personal auto insurance premiums were about $318 billion in 2023, representing 35.8% of the entire U.S. property and casualty insurance market.
- Homeowners Insurance
- **U.S. Homeowners Insurance:** The market size of Homeowners' Insurance in the U.S. was $175.1 billion in 2025. It is projected to be USD 184.59 billion in 2026 and reach USD 236.90 billion by 2031. Direct written premiums in the U.S. homeowners insurance market rose to nearly $173.1 billion in 2024.
AI Analysis | Feedback
The Travelers Companies, Inc. (TRV) is expected to drive future revenue growth over the next two to three years through several key strategies:
-
Disciplined Underwriting and Pricing: Travelers is focused on disciplined pricing and favorable renewal rate changes across its commercial and personal insurance lines. This strategy is expected to contribute to premium growth by reflecting adequate pricing for risk and offsetting inflationary pressures.
-
Growth in Net Investment Income: The company anticipates continued robust growth in net investment income, driven by higher interest rates and an expanding investment portfolio. Travelers projects approximately $3.3 billion in after-tax fixed income net investment income for 2026.
-
Expansion in Specialty Lines, Notably Cyber Insurance: Travelers aims for sustained double-digit premium growth in its cyber insurance offerings through 2025-2026, including benefits from integrations like Corvus, which expands its cyber footprint and risk-scoring capabilities. This is part of a broader strategy of specialty expansion.
-
Targeted Growth Initiatives within Business Insurance: The Business Insurance segment is expected to outgrow the market through initiatives such as enhanced quote/bind and agent portal rollouts across most U.S. states in 2024-2025. These efforts are designed to increase market share in specific areas like construction, Excess & Surplus (E&S), and management liability, contributing to broader small-commercial conversion gains.
AI Analysis | Feedback
Share Repurchases
- In January 2026, the Board of Directors authorized an additional $5.0 billion for share repurchases, supplementing the $2.015 billion remaining from prior authorizations as of December 31, 2025.
- During the fourth quarter of 2025, Travelers repurchased 5.8 million shares at an average price of $285.04 per share, totaling $1.653 billion.
- The company expects to repurchase approximately $1.8 billion in shares during the first quarter of 2026.
Outbound Investments
- On May 27, 2025, Travelers agreed to divest its Canadian personal insurance and the majority of its Canadian commercial insurance operations to Definity Financial Corporation for approximately US$2.4 billion.
- The sale of the Canadian operations was completed on January 2, 2026, with Travelers retaining its Canadian surety business.
Capital Expenditures
- Travelers made a $1.5 billion technology investment and established a partnership with Anthropic to enhance AI capabilities in underwriting and claims.
- This investment supports efficiency gains in claims processing, with over half of all claims now eligible for straight-through processing and 15% more claims handled with advanced digital tools.

Peer Outperformance in Property & Casualty Insurance
| Industry | Names | 1Y med | 3Y med | 5Y med | Top 3 by 5Y |
|---|---|---|---|---|---|
| Reinsurance | 6 | 29.0% | 73.5% | 119.6% | SPNT 175% · RNR 149% · RGA 146% |
| Diversified Banks | 12 | 28.1% | 143.6% | 87.2% | CM 137% · JPM 122% · RY 122% |
| Life & Health Insurance | 20 | 12.4% | 61.6% | 81.1% | JXN 472% · UNM 280% · MFC 177% |
| Investment Banking & Brokerage | 13 | -12.0% | 102.4% | 68.8% | IBKR 354% · SNEX 177% · GS 145% |
| Property & Casualty Insurance ← | 42 | 14.2% | 80.2% | 66.6% | TRV 174% · PGR 162% · ACGL 150% |
| Multi-line Insurance | 9 | 8.3% | 66.9% | 59.7% | GNW 99% · L 95% · AIZ 87% |
| Multi-Sector Holdings | 3 | 6.4% | 55.8% | 52.3% | BRK-B 88% · VOYA 52% · JEF 31% |
| Regional Banks | 264 | 29.4% | 97.9% | 49.9% | CBC 230% · FCNCA 153% · OFG 144% |
| Financial Exchanges & Data | 15 | 8.1% | 35.0% | 30.1% | CBOE 165% · VIRT 158% · CME 70% |
| Consumer Finance | 30 | 2.5% | 86.6% | 21.1% | ENVA 397% · EZPW 320% · FCFS 154% |
| Insurance Brokers | 15 | -6.1% | 7.9% | 18.3% | LIFE 375% · ARX 88% · AJG 68% |
| Diversified Financial Services | 4 | -2.6% | 23.6% | 6.4% | FRHC 161% · EQH 81% |
| Asset Management & Custody Banks | 84 | -13.0% | 22.7% | 3.3% | WT 293% · AAMI 257% · VCTR 245% |
| Commercial & Residential Mortgage Finance | 15 | -53.5% | 34.8% | -4.5% | FNMA 333% · FMCC 289% · ACT 154% |
| Specialized Finance | 3 | 8.8% | 36.6% | -13.5% | CACC -13% · HASI -23% |
| Mortgage REITs | 34 | -21.0% | -3.0% | -34.3% | RITM 26% · DX 17% · AGNC 7% |
| Transaction & Payment Processing Services | 17 | 2.1% | 8.2% | -35.9% | V 82% · MA 79% · CPAY 49% |
| Diversified Capital Markets | 20 | -48.9% | 12.8% | -62.8% | LPLA 89% · TW 45% · RIOT -56% |
Latest Trefis Analyses
Research & Analysis
Invest in Strategies
Wealth Management
Peer Comparisons
| Peers to compare with: |
Financials
| Median | |
|---|---|
| Name | |
| Mkt Price | 235.96 |
| Mkt Cap | 72.8 |
| Rev LTM | 55,599 |
| Op Inc LTM | - |
| FCF LTM | 11,463 |
| FCF 3Y Avg | 9,470 |
| CFO LTM | 11,573 |
| CFO 3Y Avg | 9,578 |
Growth & Margins
| Median | |
|---|---|
| Name | |
| Rev Chg LTM | 5.9% |
| Rev Chg 3Y Avg | 9.6% |
| Rev Chg Q | 6.9% |
| QoQ Delta Rev Chg LTM | 1.7% |
| Op Inc Chg LTM | - |
| Op Inc Chg 3Y Avg | - |
| Op Mgn LTM | - |
| Op Mgn 3Y Avg | - |
| QoQ Delta Op Mgn LTM | - |
| CFO/Rev LTM | 19.3% |
| CFO/Rev 3Y Avg | 20.1% |
| FCF/Rev LTM | 18.9% |
| FCF/Rev 3Y Avg | 19.9% |
Valuation
| Median | |
|---|---|
| Name | |
| Mkt Cap | 72.8 |
| P/S | 1.5 |
| P/Op Inc | - |
| P/EBIT | 8.1 |
| P/E | 10.4 |
| P/CFO | 7.8 |
| Total Yield | 12.4% |
| Dividend Yield | 1.7% |
| FCF Yield 3Y Avg | 14.2% |
| D/E | 0.1 |
| Net D/E | -0.3 |
Segment Financials
Revenue by Segment| $ Mil | 2025 | 2024 | 2023 | 2022 | 2021 |
|---|---|---|---|---|---|
| Business Insurance | 26,018 | 24,657 | 21,861 | 19,589 | 18,609 |
| Personal Insurance | 18,279 | 17,418 | 15,600 | 13,803 | 12,628 |
| Bond & Specialty Insurance | 4,579 | 4,378 | 4,008 | 3,696 | 3,408 |
| Net realized investment gains (losses) | -48 | -30 | -105 | -204 | 171 |
| Total | 48,828 | 46,423 | 41,364 | 36,884 | 34,816 |
| $ Mil | 2008 | 2007 | 2005 | 2003 | 2000 |
|---|---|---|---|---|---|
| Business Insurance | 2,338 | 3,015 | |||
| Financial, Professional & International Insurance | 649 | 675 | |||
| Personal Insurance | 465 | 1,019 | |||
| Commercial | 756 | ||||
| Personal | 775 | ||||
| Specialty | 679 | ||||
| Asset Management | 187 | ||||
| Commercial Lines | 235 | ||||
| Property-Liability Insurance | 889 | ||||
| Specialty Commercial | 288 | ||||
| Commercial Lines Group | 99 | ||||
| Global Healthcare | -244 | ||||
| Global Surety | 51 | ||||
| International | -100 | ||||
| Life Insurance | 53 | ||||
| Other Global Specialty | -9 | ||||
| Property-Liability Investment Operations | 1,467 | ||||
| Reinsurance | -106 | ||||
| Total | 3,452 | 4,709 | 2,210 | 1,599 | 1,211 |
| $ Mil | 2015 | 2014 | 2013 | 2010 | 2009 |
|---|---|---|---|---|---|
| Business and International Insurance | 1,824 | 2,156 | |||
| Personal Insurance | 332 | 379 | 369 | 464 | 422 |
| Bond & Specialty Insurance | 223 | 252 | |||
| Business Insurance | 1,975 | 2,156 | 1,902 | ||
| Financial, Professional & International Insurance | 372 | 439 | 452 | ||
| Total | 2,379 | 2,787 | 2,716 | 3,059 | 2,776 |
| $ Mil | 2025 | 2024 | 2023 | 2022 | 2021 |
|---|---|---|---|---|---|
| Business Insurance | 106,084 | 98,311 | 93,565 | 86,522 | 90,353 |
| Personal Insurance | 22,787 | 21,138 | 20,072 | 18,275 | 18,983 |
| Bond & Specialty Insurance | 13,676 | 12,628 | 11,478 | 10,119 | 10,146 |
| Other assets | 1,161 | 1,112 | 863 | 801 | 984 |
| Total | 143,708 | 133,189 | 125,978 | 115,717 | 120,466 |
Price Behavior
| Market Price | $395.73 | |
| Market Cap ($ Bil) | 81.9 | |
| First Trading Date | 07/09/1986 | |
| Distance from 52W High | -0.0% | |
| 50 Days | 200 Days | |
| DMA Price | $369.19 | $323.32 |
| DMA Trend | up | up |
| Distance from DMA | 7.2% | 22.4% |
| 3M | 1YR | |
| Volatility | 20.4% | 20.6% |
| Downside Capture | -11.53 | -46.94 |
| Upside Capture | 17.48 | 9.89 |
| Correlation (S&P 500) | -8.0% | -10.1% |
| 1M | 2M | 3M | 6M | 1Y | 3Y | |
|---|---|---|---|---|---|---|
| Beta | 0.51 | 0.20 | -0.46 | -0.31 | -0.10 | 0.33 |
| Up Beta | -0.98 | 0.59 | -0.48 | 0.30 | 0.28 | 0.48 |
| Down Beta | -1.68 | -1.25 | -1.28 | -1.24 | -0.32 | 0.33 |
| Up Capture | 77% | 7% | -7% | 1% | 2% | 12% |
| Bmk +ve Days | 6 | 16 | 27 | 66 | 132 | 424 |
| Stock +ve Days | 12 | 21 | 34 | 68 | 136 | 411 |
| Down Capture | 118% | 57% | -67% | -86% | -55% | 20% |
| Bmk -ve Days | 16 | 26 | 37 | 60 | 120 | 328 |
| Stock -ve Days | 10 | 21 | 30 | 58 | 116 | 339 |
[1] Upside and downside betas calculated using positive and negative benchmark daily returns respectively
Based On 1-Year Data
| Annualized Return | Annualized Volatility | Sharpe Ratio | Correlation with TRV | |
|---|---|---|---|---|
| TRV | 53.6% | 20.6% | 1.97 | - |
| Sector ETF (XLF) | 8.1% | 14.5% | 0.31 | 34.1% |
| Equity (SPY) | 16.8% | 12.7% | 0.93 | -10.4% |
| Gold (GLD) | -2.9% | 29.3% | -0.10 | -4.5% |
| Commodities (DBC) | 52.5% | 20.7% | 1.93 | -12.5% |
| Real Estate (VNQ) | 5.1% | 13.8% | 0.11 | 37.6% |
| Bitcoin (BTCUSD) | -23.7% | 43.6% | -0.50 | -11.6% |
Smart multi-asset allocation framework can stack odds in your favor. Learn How
Based On 5-Year Data
| Annualized Return | Annualized Volatility | Sharpe Ratio | Correlation with TRV | |
|---|---|---|---|---|
| TRV | 22.7% | 22.3% | 0.86 | - |
| Sector ETF (XLF) | 9.5% | 18.3% | 0.38 | 54.8% |
| Equity (SPY) | 13.6% | 17.1% | 0.61 | 31.2% |
| Gold (GLD) | 18.1% | 18.9% | 0.77 | 0.9% |
| Commodities (DBC) | 9.7% | 19.5% | 0.38 | 7.1% |
| Real Estate (VNQ) | 1.4% | 18.9% | -0.03 | 35.2% |
| Bitcoin (BTCUSD) | 7.7% | 51.7% | 0.33 | 4.9% |
Smart multi-asset allocation framework can stack odds in your favor. Learn How
Based On 10-Year Data
| Annualized Return | Annualized Volatility | Sharpe Ratio | Correlation with TRV | |
|---|---|---|---|---|
| TRV | 15.6% | 24.7% | 0.59 | - |
| Sector ETF (XLF) | 13.0% | 22.1% | 0.53 | 67.0% |
| Equity (SPY) | 15.3% | 17.9% | 0.72 | 51.3% |
| Gold (GLD) | 12.1% | 16.4% | 0.60 | 1.6% |
| Commodities (DBC) | 8.2% | 18.1% | 0.37 | 17.9% |
| Real Estate (VNQ) | 5.2% | 20.7% | 0.21 | 53.4% |
| Bitcoin (BTCUSD) | 62.9% | 66.2% | 1.03 | 8.6% |
Smart multi-asset allocation framework can stack odds in your favor. Learn How
Returns Analyses
Earnings Returns History
Updated 10/21/2026| Forward Returns | |||
|---|---|---|---|
| Earnings Date | 1D Returns | 5D Returns | 21D Returns |
| 10/16/2026 | 1.5% | ||
| 7/17/2026 | 9.2% | 11.4% | 9.6% |
| 4/16/2026 | -0.2% | 0.8% | -0.3% |
| 1/21/2026 | 1.1% | 4.3% | 11.2% |
| 10/16/2025 | -2.9% | -0.4% | 6.7% |
| 7/17/2025 | 3.8% | 5.0% | 6.5% |
| 4/16/2025 | 1.1% | 3.8% | 8.5% |
| 1/22/2025 | 3.2% | 3.9% | 0.9% |
| ... | |||
| SUMMARY STATS | |||
| # Positive | 17 | 17 | 18 |
| # Negative | 8 | 7 | 6 |
| Median Positive | 3.2% | 4.3% | 6.5% |
| Median Negative | -1.9% | -3.9% | -2.9% |
| Max Positive | 9.2% | 11.4% | 20.7% |
| Max Negative | -7.8% | -6.8% | -4.2% |
| Forward Returns | |||
|---|---|---|---|
| Earnings Date | 1D Returns | 5D Returns | 21D Returns |
| 10/16/2026 | 1.5% | ||
| 7/17/2026 | 9.2% | 11.4% | 9.6% |
| 4/16/2026 | -0.2% | 0.8% | -0.3% |
| 1/21/2026 | 1.1% | 4.3% | 11.2% |
| 10/16/2025 | -2.9% | -0.4% | 6.7% |
| 7/17/2025 | 3.8% | 5.0% | 6.5% |
| 4/16/2025 | 1.1% | 3.8% | 8.5% |
| 1/22/2025 | 3.2% | 3.9% | 0.9% |
| 10/17/2024 | 9.0% | 5.9% | 5.6% |
| 7/19/2024 | -7.8% | -5.2% | -1.8% |
| 4/17/2024 | -7.4% | -3.9% | -3.9% |
| 1/19/2024 | 6.7% | 6.6% | 9.7% |
| 10/18/2023 | -0.7% | -6.8% | 0.1% |
| 7/20/2023 | 1.8% | 2.1% | -4.2% |
| 4/19/2023 | 6.1% | 3.1% | 5.6% |
| 1/24/2023 | 3.7% | 0.8% | -0.1% |
| 10/19/2022 | 4.4% | 5.6% | 8.6% |
| 7/21/2022 | -0.9% | 0.5% | 10.1% |
| 4/19/2022 | -4.9% | -5.8% | -4.2% |
| 1/20/2022 | 3.2% | 4.9% | 6.6% |
| 10/19/2021 | 1.6% | 5.7% | 4.0% |
| 7/20/2021 | -0.1% | -1.6% | 5.1% |
| 4/20/2021 | 0.9% | 0.9% | 1.9% |
| 1/21/2021 | 2.6% | -3.8% | 0.6% |
| 10/20/2020 | 5.6% | 8.7% | 20.7% |
| SUMMARY STATS | |||
| # Positive | 17 | 17 | 18 |
| # Negative | 8 | 7 | 6 |
| Median Positive | 3.2% | 4.3% | 6.5% |
| Median Negative | -1.9% | -3.9% | -2.9% |
| Max Positive | 9.2% | 11.4% | 20.7% |
| Max Negative | -7.8% | -6.8% | -4.2% |
SEC Filings
Expand for More| Report Date | Filing Date | Filing |
|---|---|---|
| 06/30/2026 | 07/17/2026 | 10-Q |
| 03/31/2026 | 04/16/2026 | 10-Q |
| 12/31/2025 | 02/12/2026 | 10-K |
| 09/30/2025 | 10/16/2025 | 10-Q |
| 06/30/2025 | 07/17/2025 | 10-Q |
| 03/31/2025 | 04/16/2025 | 10-Q |
| 12/31/2024 | 02/13/2025 | 10-K |
| 09/30/2024 | 10/17/2024 | 10-Q |
| 06/30/2024 | 07/19/2024 | 10-Q |
| 03/31/2024 | 04/17/2024 | 10-Q |
| 12/31/2023 | 02/15/2024 | 10-K |
| 09/30/2023 | 10/18/2023 | 10-Q |
| 06/30/2023 | 07/20/2023 | 10-Q |
| 03/31/2023 | 04/19/2023 | 10-Q |
| 12/31/2022 | 02/16/2023 | 10-K |
| 09/30/2022 | 10/19/2022 | 10-Q |
| Report Date | Filing Date | Filing |
|---|---|---|
| 06/30/2026 | 07/17/2026 | 10-Q |
| 03/31/2026 | 04/16/2026 | 10-Q |
| 12/31/2025 | 02/12/2026 | 10-K |
| 09/30/2025 | 10/16/2025 | 10-Q |
| 06/30/2025 | 07/17/2025 | 10-Q |
| 03/31/2025 | 04/16/2025 | 10-Q |
| 12/31/2024 | 02/13/2025 | 10-K |
| 09/30/2024 | 10/17/2024 | 10-Q |
| 06/30/2024 | 07/19/2024 | 10-Q |
| 03/31/2024 | 04/17/2024 | 10-Q |
| 12/31/2023 | 02/15/2024 | 10-K |
| 09/30/2023 | 10/18/2023 | 10-Q |
| 06/30/2023 | 07/20/2023 | 10-Q |
| 03/31/2023 | 04/19/2023 | 10-Q |
| 12/31/2022 | 02/16/2023 | 10-K |
| 09/30/2022 | 10/19/2022 | 10-Q |
| 06/30/2022 | 07/21/2022 | 10-Q |
| 03/31/2022 | 04/19/2022 | 10-Q |
| 12/31/2021 | 02/17/2022 | 10-K |
| 09/30/2021 | 10/19/2021 | 10-Q |
| 06/30/2021 | 07/20/2021 | 10-Q |
| 03/31/2021 | 04/20/2021 | 10-Q |
| 12/31/2020 | 02/11/2021 | 10-K |
| 09/30/2020 | 10/20/2020 | 10-Q |
| 06/30/2020 | 07/23/2020 | 10-Q |
| 03/31/2020 | 04/21/2020 | 10-Q |
| 12/31/2019 | 02/13/2020 | 10-K |
| 09/30/2019 | 10/22/2019 | 10-Q |
Recent Forward Guidance
Updated 10/17/2026Latest: Q3 2026 Earnings Reported 10/16/2026
| Forward Guidance | Guidance Change | |||||||
|---|---|---|---|---|---|---|---|---|
| Metric | Source | Low | Mid | High | % Chg | % Delta | Change | Prior |
| Q4 2026 Dividends per Share | Reported | 1.25 | ||||||
Prior: Q2 2026 Earnings Reported 7/17/2026
| Forward Guidance | Guidance Change | |||||||
|---|---|---|---|---|---|---|---|---|
| Metric | Source | Low | Mid | High | % Chg | % Delta | Change | Prior |
| 2026 Expense Ratio | Reported | 0.29 | 0.0% | Affirmed | Guidance: 0.29 for 2026 | |||
Q1 2026 Earnings Reported 4/16/2026
| Forward Guidance | Guidance Change | |||||||
|---|---|---|---|---|---|---|---|---|
| Metric | Source | Low | Mid | High | % Chg | % Delta | Change | Prior |
| 2026 Expense Ratio | Reported | 0.29 | ||||||
Q4 2025 Earnings Reported 1/21/2026
| Forward Guidance | Guidance Change | |||||||
|---|---|---|---|---|---|---|---|---|
| Metric | Source | Low | Mid | High | % Chg | % Delta | Change | Prior |
| 2026 Share Repurchases | Reported | 7.01 Bil | ||||||
Insider Activity
Updated 10/1/2026| # | Owner | Title | Holding | Action | Filing Date | Price | Shares | Transacted Value | Value of Held Shares | Form |
|---|---|---|---|---|---|---|---|---|---|---|
| 1 | Olivo, Maria | EVP, ERM & Chief Risk Officer | Direct | Sell | 8312026 | 369.86 | 6,000 | 2,219,145 | 43,917,788 | Form |
| 2 | Yin, Daniel Tei-Hwa | EVP & Co-Chief Invest. Officer | Direct | Sell | 7272026 | 387.00 | 7,153 | 2,768,211 | 26,638,778 | Form |
| 3 | Kurtzman, Diane | EVP & Chief HR Officer | Direct | Sell | 7272026 | 386.71 | 4,164 | 1,610,260 | 2,048,870 | Form |
| 4 | Klein, Michael Frederick | EVP & President, Personal Ins. | Direct | Sell | 7232026 | 366.09 | 6,000 | 2,196,561 | 16,519,895 | Form |
| 5 | Frey, Daniel S | EVP & Chief Financial Officer | Direct | Sell | 7232026 | 368.24 | 14,037 | 5,169,002 | 10,139,503 | Form |
| # | Owner | Title | Holding | Action | Filing Date | Price | Shares | Transacted Value | Value of Held Shares | Form |
|---|---|---|---|---|---|---|---|---|---|---|
| 1 | Olivo, Maria | EVP, ERM & Chief Risk Officer | Direct | Sell | 8312026 | 369.86 | 6,000 | 2,219,145 | 43,917,788 | Form |
| 2 | Yin, Daniel Tei-Hwa | EVP & Co-Chief Invest. Officer | Direct | Sell | 7272026 | 387.00 | 7,153 | 2,768,211 | 26,638,778 | Form |
| 3 | Kurtzman, Diane | EVP & Chief HR Officer | Direct | Sell | 7272026 | 386.71 | 4,164 | 1,610,260 | 2,048,870 | Form |
| 4 | Klein, Michael Frederick | EVP & President, Personal Ins. | Direct | Sell | 7232026 | 366.09 | 6,000 | 2,196,561 | 16,519,895 | Form |
| 5 | Frey, Daniel S | EVP & Chief Financial Officer | Direct | Sell | 7232026 | 368.24 | 14,037 | 5,169,002 | 10,139,503 | Form |
| 6 | Lefebvre, Mojgan M | EVP & Chief Tech & Ops Officer | Direct | Sell | 7232026 | 368.38 | 16,313 | Form | ||
| 7 | Klein, Michael Frederick | EVP & President, Personal Ins. | Direct | Sell | 5272026 | 307.65 | 10,000 | 3,076,546 | 13,882,848 | Form |
| 8 | Bessette, Andy F | EVP and Chief Admin Officer | Direct | Sell | 5262026 | 308.11 | 4,255 | 1,311,008 | 7,482,266 | Form |
| 9 | Kess, Avrohom J | Vice Chmn. & Chief Legal Off. | Direct | Sell | 4292026 | 308.78 | 6,735 | 2,079,640 | 15,049,190 | Form |
| 10 | Heyman, William H | Vice Chairman | Direct | Sell | 4292026 | 310.64 | 1,557 | 483,670 | 80,639,624 | Form |
| 11 | Kurtzman, Diane | EVP & Chief HR Officer | Direct | Sell | 4212026 | 303.45 | 2,867 | 869,980 | 1,607,721 | Form |
| 12 | Klein, Michael Frederick | EVP & President, Personal Ins. | Direct | Sell | 4212026 | 303.77 | 10,000 | 3,037,691 | 13,707,515 | Form |
| 13 | Klenk, Jeffrey P | EVP & Pres., Bond & Spec. Ins. | Direct | Sell | 4212026 | 305.06 | 6,414 | 1,956,549 | 1,853,332 | Form |
| 14 | Rowland, David Donnay | EVP & Co-Chief Invest. Officer | Direct | Sell | 2272026 | 308.52 | 4,731 | 1,459,604 | 3,232,857 | Form |
| 15 | Olivo, Maria | EVP, ERM & Chief Risk Officer | Direct | Sell | 2272026 | 306.60 | 10,400 | 3,188,588 | 38,245,414 | Form |
| 16 | Munson, Paul E | SVP & Corp. Controller | Direct | Sell | 2262026 | 306.04 | 3,727 | 1,140,611 | 225,043 | Form |
| 17 | Heyman, William H | Vice Chairman | Direct | Sell | 2242026 | 307.44 | 4,000 | 1,229,755 | 79,808,032 | Form |
| 18 | Heyman, William H | Vice Chairman | Direct | Sell | 2242026 | 304.00 | 1,000 | 304,000 | 78,915,360 | Form |
| 19 | Toczydlowski, Gregory C | EVP & President, Business Ins. | Direct | Sell | 2232026 | 299.76 | 12,200 | 3,656,984 | 5,520,444 | Form |
| 20 | Frey, Daniel S | EVP & Chief Financial Officer | Direct | Sell | 2232026 | 299.50 | 8,000 | 2,395,960 | 8,246,579 | Form |
| 21 | Kess, Avrohom J | Vice Chmn & Chief Legal Off | Direct | Sell | 2232026 | 300.44 | 4,756 | 1,428,901 | 15,281,193 | Form |
| 22 | Heyman, William H | Vice Chairman | Direct | Sell | 2192026 | 300.00 | 1,000 | 300,000 | 76,525,660 | Form |
| 23 | Bessette, Andy F | EVP and Chief Admin Officer | Direct | Sell | 2192026 | 297.65 | 6,000 | 1,785,925 | 5,915,751 | Form |
| 24 | Olivo, Maria | EVP, ERM & Chief Risk Officer | Direct | Sell | 2092026 | 300.75 | 10,400 | 3,127,832 | 35,367,406 | Form |
| 25 | Klein, Michael Frederick | EVP & President, Personal Ins. | Direct | Sell | 2092026 | 301.18 | 10,000 | 3,011,783 | 10,131,045 | Form |
| 26 | Heyman, William H | Vice Chairman | Direct | Sell | 2092026 | 303.00 | 1,000 | 303,000 | 77,290,917 | Form |
| 27 | Heyman, William H | Vice Chairman | Direct | Sell | 2092026 | 302.00 | 5,000 | 1,510,000 | 77,035,831 | Form |
| 28 | Schnitzer, Alan D | Chairman and CEO | Direct | Sell | 2052026 | 294.70 | 55,733 | 16,424,517 | 76,719,082 | Form |
| 29 | Klenk, Jeffrey P | EVP & Pres., Bond & Spec. Ins. | Direct | Sell | 1262026 | 279.77 | 16,712 | 4,675,593 | 1,699,715 | Form |
| 30 | Olivo, Maria | EVP, Strat Dev & Pres Intl | Direct | Sell | 12012025 | 295.73 | 8,920 | 2,637,912 | 34,776,709 | Form |
| 31 | Heyman, William H | Vice Chairman | Direct | Sell | 11262025 | 294.50 | 4,000 | 1,178,010 | 75,123,327 | Form |
| 32 | Kurtzman, Diane | EVP & Chief HR Officer | Direct | Sell | 11252025 | 290.00 | 4,805 | 1,393,450 | 1,107,379 | Form |
| 33 | Rowland, David Donnay | EVP & Co-Chief Invest. Officer | Direct | Sell | 11242025 | 290.57 | 5,000 | 1,452,849 | 5,103,099 | Form |
| 34 | Heyman, William H | Vice Chairman | Direct | Sell | 11242025 | 291.50 | 2,000 | 583,000 | 74,357,433 | Form |
| 35 | Heyman, William H | Vice Chairman | Direct | Sell | 11142025 | 289.55 | 1,803 | 522,067 | 73,861,198 | Form |
| 36 | Heyman, William H | Vice Chairman | Direct | Sell | 11142025 | 287.50 | 2,000 | 575,000 | 73,337,091 | Form |
| 37 | Heyman, William H | Vice Chairman | Direct | Sell | 11122025 | 284.69 | 4,000 | 1,138,780 | 72,621,576 | Form |
| 38 | Heyman, William H | Vice Chairman | Direct | Sell | 11122025 | 281.50 | 2,000 | 563,000 | 71,806,578 | Form |
| 39 | Heyman, William H | Vice Chairman | Direct | Sell | 11122025 | 280.00 | 1,000 | 280,000 | 71,423,950 | Form |
| 40 | Frey, Daniel S | EVP & Chief Financial Officer | Direct | Sell | 11072025 | 278.25 | 25,000 | 6,956,255 | 7,493,784 | Form |
| 41 | Klein, Michael Frederick | EVP & President, Personal Ins. | Direct | Sell | 10292025 | 270.73 | 8,572 | 2,320,728 | 9,106,944 | Form |
Investor Activity (13F)
Updated Oct 21, 2026Active managers (13F portfolio over $250M, at least 3 holdings) with a position over $5M that is either over 10% of their portfolio or held in a concentrated book of 50 or fewer total positions. Index/ETF, sovereign, bank, community-bank and charitable/donor-advised filers are excluded.
| Active Manager | Value | % of Portfolio | Total Positions | QoQ | Filing |
|---|---|---|---|---|---|
| RIT Capital Partners PLC | $29.2 Mil | 7.8% | 12 | TRIM -26.3% | 13F |
| St. James Investment Company, LLC | $19.8 Mil | 3.1% | 22 | TRIM -23.9% | 13F |
| Generali Powszechne Towarzystwo Emerytalne | $5.9 Mil | 1.0% | 28 | Hold | 13F |
| Semper Augustus Investments Group LLC | $5.6 Mil | 0.7% | 44 | Hold | 13F |
| National Mutual Insurance Federation of Agricultural Cooperatives | $14.6 Mil | 0.1% | 41 | Hold | 13F |
| Active Manager |
|---|
| Active Manager | Value | % of Portfolio | Total Positions | QoQ | Filing |
|---|---|---|---|---|---|
| RIT Capital Partners PLC | $29.2 Mil | 7.8% | 12 | TRIM -26.3% | 13F |
| St. James Investment Company, LLC | $19.8 Mil | 3.1% | 22 | TRIM -23.9% | 13F |
| National Mutual Insurance Federation of Agricultural Cooperatives | $14.6 Mil | 0.1% | 41 | Hold | 13F |
| Generali Powszechne Towarzystwo Emerytalne | $5.9 Mil | 1.0% | 28 | Hold | 13F |
| Semper Augustus Investments Group LLC | $5.6 Mil | 0.7% | 44 | Hold | 13F |
TRV Trade Sentinel
Avoid
CONVICTION RATIONALE
Travelers demonstrates elite capital allocation, repurchasing 12% of shares since early 2025. However, this is overshadowed by a broken growth outlook, with revenue declining -0.5% while peers expand rapidly. With profitability potentially at a cyclical peak, the risk of margin compression combined with market share loss makes the current valuation unattractive.
STOCK ARCHETYPE
Recurring Transactional(Number of Policies in Force) x (Average Premium per Policy) Underwriting Margin (as measured by the Combined Ratio) and Net Investment Income.
INVESTMENT THESIS
Yes. Elite execution is generating record profits and a 12.7% total shareholder yield, even as the top line stagnates.
- Underlying combined ratio was a strong 84.1% in Q3 2026.
- Share repurchases have retired 12% of outstanding shares since early 2025.
- Total shareholder yield from buybacks and dividends is 12.7%.
- Business Insurance retention remains high at 86% despite price increases.
PRIMARY RISK
Record earnings are propped up by potentially unsustainable reserve releases as the top line shrinks (-0.5% in Q3) while peers like Progressive are growing. This signals a cyclical peak and structural market share erosion.
- Latest-quarter revenue declined -0.5% year-over-year.
- Trailing revenue growth of 1.1% lags that of peer Progressive.
- Q3 results were aided by $234 million in favorable reserve development.
- Personal Insurance active policies declined to 8.1 million from 8.5 million.
| KPI | Status | Rationale |
|---|---|---|
| Business Insurance Net Written Premiums (NWP) Growth | 4% year-over-year growth in Q3 2026 (ex-Canada) - Stable | Growth in the core Business Insurance segment, adjusted for the sale of the Canadian business, has been stable in the mid-single digits, showing a slight deceleration in the most recent quarter after a stronger Q2. Management noted growth in every line other than property. |
| Underlying Combined Ratio | 84.1% in Q3 2026 - Stable | The underlying combined ratio, which measures core underwriting profitability by excluding catastrophes and prior-year reserve development, has remained stable and strong. The Q3 2026 result of 84.1% was flat with Q2 and an improvement from 85.3% in Q1, marking the ninth consecutive quarter below 86%. This demonstrates consistent and disciplined underwriting performance. |
| Renewal Premium Change (RPC) | 4.1% (Q3 2026) | Measures the average change in premium on renewed policies, including both rate and exposure changes. It is a key indicator of the company's pricing power in the current market. |
| Retention Rate | 86% (Q3 2026 (Business Insurance)) | The percentage of policies or premiums renewed from the prior period. High retention indicates customer satisfaction, market stability, and a strong competitive position. |
| New Business Volume | $699 million (Q3 2026 (Business Insurance)) | The amount of written premiums from new policyholders. It is a primary indicator of market share gains and top-line growth momentum. |
Capital Return Engine vs. Shrinking Market Footprint
BULL VIEW
Elite management is maximizing shareholder value in a mature market by prioritizing underwriting profit and aggressive buybacks, which have retired 12% of shares since early 2025. This is a durable compounding machine.
CORE TENSION
Can a 12.7% shareholder yield offset a -0.5% revenue decline, which the market met with a flat post-earnings reaction?
PREVAILING SENTIMENT
The bears. The latest quarter's negative revenue growth is a stark confirmation of market share loss, making the reliance on potentially peak margins and buybacks a fragile strategy.
BEAR VIEW
The company is ceding the market to faster rivals, with revenue declining -0.5% in Q3. Financial engineering through buybacks cannot indefinitely mask a shrinking business, especially if peak margins begin to revert.
| Timeline | Event & Metric To Watch |
|---|---|
Q4 | Q4 Investment Income Guidance Watch: Company expects Q4 2026 fixed income net investment income of approximately $875 million after-tax. |
Q4 2026 | Q4 Dividend Guidance Watch: Company guidance for Q4 2026 dividends per share has a new midpoint of $1.25. |
1/19/2027 | Slowing Premium Growth Watch: Net written premium growth figures in the Q4 earnings report, particularly for the Business Insurance segment. |
1/19/2027 | Reserve Release Normalization Watch: The magnitude of 'net favorable prior year reserve development' in the Q4 earnings release and management commentary. |
1/27/2027 | Peer HIG Earnings Report Watch: Peer Hartford Financial Services (HIG) is scheduled to report earnings. |
2/1/2027 | Peer CB Earnings Report Watch: Peer Chubb (CB) is scheduled to report earnings. |
No set date | Winter Storm Catastrophe Losses Watch: Company pre-announcements of catastrophe losses or industry-level loss estimates for major winter weather events. |
| Date | Event | Stock Impact |
|---|---|---|
2026-10-16 | Reported Strong Q3 Results Details: The company reported Q3 core income of $1.95 billion, or $9.18 per diluted share, with a combined ratio of 86.8%. | +0.4% $383.89 -> $385.45 |
2026-07-24 | Issued New Senior Notes Details: AM Best assigned a rating to $750 million 4.95% senior unsecured notes, due July 2031. The CFO confirmed the issuance in the Q3 call. | +3.7% $375.09 -> $389.02 |
2026-07-17 | Positive Post-Earnings Stock Reaction Details: Around the earnings call dated 2026-07-17, the two-day stock reaction was 9.0%, while the S&P 500 declined. | +9.1% $336.67 -> $367.24 |
2026-06-30 | Advanced AI Strategy Details: The company announced it has developed TravelersLLM, a proprietary large language model tailored to its property casualty business. | +0.8% $330.75 -> $333.48 |
2026-05-01 | Launched AI Claims Tool Details: Travelers launched Claim Insights, a new AI-powered capability for customers within its proprietary risk management information platform, e-CARMA®. | -1.2% $302.83 -> $299.25 |
2026-04-16 | Reported Excellent First Quarter Details: The company reported Q1 net income of $1.711 billion, or $7.71 per diluted share, and core income of $1.696 billion, or $7.71 per diluted share. | +0.5% $297.07 -> $298.54 |
Position Sizing
5% - 7%
NORMAL POSITION
Sizing is volatility-based: TRV trades at roughly 20% annualized realized (three-month) volatility versus about 11% for the S&P 500 (1.8x the market). A 5% - 7% position keeps a single-name swing of that size within a diversified portfolio's risk budget.
Diversification Alternatives
PGR - Progressive
Pure-Play GrowthOffers exposure to a superior growth profile, with trailing revenue up 8.5%. Its focus on competitive pricing and direct channels is capturing market share, particularly in personal auto.
CB - Chubb
Premium UnderwritingProvides exposure to complex, global commercial risks with a stronger underlying combined ratio of 82.2% in Q2. It also has a better growth profile, with trailing revenue up 8.5%.
Travelers is a disciplined underwriting engine that leverages scale and data analytics to generate durable, high-return earnings and substantial capital returns in the volatile P&C insurance market.
Travelers' value proposition is its consistent execution and underwriting discipline across a diversified portfolio of commercial and personal insurance lines. The company uses its scale and data advantages to out-select and out-price competitors, leading to strong, durable underlying underwriting income. This, combined with a high-quality investment portfolio, generates significant cash flow, which is consistently returned to shareholders through dividends and substantial share repurchases.
Continued strong retention rates and renewal premium changes, stable or improving underlying combined ratios, and consistent share repurchase activity.
A significant, unexpected spike in catastrophe losses that exhausts reinsurance, a sharp deterioration in casualty loss cost trends that outpaces pricing, or a breakdown in underwriting discipline leading to margin compression.
Short-term stock price volatility around earnings reports that may overreact to quarterly catastrophe losses or reserve development, which can be lumpy but do not necessarily alter the long-term earnings power of the franchise.
Repricing Catalyst
The market's increasing recognition of the durability of the company's underlying underwriting income and its consistent, large-scale capital return program, which has retired 12% of shares outstanding since the beginning of 2025.
Business Insurance
$26.3B TTM (54% of Total)What It Is
Offers a broad array of property and casualty insurance products and services to small, mid-sized, and large businesses, primarily in the United States but also internationally. Products include workers' compensation, commercial automobile, commercial property, and general liability.
Who Pays & How
Businesses of all sizes pay premiums to protect against operational risks, third-party liability, and property damage. They choose Travelers based on factors including product offerings, service levels, price, claim handling, and the company's perceived financial strength.
Competition
Personal Insurance
$18.0B TTM (37% of Total)What It Is
Offers a broad range of property and casualty insurance products covering individuals' personal risks, primarily in the United States. Primary products are automobile and homeowners insurance.
Who Pays & How
Individuals pay premiums to protect against losses to their vehicles, homes, and contents, as well as for personal liability. They choose Travelers based on breadth of product offerings, price, service (including claims handling), and brand recognition.
Competition
Bond & Specialty Insurance
$4.7B TTM (10% of Total)What It Is
Offers surety, fidelity, management liability (e.g., directors' and officers'), and professional liability coverages to a wide range of customers, from construction firms and financial institutions to public corporations and private companies, primarily in the U.S.
Who Pays & How
Businesses and other organizations pay premiums for guarantees of contract performance (surety), protection against employee theft (fidelity), and coverage for liability claims against management and professionals.
Competition
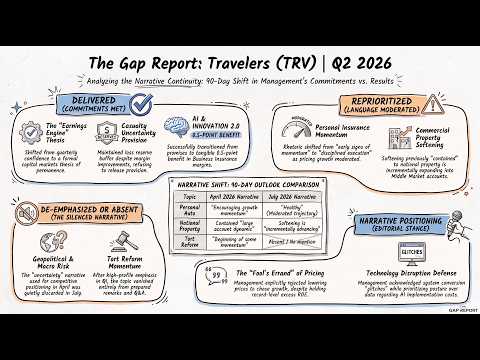
Travelers Companies — Investor Video Playlist




Industry Resources
| Financials Resources |
| Federal Reserve Economic Data |
| Federal Reserve |
| FDIC Data |
| American Banker |
| The Banker |
| Banking Technology |
| Property & Casualty Insurance Resources |
| Insurance Journal |
| Business Insurance |
| PropertyCasualty360 |
External Quote Links
| Y Finance | Barrons |
| TradingView | Morningstar |
| SeekingAlpha | ValueLine |
| Motley Fool | Robinhood |
| CNBC | Etrade |
| MarketWatch | Unusual Whales |
| YCharts | Perplexity Finance |
| FinViz |
Prefer one of these to Trefis? Tell us why.