
Arch Capital (ACGL)
Market Price (9/14/2026): $96.08 | Market Cap: $33.0 BilSector: Financials | Industry: Property & Casualty Insurance
Arch Capital (ACGL)
Market Price (9/14/2026): $96.08Market Cap: $33.0 BilSector: FinancialsIndustry: Property & Casualty Insurance
Investment Highlights Why It Matters Detailed financial logic regarding cash flow yields vs trend-riding momentum.
Attractive yieldTotal YieldTotal Yield = Earnings Yield + Dividend Yield, Earnings Yield = Net Income / Market Cap Dividend Yield = Total Dividends / Market Cap is 14%, ERPEquity Risk Premium (ERP) = Total Yield - Risk Free Rate, Reflects the premium above risk free assets offered by the investment. is 10%, FCF Yield is 18% Cash is significant % of market capNet D/ENet Debt/Equity. Debt net of cash. Negative indicates net cash. Equity is taken as the Market Capitalization is -26% Attractive cash flow generationCFO/Rev LTMCash Flow from Operations / Revenue (Sales), Last Twelve Months (LTM) is 33%, FCF/Rev LTMFree Cash Flow / Revenue (Sales), Last Twelve Months (LTM) is 33%, CFO LTM is 6.1 Bil, FCF LTM is 6.1 Bil Stock buyback supportStock Buyback 3Y Total is 3.9 Bil Low stock price volatilityVol 12M is 21% Megatrend and thematic driversMegatrends include AI in Financial Services, and Cybersecurity. Themes include AI for Fraud Detection, and Cloud Security. | Weak multi-year price returns2Y Excs Rtn is -50%, 3Y Excs Rtn is -39% | Weak revenue growthRev Chg QQuarterly Revenue Change % is -9.7% Key risksACGL key risks include [1] increased defaults in its mortgage insurance segment from economic stress and [2] slowing premium growth from cooling demand in its key mortgage and reinsurance markets. |
| Attractive yieldTotal YieldTotal Yield = Earnings Yield + Dividend Yield, Earnings Yield = Net Income / Market Cap Dividend Yield = Total Dividends / Market Cap is 14%, ERPEquity Risk Premium (ERP) = Total Yield - Risk Free Rate, Reflects the premium above risk free assets offered by the investment. is 10%, FCF Yield is 18% |
| Cash is significant % of market capNet D/ENet Debt/Equity. Debt net of cash. Negative indicates net cash. Equity is taken as the Market Capitalization is -26% |
| Attractive cash flow generationCFO/Rev LTMCash Flow from Operations / Revenue (Sales), Last Twelve Months (LTM) is 33%, FCF/Rev LTMFree Cash Flow / Revenue (Sales), Last Twelve Months (LTM) is 33%, CFO LTM is 6.1 Bil, FCF LTM is 6.1 Bil |
| Stock buyback supportStock Buyback 3Y Total is 3.9 Bil |
| Low stock price volatilityVol 12M is 21% |
| Megatrend and thematic driversMegatrends include AI in Financial Services, and Cybersecurity. Themes include AI for Fraud Detection, and Cloud Security. |
| Weak multi-year price returns2Y Excs Rtn is -50%, 3Y Excs Rtn is -39% |
| Weak revenue growthRev Chg QQuarterly Revenue Change % is -9.7% |
| Key risksACGL key risks include [1] increased defaults in its mortgage insurance segment from economic stress and [2] slowing premium growth from cooling demand in its key mortgage and reinsurance markets. |
Qualitative Assessment
AI Analysis | Feedback
Arch Capital (ACGL) stock has gained about 10% since 5/31/2026 because of the following key factors:
1. Strong Q2 2026 Earnings Beat.
Arch Capital reported robust financial results for its fiscal Q2 2026 (ending June 30, 2026), exceeding analyst expectations. The company announced after-tax operating income of $2.56 per share, surpassing the consensus estimate of $2.47 per share by $0.09. Additionally, quarterly revenue reached $4.67 billion, outperforming analysts' projections of $4.36 billion. This strong performance highlighted effective underwriting across its insurance, reinsurance, and mortgage segments, reflected in an accident-year combined ratio (excluding catastrophes) of 82.5%.
2. Significant Share Repurchase Program.
The company demonstrated a commitment to returning value to shareholders through substantial share repurchases. During fiscal Q2 2026, Arch Capital repurchased 12.4 million common shares for an aggregate amount of $1.2 billion. This significant capital allocation strategy can signal confidence from management in the company's valuation and future prospects, contributing to positive investor sentiment.
Show more
Arch Capital (ACGL) stock has gained about 10% since 5/31/2026 because of the following key factors:
1. Strong Q2 2026 Earnings Beat.
Arch Capital reported robust financial results for its fiscal Q2 2026 (ending June 30, 2026), exceeding analyst expectations. The company announced after-tax operating income of $2.56 per share, surpassing the consensus estimate of $2.47 per share by $0.09. Additionally, quarterly revenue reached $4.67 billion, outperforming analysts' projections of $4.36 billion. This strong performance highlighted effective underwriting across its insurance, reinsurance, and mortgage segments, reflected in an accident-year combined ratio (excluding catastrophes) of 82.5%.
2. Significant Share Repurchase Program.
The company demonstrated a commitment to returning value to shareholders through substantial share repurchases. During fiscal Q2 2026, Arch Capital repurchased 12.4 million common shares for an aggregate amount of $1.2 billion. This significant capital allocation strategy can signal confidence from management in the company's valuation and future prospects, contributing to positive investor sentiment.
3. Positive Analyst Sentiment and Increased Price Targets.
Following the strong earnings report, multiple financial analysts revised their outlooks for Arch Capital, leading to increased price targets and reaffirming positive ratings. For instance, Cantor Fitzgerald raised its price target from $102.00 to $110.00, and Mizuho increased its target from $101.00 to $104.00. JPMorgan Chase & Co. also raised its price objective to $118.00, while Royal Bank of Canada set a new target of $120.00. The consensus 12-month price target reached $111.11, suggesting potential upside.
4. Favorable Underwriting Conditions and Rising Investment Income.
Arch Capital benefited from solid underwriting discipline within its diverse segments, particularly in casualty-focused lines, which continued to achieve rate increases. While global commercial insurance rates generally softened in Q2 2026, Arch's selective risk strategy allowed it to maintain profitability. Furthermore, the company saw an increase in its pre-tax net investment income, rising to $417 million in Q2 2026 from $405 million in the prior year, supported by an increase in investable assets to $49.5 billion.
Show less
Stock Movement Drivers
Fundamental Drivers
The 7.6% change in ACGL stock from 5/31/2026 to 9/13/2026 was primarily driven by a 8.5% change in the company's P/E Multiple.| (LTM values as of) | 5312026 | 9132026 | Change |
|---|---|---|---|
| Stock Price ($) | 89.34 | 96.09 | 7.6% |
| Change Contribution By: | |||
| Total Revenues ($ Mil) | 19,079 | 18,595 | -2.5% |
| Net Income Margin (%) | 25.5% | 25.2% | -1.2% |
| P/E Multiple | 6.5 | 7.0 | 8.5% |
| Shares Outstanding (Mil) | 353 | 343 | 2.9% |
| Cumulative Contribution | 7.6% |
Market Drivers
5/31/2026 to 9/13/2026| Return | Correlation | |
|---|---|---|
| ACGL | 7.6% | |
| Market (SPY) | 1.0% | -38.5% |
| Sector (XLF) | 11.0% | 37.9% |
Fundamental Drivers
The -4.1% change in ACGL stock from 2/28/2026 to 9/13/2026 was primarily driven by a -14.1% change in the company's P/E Multiple.| (LTM values as of) | 2282026 | 9132026 | Change |
|---|---|---|---|
| Stock Price ($) | 100.15 | 96.09 | -4.1% |
| Change Contribution By: | |||
| Total Revenues ($ Mil) | 19,300 | 18,595 | -3.7% |
| Net Income Margin (%) | 22.8% | 25.2% | 10.7% |
| P/E Multiple | 8.2 | 7.0 | -14.1% |
| Shares Outstanding (Mil) | 359 | 343 | 4.7% |
| Cumulative Contribution | -4.1% |
Market Drivers
2/28/2026 to 9/13/2026| Return | Correlation | |
|---|---|---|
| ACGL | -4.1% | |
| Market (SPY) | 11.7% | -17.3% |
| Sector (XLF) | 11.9% | 40.8% |
Fundamental Drivers
The 5.0% change in ACGL stock from 8/31/2025 to 9/13/2026 was primarily driven by a 25.4% change in the company's Net Income Margin (%).| (LTM values as of) | 8312025 | 9132026 | Change |
|---|---|---|---|
| Stock Price ($) | 91.53 | 96.09 | 5.0% |
| Change Contribution By: | |||
| Total Revenues ($ Mil) | 18,555 | 18,595 | 0.2% |
| Net Income Margin (%) | 20.1% | 25.2% | 25.4% |
| P/E Multiple | 9.1 | 7.0 | -23.0% |
| Shares Outstanding (Mil) | 372 | 343 | 8.4% |
| Cumulative Contribution | 5.0% |
Market Drivers
8/31/2025 to 9/13/2026| Return | Correlation | |
|---|---|---|
| ACGL | 5.0% | |
| Market (SPY) | 19.5% | -17.3% |
| Sector (XLF) | 7.3% | 29.2% |
Fundamental Drivers
The 31.5% change in ACGL stock from 8/31/2023 to 9/13/2026 was primarily driven by a 59.5% change in the company's Total Revenues ($ Mil).| (LTM values as of) | 8312023 | 9132026 | Change |
|---|---|---|---|
| Stock Price ($) | 73.09 | 96.09 | 31.5% |
| Change Contribution By: | |||
| Total Revenues ($ Mil) | 11,657 | 18,595 | 59.5% |
| Net Income Margin (%) | 19.4% | 25.2% | 30.0% |
| P/E Multiple | 11.9 | 7.0 | -41.0% |
| Shares Outstanding (Mil) | 369 | 343 | 7.4% |
| Cumulative Contribution | 31.5% |
Market Drivers
8/31/2023 to 9/13/2026| Return | Correlation | |
|---|---|---|
| ACGL | 31.5% | |
| Market (SPY) | 75.7% | 18.4% |
| Sector (XLF) | 74.0% | 44.5% |
Price Returns Compared
| 2021 | 2022 | 2023 | 2024 | 2025 | 2026 | Total [1] | |
|---|---|---|---|---|---|---|---|
| Returns | |||||||
| ACGL Return | 23% | 41% | 18% | 31% | 4% | 0% | 180% |
| Peers Return | 16% | 15% | 6% | 29% | 16% | 1% | 115% |
| S&P 500 Return | 27% | -19% | 24% | 23% | 16% | 11% | 102% |
Monthly Win Rates [3] | |||||||
| ACGL Win Rate | 67% | 67% | 58% | 58% | 50% | 44% | |
| Peers Win Rate | 57% | 55% | 55% | 57% | 65% | 49% | |
| S&P 500 Win Rate | 75% | 42% | 67% | 75% | 67% | 44% | |
Max Drawdowns [4] | |||||||
| ACGL Max Drawdown | -14% | -17% | -18% | -19% | -13% | -14% | |
| Peers Max Drawdown | -16% | -22% | -19% | -12% | -17% | -14% | |
| S&P 500 Max Drawdown | -5% | -25% | -10% | -8% | -19% | -9% | |
[1] Cumulative total returns since the beginning of 2021
[2] Peers: EG, RNR, AXS, MKL, WRB. See ACGL Returns vs. Peers.
[3] Win Rate = % of calendar months in which monthly returns were positive
[4] Max drawdown represents maximum peak-to-trough decline within a year
[5] 2026 data is for the year up to 9/11/2026 (YTD)
How Low Can It Go
| Event | ACGL | S&P 500 |
|---|---|---|
| 2020 COVID-19 Crash | ||
| % Loss | -51.7% | -33.7% |
| % Gain to Breakeven | 107.1% | 50.9% |
| Time to Breakeven | 687 days | 140 days |
| Q4 2018 Fed Policy Error / Growth Scare | ||
| % Loss | -15.3% | -19.2% |
| % Gain to Breakeven | 18.1% | 23.8% |
| Time to Breakeven | 38 days | 105 days |
| 2015-2016 China Devaluation / Global Growth Scare | ||
| % Loss | -12.1% | -12.2% |
| % Gain to Breakeven | 13.8% | 13.9% |
| Time to Breakeven | 196 days | 62 days |
| 2008-2009 Global Financial Crisis | ||
| % Loss | -35.5% | -53.4% |
| % Gain to Breakeven | 55.0% | 114.4% |
| Time to Breakeven | 212 days | 1085 days |
| Summer 2007 Credit Crunch | ||
| % Loss | -13.0% | -8.6% |
| % Gain to Breakeven | 14.9% | 9.5% |
| Time to Breakeven | 53 days | 47 days |
In The Past
Arch Capital's stock fell -4.2% during the 2025 US Tariff Shock. Such a loss loss requires a 4.4% gain to breakeven.
Preserve Wealth
Limiting losses and compounding gains is essential to preserving wealth.
Asset Allocation
Actively managed asset allocation strategies protect wealth. Learn more.
| Event | ACGL | S&P 500 |
|---|---|---|
| 2020 COVID-19 Crash | ||
| % Loss | -51.7% | -33.7% |
| % Gain to Breakeven | 107.1% | 50.9% |
| Time to Breakeven | 687 days | 140 days |
| 2008-2009 Global Financial Crisis | ||
| % Loss | -35.5% | -53.4% |
| % Gain to Breakeven | 55.0% | 114.4% |
| Time to Breakeven | 212 days | 1085 days |
In The Past
Arch Capital's stock fell -4.2% during the 2025 US Tariff Shock. Such a loss loss requires a 4.4% gain to breakeven.
Preserve Wealth
Limiting losses and compounding gains is essential to preserving wealth.
Asset Allocation
Actively managed asset allocation strategies protect wealth. Learn more.
About Arch Capital (ACGL)
Arch Capital Group Ltd. (ACGL) is a global financial services company specializing in risk management across three primary business segments: insurance, reinsurance, and mortgage insurance. Essentially, Arch Capital helps individuals, businesses, and other insurance companies protect themselves against financial losses arising from a wide spectrum of risks, ranging from everyday operational liabilities to catastrophic events.
The company's Insurance segment offers a broad range of direct and excess coverage products to businesses, including casualty, professional liability (such as Directors & Officers), workers' compensation, commercial property, marine, aviation, and specialized lines like medical professional liability and surety. These products are distributed globally through independent retail and wholesale brokers. Its Reinsurance segment provides coverage to other insurance companies, helping them manage their own risk exposures from large claims or catastrophic events across areas like casualty, property catastrophe, marine, and life. Lastly, the Mortgage segment provides direct mortgage insurance and mortgage reinsurance, which protects lenders against losses from borrower defaults. Arch Capital serves a diverse global market, with its customers ranging from individual businesses to other large insurance carriers and mortgage lenders.
AI Analysis | Feedback
Here are 1-3 brief analogies for Arch Capital (ACGL):
- It's like a combination of a major diversified insurer such as Travelers or Chubb, and a specialized provider of mortgage insurance.
- Think of it as a broad insurance and reinsurance holding company, similar in diversified scope to a smaller Berkshire Hathaway, but with a significant focus on mortgage insurance.
AI Analysis | Feedback
- Insurance Products: Provides a broad spectrum of primary and excess coverages including casualty, property, specialty lines like D&O and E&O, medical professional liability, workers' compensation, and accident & health.
- Reinsurance Products: Offers casualty, property, catastrophe, marine, aviation, surety, agriculture, and life reinsurance to other insurance companies globally.
- Mortgage Insurance Products: Supplies both direct mortgage insurance, protecting lenders from borrower defaults, and mortgage reinsurance to other mortgage insurers.
AI Analysis | Feedback
- Other Insurance and Reinsurance Companies: These companies purchase reinsurance protection from Arch Capital's Reinsurance segment and mortgage reinsurance from its Mortgage segment to manage their own risk exposures and capital requirements.
- Financial Institutions and Mortgage Lenders: Banks, credit unions, and other mortgage originators are direct customers of Arch Capital's direct mortgage insurance products, which protect them against borrower defaults.
- Businesses and Corporations across Diverse Industries: Arch Capital's Insurance segment provides a wide array of commercial insurance coverages (e.g., casualty, property, professional liability, workers' compensation, commercial auto, marine, aviation, surety) to a broad spectrum of businesses of various sizes and industries globally.
AI Analysis | Feedback
AI Analysis | Feedback
Nicolas Papadopoulo Chief Executive Officer
Mr. Papadopoulo was appointed Chief Executive Officer of Arch Capital Group Ltd. in October 2024 and has been a member of the board since then. He joined Arch Reinsurance Ltd. in December 2001 and has held various leadership and underwriting roles within the company. His prior positions at Arch include President and Chief Underwriting Officer of Arch Capital Group and CEO of Arch Worldwide Insurance Group from January 2021 to October 2024, Chairman and CEO of Arch Worldwide Insurance Group and CUO for Property and Casualty Operations from September 2017 to December 2020, and Chairman and CEO of Arch Reinsurance Group from July 2014 to September 2017. Before joining Arch, he held various positions at Sorema N.A. Reinsurance Group and served as an insurance examiner with the Ministry of Finance, Insurance Department, in France. Mr. Papadopoulo previously served on the board of directors of Coface SA and Premia Holdings Ltd. In 2017, Arch sponsored Premia with Kelso & Company, a private equity firm, and Mr. Papadopoulo invested in Premia.
François Morin Executive Vice President and Chief Financial Officer
Mr. Morin assumed the role of Executive Vice President and Chief Financial Officer of Arch Capital Group Ltd. effective May 25, 2018. He joined Arch in 2011, having previously served as Senior Vice President, Chief Risk Officer, and Chief Actuary of ACGL. Prior to his tenure at Arch, Mr. Morin held various roles for Towers Watson & Co. and its predecessor firm Towers, Perrin, Forster & Crosby, including its actuarial division, Tillinghast, where he led the firm's engagement with ACGL. He has nearly 30 years of experience in the insurance industry. Mr. Morin holds a bachelor's degree in Actuarial Science from Université Laval in Canada and is a Fellow of the Casualty Actuarial Society, a Chartered Financial Analyst, and a member of the American Academy of Actuaries.
Maamoun Rajeh President
Mr. Rajeh was named President of Arch Capital Group Ltd. in November 2024, with primary responsibility for Arch's Global Reinsurance Group and Global Mortgage Group. He joined Arch Re Bermuda in 2001 as an underwriter. His previous roles at Arch include Chairman and Chief Executive Officer of Arch Worldwide Reinsurance from October 2017 to November 2024, Chairman and CEO of Arch Reinsurance Ltd. from July 2014 to September 2017, and CEO and President at Arch Reinsurance Europe Underwriting Ltd from July 2012 to July 2014. Before joining Arch, Mr. Rajeh served in various business analysis positions at the United States Fidelity and Guarantee Company and as an underwriter at F&G Re, and later as Assistant Vice President at HartRe, a subsidiary of The Hartford Financial Services Group, Inc. He serves on the Board of Directors at Premia Holdings Ltd., which was sponsored by Arch and private equity firm Kelso & Company.
David Gansberg President
Mr. Gansberg was promoted to President of Arch Capital Group Ltd. in November 2024, with primary accountability for Arch's Insurance Group. He joined Arch in 2001. Prior to his current role, he served as CEO of Arch's Mortgage Group since 2019 and as President and CEO of Arch Mortgage Insurance Company (Arch MI). Before his work with the Mortgage Group, Mr. Gansberg was Executive Vice President and a director at Arch Re (U.S.). He holds a bachelor's degree in actuarial mathematics from the University of Michigan and an MBA from the Duke University Fuqua School of Business.
W. Preston Hutchings Senior Adviser
Mr. Hutchings currently serves as a Senior Adviser to Arch Capital Group, having previously held the positions of Senior Vice President and Chief Investment Officer at Arch Capital Group Ltd. from June 2005 to June 2021, and President of its investment management subsidiary. Before joining Arch, he served as Senior Vice President and Chief Investment Officer at Mid Ocean Reinsurance Ltd. from January 1995 until its acquisition by XL Capital in August 1998, and then as Senior Vice President and Chief Investment Officer of Renaissance Reinsurance Ltd. from August 1998 to June 2005. He began his career in 1981 as a municipal bond trader at J.P. Morgan & Company. Mr. Hutchings is also an adviser to a Hong Kong-based private equity firm (LimeTree Capital) and to a Mumbai-based equity manager. He also serves as chairman of China Car Park Ltd., which is managed by LimeTree Capital, and is a Senior Advisor to VSS Capital Partners, a private investment firm.
```AI Analysis | Feedback
Key Risks for Arch Capital (ACGL)
- Catastrophic Events and Underwriting Risk: Arch Capital, through its insurance and reinsurance segments, is significantly exposed to the financial impact of catastrophic events, including natural disasters (such as hurricanes, earthquakes, and wildfires), man-made catastrophes, and other large-scale loss events. Inaccurate pricing of these risks or the occurrence of events exceeding modeled expectations can lead to substantial claims and significant underwriting losses.
- Adverse Developments in the Housing Market and Economic Downturns: The company's mortgage segment, which provides direct mortgage insurance and mortgage reinsurance, is highly sensitive to conditions in the housing market and the broader economy. A significant downturn in housing prices, an increase in mortgage defaults, or a severe economic recession could lead to a substantial increase in claims for its mortgage insurance products.
- Investment Market Volatility and Interest Rate Risk: Like other insurance and reinsurance companies, Arch Capital maintains substantial investment portfolios to support its liabilities. Fluctuations in interest rates, credit markets, or general investment market conditions can adversely affect the value of these investments and reduce investment income, thereby impacting the company's overall profitability and financial strength.
AI Analysis | Feedback
AI Analysis | Feedback
AI Analysis | Feedback
For Arch Capital (ACGL), several key drivers are expected to contribute to future revenue growth over the next two to three years:
- Growth in the Insurance Segment fueled by Favorable Market Conditions: Arch Capital's Insurance segment has demonstrated robust growth, with increased gross and net premiums written. This expansion is supported by strategic initiatives, including past acquisitions like Allianz's US MidCorp and Entertainment businesses, and is further bolstered by favorable dynamics in the property and casualty (P&C) market. A hardening P&C environment, characterized by firm market rates and inflation-led demand, is expected to continue supporting higher premiums and stronger demand for coverage across its insurance lines.
- Strategic Focus and Expansion within Reinsurance Specialty Lines and Geographies: While some areas of the reinsurance market face competitive pressures, Arch Capital is strategically focusing on growth opportunities in specialty lines and specific geographies within its Reinsurance segment. The Reinsurance unit has significantly grown its net written premiums, and this targeted approach is anticipated to drive continued revenue despite broader market challenges in areas like property catastrophe reinsurance.
- Increased Net Investment Income: A significant contributor to Arch Capital's overall financial performance is its net investment income. The company has consistently generated strong operating cash flows, which in turn leads to an increase in its investable asset base. This growth in invested assets is expected to continue fueling higher net investment income, providing a stable and growing source of revenue.
- Sustained Performance and New Business Generation in the Mortgage Segment: Arch Capital's Mortgage segment is expected to contribute to future revenue growth through its continued strong underwriting performance and the generation of new business. Recent periods have shown new insurance written in the US mortgage insurance (USMI) business at high levels, coupled with high persistency rates, which helps maintain a stable to growing insurance in force.
AI Analysis | Feedback
Share Repurchases
- Arch Capital's board approved a $2.0 billion increase to its share repurchase program in September 2025, bringing the total authorization to approximately $2.3 billion as of September 4, 2025.
- The company repurchased $1.9 billion of common stock during 2025, which accounted for 5.6% of its outstanding shares.
- In December 2024, a $1 billion share repurchase authorization was renewed, replacing the prior program, with approximately $1 billion available as of September 30, 2024.
Outbound Investments
- In August 2024, Arch Insurance North America completed the acquisition of Allianz's U.S. MidCorp and Entertainment insurance businesses for $450 million in cash, an acquisition estimated to require approximately $1.4 billion in capital support.
- Arch Capital acquired Fireman's Fund Insurance Company in April 2024.
- In 2021, Arch Capital completed several acquisitions, including Westpac, Somerset Bridge Insurance Services, Somerset Bridge Group, and Coface.
Peer Outperformance in Property & Casualty Insurance
| Industry | Names | 1Y med | 3Y med | 5Y med | Top 3 by 5Y |
|---|---|---|---|---|---|
| Investment Banking & Brokerage | 13 | 4.4% | 109.9% | 135.9% | IBKR 511% · SNEX 266% · GS 188% |
| Reinsurance | 6 | 18.8% | 73.7% | 132.8% | SPNT 164% · RGA 143% · RNR 133% |
| Diversified Banks | 12 | 37.8% | 127.6% | 118.3% | JPM 157% · CM 153% · RY 143% |
| Life & Health Insurance | 20 | 8.2% | 54.2% | 103.2% | JXN 569% · UNM 321% · FG 203% |
| Multi-Sector Holdings | 4 | 3.5% | 53.9% | 82.7% | JONE 361% · BRK-B 84% · VOYA 81% |
| Regional Banks | 265 | 26.8% | 84.7% | 68.7% | GCBC 366% · ESQ 361% · VBNK 332% |
| Property & Casualty Insurance ← | 42 | 9.4% | 68.6% | 68.2% | ASIC 2746900% · HRTG 471% · UVE 308% |
| Multi-line Insurance | 9 | 8.9% | 78.7% | 64.5% | GNW 193% · L 108% · SLF 91% |
| Consumer Finance | 30 | 5.7% | 87.6% | 33.8% | ENVA 603% · EZPW 379% · FCFS 180% |
| Financial Exchanges & Data | 15 | -6.5% | 11.8% | 30.5% | VIRT 201% · CBOE 142% · CME 80% |
| Diversified Financial Services | 4 | 0.9% | 14.0% | 24.1% | FRHC 174% · EQH 106% · TMS -58% |
| Insurance Brokers | 16 | -17.9% | -3.8% | 20.4% | LIFE 347% · ARX 89% · AJG 75% |
| Asset Management & Custody Banks | 83 | -10.8% | 13.7% | 14.4% | WT 340% · SII 291% · VCTR 280% |
| Commercial & Residential Mortgage Finance | 12 | -48.2% | 28.3% | 2.8% | FNMA 488% · FMCC 458% · ESNT 70% |
| Specialized Finance | 3 | 27.4% | 39.8% | -0.4% | EFC 30% · CACC 0% · HASI -13% |
| Mortgage REITs | 33 | -13.2% | 8.4% | -15.4% | NREF 55% · RITM 48% · DX 37% |
| Transaction & Payment Processing Services | 15 | 2.2% | -8.7% | -41.9% | V 73% · MA 70% · CPAY 60% |
| Diversified Capital Markets | 21 | -33.6% | 2.7% | -43.9% | OPY 215% · LPLA 153% · GOLD 103% |
Latest Trefis Analyses
Research & Analysis
Invest in Strategies
Wealth Management
Peer Comparisons
| Peers to compare with: |
Financials
| Median | |
|---|---|
| Name | |
| Mkt Price | 211.62 |
| Mkt Cap | 18.4 |
| Rev LTM | 15,676 |
| Op Inc LTM | - |
| FCF LTM | 2,962 |
| FCF 3Y Avg | 3,481 |
| CFO LTM | 3,029 |
| CFO 3Y Avg | 3,531 |
Growth & Margins
| Median | |
|---|---|
| Name | |
| Rev Chg LTM | 1.4% |
| Rev Chg 3Y Avg | 8.4% |
| Rev Chg Q | -3.5% |
| QoQ Delta Rev Chg LTM | -0.9% |
| Op Inc Chg LTM | - |
| Op Inc Chg 3Y Avg | - |
| Op Mgn LTM | - |
| Op Mgn 3Y Avg | - |
| QoQ Delta Op Mgn LTM | - |
| CFO/Rev LTM | 28.4% |
| CFO/Rev 3Y Avg | 24.0% |
| FCF/Rev LTM | 27.9% |
| FCF/Rev 3Y Avg | 23.6% |
Price Behavior
| Market Price | $96.09 | |
| Market Cap ($ Bil) | 33.0 | |
| First Trading Date | 09/14/1995 | |
| Distance from 52W High | -9.8% | |
| 50 Days | 200 Days | |
| DMA Price | $99.80 | $96.16 |
| DMA Trend | up | up |
| Distance from DMA | -3.7% | -0.1% |
| 3M | 1YR | |
| Volatility | 23.1% | 21.0% |
| Downside Capture | -91.76 | -46.04 |
| Upside Capture | -54.20 | -32.38 |
| Correlation (SPY) | -31.6% | -18.3% |
| 1M | 2M | 3M | 6M | 1Y | 3Y | |
|---|---|---|---|---|---|---|
| Beta | -0.57 | -0.82 | -0.78 | -0.32 | -0.31 | 0.28 |
| Up Beta | -0.25 | -1.30 | -0.48 | 0.04 | 0.04 | 0.51 |
| Down Beta | -1.06 | -0.07 | -0.58 | -0.54 | -0.39 | 0.35 |
| Up Capture | -71% | -67% | -59% | -25% | -17% | 3% |
| Bmk +ve Days | 10 | 21 | 32 | 68 | 138 | 427 |
| Stock +ve Days | 11 | 21 | 34 | 67 | 135 | 396 |
| Down Capture | -63% | -100% | -153% | -53% | -81% | 9% |
| Bmk -ve Days | 11 | 21 | 32 | 59 | 113 | 324 |
| Stock -ve Days | 10 | 21 | 30 | 60 | 116 | 353 |
[1] Upside and downside betas calculated using positive and negative benchmark daily returns respectively
Based On 1-Year Data
| Annualized Return | Annualized Volatility | Sharpe Ratio | Correlation with ACGL | |
|---|---|---|---|---|
| ACGL | 6.1% | 21.1% | 0.18 | - |
| Sector ETF (XLF) | 9.0% | 14.6% | 0.37 | 29.9% |
| Equity (SPY) | 18.3% | 12.8% | 1.03 | -17.7% |
| Gold (GLD) | 19.0% | 29.2% | 0.59 | -13.2% |
| Commodities (DBC) | 48.3% | 20.6% | 1.80 | -15.6% |
| Real Estate (VNQ) | 7.6% | 13.6% | 0.29 | 30.7% |
| Bitcoin (BTCUSD) | -32.4% | 43.8% | -0.77 | -13.8% |
Smart multi-asset allocation framework can stack odds in your favor. Learn How
Based On 5-Year Data
| Annualized Return | Annualized Volatility | Sharpe Ratio | Correlation with ACGL | |
|---|---|---|---|---|
| ACGL | 20.3% | 24.6% | 0.72 | - |
| Sector ETF (XLF) | 10.2% | 18.4% | 0.42 | 52.2% |
| Equity (SPY) | 12.5% | 17.2% | 0.55 | 32.9% |
| Gold (GLD) | 18.7% | 18.8% | 0.81 | -2.8% |
| Commodities (DBC) | 11.4% | 19.5% | 0.46 | 2.8% |
| Real Estate (VNQ) | 0.7% | 18.9% | -0.07 | 33.1% |
| Bitcoin (BTCUSD) | 9.4% | 52.6% | 0.36 | 9.4% |
Smart multi-asset allocation framework can stack odds in your favor. Learn How
Based On 10-Year Data
| Annualized Return | Annualized Volatility | Sharpe Ratio | Correlation with ACGL | |
|---|---|---|---|---|
| ACGL | 14.0% | 27.6% | 0.51 | - |
| Sector ETF (XLF) | 13.2% | 22.1% | 0.54 | 66.9% |
| Equity (SPY) | 15.2% | 17.9% | 0.72 | 53.8% |
| Gold (GLD) | 12.3% | 16.3% | 0.62 | -0.8% |
| Commodities (DBC) | 8.7% | 18.1% | 0.39 | 15.3% |
| Real Estate (VNQ) | 4.7% | 20.7% | 0.19 | 55.0% |
| Bitcoin (BTCUSD) | 63.2% | 66.2% | 1.03 | 9.5% |
Smart multi-asset allocation framework can stack odds in your favor. Learn How
Returns Analyses
Earnings Returns History
Updated 8/28/2026| Forward Returns | |||
|---|---|---|---|
| Earnings Date | 1D Returns | 5D Returns | 21D Returns |
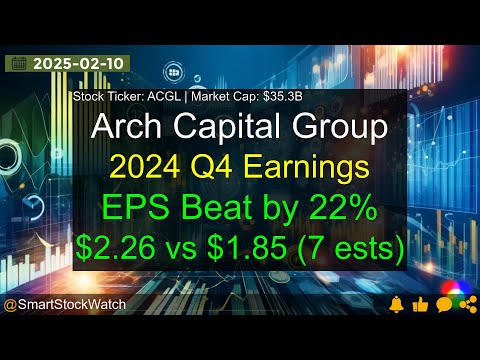
| 7/28/2026 | -1.8% | -6.5% | -5.4% |
| 4/28/2026 | -4.5% | -3.0% | -6.6% |
| 2/9/2026 | 1.9% | 2.9% | -1.3% |
| 10/27/2025 | -1.4% | 0.1% | 8.9% |
| 7/29/2025 | -0.6% | 2.9% | 6.5% |
| 4/29/2025 | -1.9% | 0.7% | 2.0% |
| 2/10/2025 | -2.0% | -3.4% | -2.5% |
| 10/30/2024 | -6.3% | -3.3% | 0.7% |
| ... | |||
| SUMMARY STATS | |||
| # Positive | 8 | 14 | 13 |
| # Negative | 16 | 10 | 11 |
| Median Positive | 2.4% | 2.9% | 6.8% |
| Median Negative | -1.9% | -2.4% | -3.7% |
| Max Positive | 5.9% | 15.2% | 20.4% |
| Max Negative | -6.3% | -6.5% | -8.1% |
| Forward Returns | |||
|---|---|---|---|
| Earnings Date | 1D Returns | 5D Returns | 21D Returns |
| 7/28/2026 | -1.8% | -6.5% | -5.4% |
| 4/28/2026 | -4.5% | -3.0% | -6.6% |
| 2/9/2026 | 1.9% | 2.9% | -1.3% |
| 10/27/2025 | -1.4% | 0.1% | 8.9% |
| 7/29/2025 | -0.6% | 2.9% | 6.5% |
| 4/29/2025 | -1.9% | 0.7% | 2.0% |
| 2/10/2025 | -2.0% | -3.4% | -2.5% |
| 10/30/2024 | -6.3% | -3.3% | 0.7% |
| 7/30/2024 | -2.5% | -1.6% | 13.0% |
| 4/29/2024 | 2.5% | 6.5% | 11.3% |
| 2/14/2024 | 3.0% | 1.1% | 8.3% |
| 10/30/2023 | 4.6% | 2.8% | -0.6% |
| 7/26/2023 | -2.9% | -5.8% | -8.1% |
| 4/26/2023 | 2.2% | 4.6% | 0.1% |
| 2/13/2023 | 1.6% | 3.5% | -3.8% |
| 10/26/2022 | 5.9% | 15.2% | 20.4% |
| 7/27/2022 | -2.2% | -1.8% | 6.8% |
| 4/27/2022 | -2.4% | -1.3% | -1.8% |
| 2/9/2022 | -1.8% | -1.3% | -5.2% |
| 10/27/2021 | -0.7% | 2.2% | -1.0% |
| 7/28/2021 | 1.2% | 3.6% | 8.7% |
| 4/27/2021 | -2.5% | -0.6% | -3.7% |
| 2/9/2021 | -0.6% | 0.7% | 5.4% |
| 10/29/2020 | -0.7% | 4.9% | 5.8% |
| SUMMARY STATS | |||
| # Positive | 8 | 14 | 13 |
| # Negative | 16 | 10 | 11 |
| Median Positive | 2.4% | 2.9% | 6.8% |
| Median Negative | -1.9% | -2.4% | -3.7% |
| Max Positive | 5.9% | 15.2% | 20.4% |
| Max Negative | -6.3% | -6.5% | -8.1% |
SEC Filings
Expand for More| Report Date | Filing Date | Filing |
|---|---|---|
| 06/30/2026 | 08/04/2026 | 10-Q |
| 03/31/2026 | 05/05/2026 | 10-Q |
| 12/31/2025 | 02/26/2026 | 10-K |
| 09/30/2025 | 11/06/2025 | 10-Q |
| 06/30/2025 | 08/05/2025 | 10-Q |
| 03/31/2025 | 05/07/2025 | 10-Q |
| 12/31/2024 | 02/27/2025 | 10-K |
| 09/30/2024 | 11/07/2024 | 10-Q |
| 06/30/2024 | 08/06/2024 | 10-Q |
| 03/31/2024 | 05/09/2024 | 10-Q |
| 12/31/2023 | 02/23/2024 | 10-K |
| 09/30/2023 | 11/09/2023 | 10-Q |
| 06/30/2023 | 08/02/2023 | 10-Q |
| 03/31/2023 | 05/04/2023 | 10-Q |
| 12/31/2022 | 02/24/2023 | 10-K |
| 09/30/2022 | 11/03/2022 | 10-Q |
| Report Date | Filing Date | Filing |
|---|---|---|
| 06/30/2026 | 08/04/2026 | 10-Q |
| 03/31/2026 | 05/05/2026 | 10-Q |
| 12/31/2025 | 02/26/2026 | 10-K |
| 09/30/2025 | 11/06/2025 | 10-Q |
| 06/30/2025 | 08/05/2025 | 10-Q |
| 03/31/2025 | 05/07/2025 | 10-Q |
| 12/31/2024 | 02/27/2025 | 10-K |
| 09/30/2024 | 11/07/2024 | 10-Q |
| 06/30/2024 | 08/06/2024 | 10-Q |
| 03/31/2024 | 05/09/2024 | 10-Q |
| 12/31/2023 | 02/23/2024 | 10-K |
| 09/30/2023 | 11/09/2023 | 10-Q |
| 06/30/2023 | 08/02/2023 | 10-Q |
| 03/31/2023 | 05/04/2023 | 10-Q |
| 12/31/2022 | 02/24/2023 | 10-K |
| 09/30/2022 | 11/03/2022 | 10-Q |
| 06/30/2022 | 08/03/2022 | 10-Q |
| 03/31/2022 | 05/04/2022 | 10-Q |
| 12/31/2021 | 02/25/2022 | 10-K |
| 09/30/2021 | 11/04/2021 | 10-Q |
| 06/30/2021 | 08/05/2021 | 10-Q |
| 03/31/2021 | 05/06/2021 | 10-Q |
| 12/31/2020 | 02/26/2021 | 10-K |
| 09/30/2020 | 11/05/2020 | 10-Q |
| 06/30/2020 | 08/06/2020 | 10-Q |
| 03/31/2020 | 05/08/2020 | 10-Q |
| 12/31/2019 | 02/28/2020 | 10-K |
| 09/30/2019 | 11/08/2019 | 10-Q |
Insider Activity
Updated 8/20/2026| # | Owner | Title | Holding | Action | Filing Date | Price | Shares | Transacted Value | Value of Held Shares | Form |
|---|---|---|---|---|---|---|---|---|---|---|
| 1 | Morin, Francois | CFO and Treasurer | Direct | Sell | 8202026 | 99.32 | 11,010 | 1,093,529 | 18,357,177 | Form |
| 2 | Posner, Brian S | Direct | Sell | 6042026 | 19.66 | 3,000 | Form | |||
| 3 | Posner, Brian S | Direct | Sell | 5122026 | 17.14 | 2,000 | Form | |||
| 4 | Houston, Daniel Joseph | Direct | Buy | 5042026 | 94.08 | 5,300 | 498,650 | 932,853 | Form | |
| 5 | Posner, Brian S | Direct | Sell | 3122026 | 17.11 | 3,000 | 51,345 | 34,230 | Form |
| # | Owner | Title | Holding | Action | Filing Date | Price | Shares | Transacted Value | Value of Held Shares | Form |
|---|---|---|---|---|---|---|---|---|---|---|
| 1 | Morin, Francois | CFO and Treasurer | Direct | Sell | 8202026 | 99.32 | 11,010 | 1,093,529 | 18,357,177 | Form |
| 2 | Posner, Brian S | Direct | Sell | 6042026 | 19.66 | 3,000 | Form | |||
| 3 | Posner, Brian S | Direct | Sell | 5122026 | 17.14 | 2,000 | Form | |||
| 4 | Houston, Daniel Joseph | Direct | Buy | 5042026 | 94.08 | 5,300 | 498,650 | 932,853 | Form | |
| 5 | Posner, Brian S | Direct | Sell | 3122026 | 17.11 | 3,000 | 51,345 | 34,230 | Form | |
| 6 | Gansberg, David | President, Arch Capital Group | Direct | Sell | 3122026 | 96.37 | 5,907 | 569,266 | 32,434,696 | Form |
| 7 | Papadopoulo, Nicolas | CEO | Direct | Sell | 3122026 | 96.31 | 21,930 | 2,112,063 | 83,942,608 | Form |
| 8 | Rajeh, Maamoun | President, Arch Capital Group | Direct | Sell | 2132026 | 96.12 | 47,430 | 4,558,858 | 41,675,534 | Form |
| 9 | Pasquesi, John M | Trust | Sell | 12162025 | 94.17 | 8,800 | 828,684 | 27,267,083 | Form | |
| 10 | Pasquesi, John M | Trust | Sell | 12162025 | 93.90 | 203,866 | 19,142,047 | 32,990,656 | Form | |
| 11 | Morin, Francois | EVP AND CFO | Direct | Sell | 12022025 | 94.62 | 8,000 | 756,996 | 25,234,556 | Form |
| 12 | Rajeh, Maamoun | PRESIDENT, ARCH CAPITAL GROUP | Direct | Sell | 8252025 | 94.15 | 10,000 | 941,464 | 40,820,843 | Form |
| 13 | Posner, Brian S | Direct | Buy | 8042025 | 17.34 | 1,000 | 17,338 | 86,690 | Form |
Investor Activity (13F)
Updated Sep 14, 2026Active managers (13F portfolio over $250M, at least 3 holdings) with a position over $5M that is either over 10% of their portfolio or held in a concentrated book of 50 or fewer total positions. Index/ETF, sovereign, bank, community-bank and charitable/donor-advised filers are excluded.
| Active Manager | Value | % of Portfolio | Total Positions | QoQ | Filing |
|---|---|---|---|---|---|
| High Ground Investment Management LLP | $172.2 Mil | 32.0% | 5 | Hold | 13F |
| Robertson Opportunity Capital, LLC | $19.4 Mil | 7.5% | 30 | Hold | 13F |
| Maren Capital LLC | $113.2 Mil | 5.9% | 19 | Hold | 13F |
| Marshfield Associates | $292.9 Mil | 5.9% | 17 | ADD +5.7% | 13F |
| Gladstone Capital Management LLP | $46.3 Mil | 4.6% | 32 | TRIM -35.7% | 13F |
| Kinsale Capital Group, Inc. | $9.6 Mil | 1.5% | 41 | Hold | 13F |
| Egerton Capital (UK) LLP | $107.2 Mil | 1.2% | 24 | New | 13F |
| Active Manager | Value | % of Portfolio | Total Positions | QoQ | Filing |
|---|---|---|---|---|---|
| Marshfield Associates | $292.9 Mil | 5.9% | 17 | ADD +5.7% | 13F |
| High Ground Investment Management LLP | $172.2 Mil | 32.0% | 5 | Hold | 13F |
| Maren Capital LLC | $113.2 Mil | 5.9% | 19 | Hold | 13F |
| Egerton Capital (UK) LLP | $107.2 Mil | 1.2% | 24 | New | 13F |
| Gladstone Capital Management LLP | $46.3 Mil | 4.6% | 32 | TRIM -35.7% | 13F |
| Robertson Opportunity Capital, LLC | $19.4 Mil | 7.5% | 30 | Hold | 13F |
| Kinsale Capital Group, Inc. | $9.6 Mil | 1.5% | 41 | Hold | 13F |
Arch Capital — Investor Video Playlist



Industry Resources
| Financials Resources |
| Federal Reserve Economic Data |
| Federal Reserve |
| FDIC Data |
| American Banker |
| The Banker |
| Banking Technology |
| Property & Casualty Insurance Resources |
| Insurance Journal |
| Business Insurance |
| PropertyCasualty360 |
External Quote Links
| Y Finance | Barrons |
| TradingView | Morningstar |
| SeekingAlpha | ValueLine |
| Motley Fool | Robinhood |
| CNBC | Etrade |
| MarketWatch | Unusual Whales |
| YCharts | Perplexity Finance |
| FinViz |
Prefer one of these to Trefis? Tell us why.