
Trekor Metals (TGB)
Market Price (10/31/2026): $7.5 | Market Cap: $2.7 BilSector: Materials | Industry: Copper
Trekor Metals (TGB)
Market Price (10/31/2026): $7.5Market Cap: $2.7 BilSector: MaterialsIndustry: Copper
Investment Highlights Why It Matters Detailed financial logic regarding cash flow yields vs trend-riding momentum.
Strong revenue growthRev Chg LTMRevenue Change % Last Twelve Months (LTM) is 70% Attractive cash flow generationCFO/Rev LTMCash Flow from Operations / Revenue (Sales), Last Twelve Months (LTM) is 42%, FCF/Rev LTMFree Cash Flow / Revenue (Sales), Last Twelve Months (LTM) is 28% Attractive yieldFCF Yield is 10% Megatrend and thematic driversMegatrends include Electric Vehicles & Autonomous Driving, and Renewable Energy Transition. Themes include EV Manufacturing, Battery Storage & Grid Modernization, Show more. | Expensive valuation multiplesP/EPrice/Earnings or Price/(Net Income) is 172x Yield minus risk free rate is negativeERPEquity Risk Premium (ERP) = Total Yield - Risk Free Rate, Reflects the premium above risk free assets offered by the investment. is -3.5% Key risksTGB key risks include [1] operational and execution challenges at its specific Gibraltar and Florence Copper projects and [2] a high-leverage financial structure that could impact its ability to secure capital for development. |
| Strong revenue growthRev Chg LTMRevenue Change % Last Twelve Months (LTM) is 70% |
| Attractive cash flow generationCFO/Rev LTMCash Flow from Operations / Revenue (Sales), Last Twelve Months (LTM) is 42%, FCF/Rev LTMFree Cash Flow / Revenue (Sales), Last Twelve Months (LTM) is 28% |
| Attractive yieldFCF Yield is 10% |
| Megatrend and thematic driversMegatrends include Electric Vehicles & Autonomous Driving, and Renewable Energy Transition. Themes include EV Manufacturing, Battery Storage & Grid Modernization, Show more. |
| Expensive valuation multiplesP/EPrice/Earnings or Price/(Net Income) is 172x |
| Yield minus risk free rate is negativeERPEquity Risk Premium (ERP) = Total Yield - Risk Free Rate, Reflects the premium above risk free assets offered by the investment. is -3.5% |
| Key risksTGB key risks include [1] operational and execution challenges at its specific Gibraltar and Florence Copper projects and [2] a high-leverage financial structure that could impact its ability to secure capital for development. |
Qualitative Assessment
AI Analysis | Feedback
Trekor Metals (TGB) stock has gained about 5% since 6/30/2026 because of the following key factors:
1. Strong Fiscal Q3 2026 Copper Production Growth and Upgraded Guidance.
Trekor Metals (TGB) reported robust copper production for fiscal Q3 2026 (ending September 30, 2026), with a combined output of 41 million pounds from its Gibraltar mine and Florence Copper operations. Gibraltar's production increased by 12% quarter-over-quarter to 34 million pounds, while Florence Copper saw a significant 36% quarter-over-quarter increase to 7 million pounds. Building on this performance, Trekor Metals raised its 2026 copper production guidance for Gibraltar to 115-120 million pounds, an increase from its original forecast of 110-115 million pounds. The company also updated Florence Copper's 2026 production outlook to 25-28 million pounds.
2. Initiation of Commercial Production at Florence Copper.
A significant operational milestone for Trekor Metals was achieved on October 6, 2026, with the official commencement of commercial production at its Florence Copper facility in Arizona. This project is recognized as the world's first greenfield commercial-scale in-situ copper operation. Despite an acknowledged three-month delay in wellfield expansion, initial flow rates at Florence Copper have surpassed expectations, indicating strong operational progress.
Show more
Trekor Metals (TGB) stock has gained about 5% since 6/30/2026 because of the following key factors:
1. Strong Fiscal Q3 2026 Copper Production Growth and Upgraded Guidance.
Trekor Metals (TGB) reported robust copper production for fiscal Q3 2026 (ending September 30, 2026), with a combined output of 41 million pounds from its Gibraltar mine and Florence Copper operations. Gibraltar's production increased by 12% quarter-over-quarter to 34 million pounds, while Florence Copper saw a significant 36% quarter-over-quarter increase to 7 million pounds. Building on this performance, Trekor Metals raised its 2026 copper production guidance for Gibraltar to 115-120 million pounds, an increase from its original forecast of 110-115 million pounds. The company also updated Florence Copper's 2026 production outlook to 25-28 million pounds.
2. Initiation of Commercial Production at Florence Copper.
A significant operational milestone for Trekor Metals was achieved on October 6, 2026, with the official commencement of commercial production at its Florence Copper facility in Arizona. This project is recognized as the world's first greenfield commercial-scale in-situ copper operation. Despite an acknowledged three-month delay in wellfield expansion, initial flow rates at Florence Copper have surpassed expectations, indicating strong operational progress.
3. Positive Analyst Sentiment and Price Target Revisions.
During the period, analysts maintained a positive outlook on Trekor Metals. As of October 23, 2026, analysts covering TGB held a "Strong Buy" consensus rating. The average analyst price target for Trekor Metals ranged from approximately $10.49 to $10.64, with some targets as high as $14.00, suggesting considerable upside from the stock's trading price during this time. Several analysts reiterated "Buy" ratings and increased their price targets in October 2026, citing the strong ramp-up at Florence Copper and solid performance at Gibraltar.
4. Favorable Broader Copper Market Dynamics.
The overall market for copper contributed positively to Trekor Metals' stock performance. Global basic metals production is projected to increase by 3.3% in 2026, with non-ferrous metals, including copper, expected to grow at an above-average rate of 3.5% in 2026. Demand for high-tech and capital goods, which are significant consumers of copper, is being supported by AI-related capital spending and a growth-friendly policy environment in the U.S. Strong copper prices were also a driver for record profits reported by other mining companies in fiscal Q3 2026, indicating a supportive market environment for copper producers like Trekor Metals.
Show less
Stock Movement Drivers
Fundamental Drivers
The 7.0% change in TGB stock from 6/30/2026 to 10/30/2026 was primarily driven by a 27.8% change in the company's Total Revenues ($ Mil).| (LTM values as of) | 6302026 | 10302026 | Change |
|---|---|---|---|
| Stock Price ($) | 6.88 | 7.36 | 7.0% |
| Change Contribution By: | |||
| Total Revenues ($ Mil) | 771 | 985 | 27.8% |
| Net Income Margin (%) | 2.0% | 1.6% | -20.0% |
| P/E Multiple | 163.1 | 171.7 | 5.3% |
| Shares Outstanding (Mil) | 363 | 366 | -0.6% |
| Cumulative Contribution | 7.0% |
Market Drivers
6/30/2026 to 10/30/2026| Return | Correlation | |
|---|---|---|
| TGB | 7.0% | |
| Market (SPY) | 1.2% | 49.0% |
| Sector (XLB) | 3.8% | 24.3% |
Fundamental Drivers
The 14.1% change in TGB stock from 3/31/2026 to 10/30/2026 was primarily driven by a 46.4% change in the company's Total Revenues ($ Mil).| (LTM values as of) | 3312026 | 10302026 | Change |
|---|---|---|---|
| Stock Price ($) | 6.45 | 7.36 | 14.1% |
| Change Contribution By: | |||
| Total Revenues ($ Mil) | 673 | 985 | 46.4% |
| P/S Multiple | 3.4 | 2.7 | -18.7% |
| Shares Outstanding (Mil) | 351 | 366 | -4.1% |
| Cumulative Contribution | 14.1% |
Market Drivers
3/31/2026 to 10/30/2026| Return | Correlation | |
|---|---|---|
| TGB | 14.1% | |
| Market (SPY) | 16.5% | 56.9% |
| Sector (XLB) | 5.9% | 42.9% |
Fundamental Drivers
The 74.0% change in TGB stock from 9/30/2025 to 10/30/2026 was primarily driven by a 70.3% change in the company's Total Revenues ($ Mil).| (LTM values as of) | 9302025 | 10302026 | Change |
|---|---|---|---|
| Stock Price ($) | 4.23 | 7.36 | 74.0% |
| Change Contribution By: | |||
| Total Revenues ($ Mil) | 579 | 985 | 70.3% |
| P/S Multiple | 2.3 | 2.7 | 18.3% |
| Shares Outstanding (Mil) | 316 | 366 | -13.6% |
| Cumulative Contribution | 74.0% |
Market Drivers
9/30/2025 to 10/30/2026| Return | Correlation | |
|---|---|---|
| TGB | 74.0% | |
| Market (SPY) | 14.4% | 51.2% |
| Sector (XLB) | 19.3% | 46.5% |
Fundamental Drivers
The 479.5% change in TGB stock from 9/30/2023 to 10/30/2026 was primarily driven by a 742.7% change in the company's P/E Multiple.| (LTM values as of) | 9302023 | 10302026 | Change |
|---|---|---|---|
| Stock Price ($) | 1.27 | 7.36 | 479.5% |
| Change Contribution By: | |||
| Total Revenues ($ Mil) | 418 | 985 | 135.8% |
| Net Income Margin (%) | 4.3% | 1.6% | -63.0% |
| P/E Multiple | 20.4 | 171.7 | 742.7% |
| Shares Outstanding (Mil) | 289 | 366 | -21.1% |
| Cumulative Contribution | 479.5% |
Market Drivers
9/30/2023 to 10/30/2026| Return | Correlation | |
|---|---|---|
| TGB | 479.5% | |
| Market (SPY) | 82.9% | 45.2% |
| Sector (XLB) | 41.6% | 47.7% |
Price Returns Compared
| 2021 | 2022 | 2023 | 2024 | 2025 | 2026 | Total [1] | |
|---|---|---|---|---|---|---|---|
| Returns | |||||||
| TGB Return | 55% | -28% | -5% | 39% | 192% | 30% | 458% |
| Peers Return | 49% | -2% | 20% | 6% | 74% | 18% | 282% |
| S&P 500 Return | 27% | -19% | 24% | 23% | 16% | 13% | 106% |
Monthly Win Rates [3] | |||||||
| TGB Win Rate | 50% | 42% | 42% | 58% | 75% | 50% | |
| Peers Win Rate | 50% | 48% | 52% | 45% | 67% | 50% | |
| S&P 500 Win Rate | 75% | 42% | 67% | 75% | 67% | 50% | |
Max Drawdowns [4] | |||||||
| TGB Max Drawdown | -43% | -62% | -42% | -38% | -33% | -35% | |
| Peers Max Drawdown | -33% | -50% | -33% | -33% | -32% | -31% | |
| S&P 500 Max Drawdown | -5% | -25% | -10% | -8% | -19% | -9% | |
[1] Cumulative total returns since the beginning of 2021
[2] Peers: SCCO, FCX, HBM, ERO, TECK.
[3] Win Rate = % of calendar months in which monthly returns were positive
[4] Max drawdown represents maximum peak-to-trough decline within a year
[5] 2026 data is for the year up to 10/30/2026 (YTD)
How Low Can It Go
| Event | TGB | S&P 500 |
|---|---|---|
| 2025 US Tariff Shock | ||
| % Loss | -17.5% | -18.8% |
| % Gain to Breakeven | 21.2% | 23.1% |
| Time to Breakeven | 6 days | 79 days |
| 2024 Yen Carry Trade Unwind | ||
| % Loss | -25.9% | -7.8% |
| % Gain to Breakeven | 34.9% | 8.5% |
| Time to Breakeven | 50 days | 18 days |
| Summer-Fall 2023 Five Percent Yield Shock | ||
| % Loss | -26.7% | -9.5% |
| % Gain to Breakeven | 36.4% | 10.5% |
| Time to Breakeven | 64 days | 24 days |
| 2023 SVB Regional Banking Crisis | ||
| % Loss | -26.9% | -6.7% |
| % Gain to Breakeven | 36.9% | 7.1% |
| Time to Breakeven | 283 days | 31 days |
| 2022 Inflation Shock & Fed Tightening | ||
| % Loss | -56.9% | -24.5% |
| % Gain to Breakeven | 131.9% | 32.4% |
| Time to Breakeven | 620 days | 427 days |
| 2020 COVID-19 Crash | ||
| % Loss | -50.1% | -33.7% |
| % Gain to Breakeven | 100.5% | 50.9% |
| Time to Breakeven | 58 days | 140 days |
In The Past
Trekor Metals's stock fell -17.5% during the 2025 US Tariff Shock. Such a loss loss requires a 21.2% gain to breakeven.
Preserve Wealth
Limiting losses and compounding gains is essential to preserving wealth.
Asset Allocation
Actively managed asset allocation strategies protect wealth. Learn more.
| Event | TGB | S&P 500 |
|---|---|---|
| 2024 Yen Carry Trade Unwind | ||
| % Loss | -25.9% | -7.8% |
| % Gain to Breakeven | 34.9% | 8.5% |
| Time to Breakeven | 50 days | 18 days |
| Summer-Fall 2023 Five Percent Yield Shock | ||
| % Loss | -26.7% | -9.5% |
| % Gain to Breakeven | 36.4% | 10.5% |
| Time to Breakeven | 64 days | 24 days |
| 2023 SVB Regional Banking Crisis | ||
| % Loss | -26.9% | -6.7% |
| % Gain to Breakeven | 36.9% | 7.1% |
| Time to Breakeven | 283 days | 31 days |
| 2022 Inflation Shock & Fed Tightening | ||
| % Loss | -56.9% | -24.5% |
| % Gain to Breakeven | 131.9% | 32.4% |
| Time to Breakeven | 620 days | 427 days |
| 2020 COVID-19 Crash | ||
| % Loss | -50.1% | -33.7% |
| % Gain to Breakeven | 100.5% | 50.9% |
| Time to Breakeven | 58 days | 140 days |
| Q4 2018 Fed Policy Error / Growth Scare | ||
| % Loss | -41.5% | -19.2% |
| % Gain to Breakeven | 70.8% | 23.8% |
| Time to Breakeven | 595 days | 105 days |
| 2015-2016 China Devaluation / Global Growth Scare | ||
| % Loss | -46.5% | -12.2% |
| % Gain to Breakeven | 86.9% | 13.9% |
| Time to Breakeven | 54 days | 62 days |
| 2014-2016 Oil Price Collapse | ||
| % Loss | -88.5% | -6.8% |
| % Gain to Breakeven | 768.7% | 7.3% |
| Time to Breakeven | 632 days | 15 days |
| 2013 Taper Tantrum | ||
| % Loss | -21.1% | -0.2% |
| % Gain to Breakeven | 26.7% | 0.2% |
| Time to Breakeven | 34 days | 1 days |
| 2011 US Debt Ceiling Crisis & European Contagion | ||
| % Loss | -48.6% | -17.9% |
| % Gain to Breakeven | 94.7% | 21.8% |
| Time to Breakeven | 5154 days | 123 days |
| 2010 Eurozone Sovereign Debt Crisis / Flash Crash | ||
| % Loss | -43.5% | -15.4% |
| % Gain to Breakeven | 77.1% | 18.2% |
| Time to Breakeven | 94 days | 125 days |
| 2008-2009 Global Financial Crisis | ||
| % Loss | -88.6% | -53.4% |
| % Gain to Breakeven | 778.6% | 114.4% |
| Time to Breakeven | 388 days | 1085 days |
In The Past
Trekor Metals's stock fell -17.5% during the 2025 US Tariff Shock. Such a loss loss requires a 21.2% gain to breakeven.
Preserve Wealth
Limiting losses and compounding gains is essential to preserving wealth.
Asset Allocation
Actively managed asset allocation strategies protect wealth. Learn more.
About Trekor Metals (TGB)
Trekor Metals (TGB) is a Canadian-headquartered mining company engaged in the acquisition, development, and operation of mineral properties. The company's core business revolves around exploring for and producing a diverse portfolio of metals, including copper, molybdenum, gold, niobium, and silver. These raw materials are essential inputs for various industrial sectors globally, serving a broad market for base and precious metals.
The company's operational footprint is primarily in British Columbia, Canada, where it holds a significant 75% interest in the Gibraltar mine. Trekor Metals also fully owns several other key projects within British Columbia, such as the Yellowhead copper project, the Aley niobium project, and the New Prosperity gold and copper project. Expanding its reach into the United States, the company also holds 100% interest in the Florence copper project located in Arizona.
AI Analysis | Feedback
- A diversified metals mining company, like a smaller Barrick Gold, but with a stronger focus on copper.
- A copper mining specialist, similar to a regional Freeport-McMoRan.
AI Analysis | Feedback
- Copper: A reddish metal widely used for electrical wiring, plumbing, and industrial machinery due to its high conductivity.
- Molybdenum: A silvery-white metal primarily used as an alloying agent in steel to increase strength, hardness, and corrosion resistance.
- Gold: A valuable, ductile, and malleable precious metal primarily used in jewelry, investment, and various industrial applications.
- Niobium: A rare, soft, and ductile transition metal primarily used in special steel alloys for high-strength applications and superalloys.
- Silver: A lustrous precious metal valued for its use in jewelry, coinage, tableware, and its excellent electrical and thermal conductivity.
AI Analysis | Feedback
Trekor Metals (symbol: TGB) is not a known publicly traded company. However, the background information provided describes Taseko Mines Limited, which trades under the symbol TGB. Based on the provided background for Taseko Mines Limited, here are its major customers:
Taseko Mines Limited is a mining company focused on the extraction and processing of mineral resources, primarily copper concentrate. As such, it operates in a business-to-business (B2B) model, selling its products to other industrial companies rather than directly to individual consumers.
Due to the competitive nature of the mining industry, companies like Taseko typically do not publicly disclose the specific names of their major customers. However, based on the standard industry supply chain for mineral concentrates, their customers fall into the following categories:
-
Metal Smelters and Refiners: These are large industrial facilities that purchase raw copper concentrate (and other metal concentrates) from mining companies. They process these concentrates through smelting and refining operations to produce refined metals (e.g., copper cathodes or rods). These customers are often multinational corporations located globally, particularly in major metal-consuming regions like Asia (China, Japan, South Korea), Europe, and North America.
-
Commodity Trading Houses/Merchants: Global trading firms specialize in buying and selling raw materials and commodities. They act as intermediaries, purchasing concentrates from miners and selling them to smelters, refiners, or large industrial end-users. These companies manage logistics, financing, and market risks associated with global commodity trade.
-
Large Industrial Consumers (potentially, especially for refined products): While most concentrate sales from current operations (like the Gibraltar mine) go to smelters, for future projects like the Florence Copper Project (which aims to produce refined copper cathode directly via in-situ recovery), customers could also include direct manufacturers in industries such as electrical wire and cable, automotive, construction, and electronics, which require high-purity refined copper.
AI Analysis | Feedback
AI Analysis | Feedback
Stuart McDonald, President and Chief Executive Officer
Mr. McDonald has over 25 years of experience in mining, corporate development, financial, and management roles. He joined Taseko Mines Limited as Chief Financial Officer in 2013 and was appointed President in June 2019, later also assuming the role of Chief Executive Officer in July 2021. Prior to joining Taseko, he served as CFO of Quadra FNX Mining Ltd. (and its predecessor Quadra Mining Ltd.) from 2007 to 2010, where he was instrumental in growing the company organically and through a merger valued at over $2 billion. He also held CFO positions at Yukon Zinc Corp. and was Corporate Controller at Cumberland Resources Ltd. until its acquisition by Agnico-Eagle Mines in 2007. Earlier in his career, he spent 10 years in public accounting with Deloitte & Touche and Ernst & Young.
Bryce Hamming, Chief Financial Officer
Mr. Hamming is the Chief Financial Officer of Trekor Metals, a position he assumed in 2019. He is a senior officer of the company. He participated in the 2024 Bloomberg Canadian Finance Conference, discussing copper and critical minerals.
Richard Tremblay, Chief Operating Officer
Mr. Tremblay was appointed Chief Operating Officer in November 2023. He joined Taseko in 2014 as General Manager of the Gibraltar Mine and later transitioned to the corporate leadership team as Senior Vice President, Operations. With over 30 years of experience in the mining industry, he has focused on large-scale open-pit mining operations and mineral processing. Mr. Tremblay has been instrumental in the development of the Florence Copper Project, including its permitting and technical de-risking.
Richard Weymark, Vice President, Engineering
Mr. Weymark was appointed Vice President, Engineering in June 2021. He joined Taseko in 2018 as Chief Engineer. Prior to Taseko, he spent 10 years in progressively senior roles at Teck's Highland Valley Copper operation, gaining experience in mine engineering, mine operations, and tailings dam construction. He focuses on advancing the engineering and environmental aspects of Trekor's development projects.
Sean Magee, Vice President of Corporate Affairs
Mr. Magee serves as the Vice President of Corporate Affairs for Trekor Metals.
AI Analysis | Feedback
The key risks for Trekor Metals (symbol: TGB) are primarily related to the cyclical nature of the mining industry and the inherent challenges of resource extraction and project development.
- Commodity Price Volatility: Trekor Metals explores for and operates mines producing copper, molybdenum, gold, niobium, and silver. The profitability of the company is directly tied to the fluctuating global market prices of these commodities, which are influenced by supply and demand dynamics, global economic conditions, and speculative trading. Significant drops in commodity prices could adversely impact the company's revenue, profitability, and project viability.
- Operational and Project Development Risks: As a mining company, Trekor Metals faces a range of operational challenges inherent in the acquisition, development, and operation of mineral properties. These risks include unexpected geological conditions, technical difficulties in mining and processing, equipment failures, labor disputes, accidents, and rising operating costs. Furthermore, the development of new projects, such as the Yellowhead copper project, the Aley niobium project, and the New Prosperity gold and copper project, involves substantial capital expenditure, long lead times, and uncertainties related to construction, commissioning, and achieving design capacity.
- Environmental and Regulatory Risks: Trekor Metals operates in jurisdictions such as British Columbia and Arizona, which have stringent environmental regulations. The company faces risks associated with obtaining and maintaining necessary permits and licenses, compliance with environmental laws, managing waste and water, and potential liabilities from environmental damage. Delays in permitting processes, changes in environmental regulations, or opposition from local communities and Indigenous groups could significantly impact project timelines and costs, as evidenced by ongoing permitting for the Yellowhead project.
AI Analysis | Feedback
AI Analysis | Feedback
The addressable markets for Taseko Mines Limited's main products are as follows:
- Copper: The global copper market size was estimated at USD 260.2 billion in 2026. This market is projected to grow to USD 388.8 billion by 2033, with a compound annual growth rate (CAGR) of 5.9% from 2026 to 2033.
- Molybdenum: The global molybdenum market size is projected to grow from USD 5.23 billion in 2026 to USD 7.91 billion by 2034, exhibiting a CAGR of 5.31% during the forecast period.
- Gold: The global gold market is expected to grow from 5,118.1 tons in 2026 to 7,424.4 tons by 2034, recording a CAGR of 4.70% during the forecast period. In terms of value, the global gold precious metal market size was valued at US$ 354,004.4 million in 2024.
- Niobium: The global niobium market size is estimated at USD 3.6 billion in 2026 and is projected to reach USD 6.5 billion by the end of 2035, expanding at a CAGR of 6.8% during the forecast timeline.
- Silver: The global silver market size is projected to grow from USD 105.15 billion in 2026 to USD 223.11 billion by 2034, at a CAGR of 9.86% during the forecast period.
AI Analysis | Feedback
Trekor Metals (TGB) is expected to experience significant revenue growth over the next 2-3 years, driven primarily by the following factors:
- Florence Copper Project Ramp-up and Full Production: The Florence Copper project in Arizona, which achieved over 90% completion by July 2025, is a key driver. It began producing its first copper cathode before the end of 2025, with 1.5 million pounds produced in the first quarter of 2026. Management anticipates Florence to produce 30-35 million pounds of copper in 2026, with production weighted towards the second half of the year, and to reach a steady-state annual production of approximately 80-85 million pounds by 2027 as the wellfield expands. This project is poised to become a significant domestic copper supplier in the United States.
- Increased Production at Gibraltar Mine: Taseko's Gibraltar mine, the company's foundational asset, is projected to see increased and more consistent production. Taseko expects improved mill availability at Gibraltar to result in annual production of 120-130 million pounds of copper, a notable increase over 2024, with this surge anticipated in the latter part of 2025. In the first quarter of 2026, Gibraltar produced 30.0 million pounds of copper, marking a 50% increase over the same period in 2025, and the company forecasts higher overall copper production and more consistent quarterly output for 2026.
- Advancement of the Yellowhead Copper Project: The Yellowhead Copper Project, located in British Columbia, presents a substantial long-term growth opportunity. A technical report from July 2025 highlighted significantly improved project economics, establishing it as a world-class copper asset with a $2 billion Net Present Value (NPV) and an average annual copper production potential of 178 million pounds over a 25-year mine life. Over the next few years, Trekor Metals will be advancing critical aspects such as engineering, community engagement, copper offtake discussions, and project financing initiatives in parallel with the permitting process, which is expected to enhance its future revenue potential.
- Sustained Strong Copper Prices: Favorable market conditions, particularly robust copper prices, are expected to bolster revenue growth. The President and CEO of Taseko, Stuart McDonald, has expressed optimism regarding the copper market, citing strong demand driven by global electrification trends and limited mine supply as factors likely to maintain elevated copper prices through 2026. The average LME copper price in the first quarter of 2026 was 16% higher than the preceding quarter, further indicating a supportive pricing environment.
AI Analysis | Feedback
Share Repurchases
No information was found regarding specific share repurchase programs or dollar amounts for Trekor Metals (TGB) within the last 3-5 years.Share Issuance
- The number of shares outstanding for Trekor Metals (TGB) has generally increased over the past few years. From the end of 2021 to June 2026, the shares outstanding increased from approximately 280 million to 323.496 million.
- The number of shares increased by 12.56% in one year, with 365.63 million shares outstanding as of a recent report.
Inbound Investments
- Trekor Metals secured a financing agreement with Mitsui for a $50 million advance during the construction of the Florence Copper project, which included a stream for 2.67% of copper at a discounted price.
- The company also has a royalty agreement with Taurus for 2.05% of perpetual gross revenues for another $50 million related to the Florence Copper project.
Outbound Investments
No information was found regarding significant outbound investments made by Trekor Metals (TGB) in other companies within the last 3-5 years.Capital Expenditures
- Taseko (now Trekor Metals) has experienced significant cash burn primarily driven by massive capital expenditures, which totaled CAD 127.5 million in one quarter alone in 2025.
- Total capital expenditures for the construction of the commercial facility at the Florence Copper project were $274.6 million.
- Capital expenditures in Q1 2026 included $13.075 million for wellfield development at Florence Copper. The company plans to drill about another 100 wells in 2026 to support the ramp-up of Florence Copper to full capacity in 2027.
- The initial capital costs for the Yellowhead copper project are estimated at $2.0 billion. This project is expected to be eligible for the Canadian federal Clean Technology Manufacturing Investment Tax Credit, which could reimburse approximately $540 million (30% of eligible initial capital costs) in the first year of operation.
Peer Outperformance in Copper
| Industry | Names | 1Y med | 3Y med | 5Y med | Top 3 by 5Y |
|---|---|---|---|---|---|
| Steel | 14 | 25.8% | 48.3% | 138.2% | STLD 308% · HCC 297% · RS 224% |
| Copper ← | 7 | 35.9% | 103.0% | 132.9% | SCCO 265% · TGB 249% · HBM 215% |
| Gold | 36 | -1.7% | 157.5% | 91.5% | IAG 458% · OGC 344% · AGI 283% |
| Silver | 6 | 15.9% | 236.6% | 68.9% | AYA 209% · HL 139% · EXK 43% |
| Construction Materials | 6 | -11.3% | 34.4% | 47.9% | USLM 360% · CRH 102% · VMC 54% |
| Aluminum | 3 | 13.7% | 126.6% | 43.5% | CENX 155% · AA -10% |
| Metal, Glass & Plastic Containers | 11 | 7.5% | 16.3% | 9.2% | GEF 49% · ATR 21% · SLGN 9% |
| Paper & Plastic Packaging Products & Materials | 7 | 25.1% | 23.1% | 0.8% | PKG 117% · CCK 21% · SON 4% |
| Diversified Metals & Mining | 23 | -55.2% | -5.8% | -10.0% | USAR 32182% · MTRN 215% · MP 17% |
| Diversified Chemicals | 3 | 12.8% | 4.8% | -14.0% | CBT 55% · ASH -14% · CC -43% |
| Specialty Chemicals | 41 | 11.9% | 8.4% | -17.2% | NEU 155% · ESI 61% · ECL 44% |
| Commodity Chemicals | 13 | 3.9% | -14.7% | -33.4% | HWKN 336% · MEOH 74% · DOW -18% |
| Precious Metals & Minerals | 8 | -17.8% | 132.3% | -48.9% | PPTA 250% |
| Fertilizers & Agricultural Chemicals | 10 | -42.6% | -54.5% | -60.7% | CF 141% · NTR 18% · SMG -49% |
| Paper Products | 4 | -39.4% | -61.7% | -82.6% |
Latest Trefis Analyses
| Title | Date | |
|---|---|---|
| DASHBOARDS | ||
| Taseko Mines Stock Jump Looks Great, But How Secure Is That Gain? | 10/17/2025 |
| Title | |
|---|---|
| ARTICLES |
Research & Analysis
Invest in Strategies
Wealth Management
Peer Comparisons
| Peers to compare with: |
Financials
| Median | |
|---|---|
| Name | |
| Mkt Price | 44.84 |
| Mkt Cap | 19.2 |
| Rev LTM | 8,796 |
| Op Inc LTM | 2,792 |
| FCF LTM | 1,023 |
| FCF 3Y Avg | 472 |
| CFO LTM | 3,211 |
| CFO 3Y Avg | 1,998 |
Growth & Margins
| Median | |
|---|---|
| Name | |
| Rev Chg LTM | 38.5% |
| Rev Chg 3Y Avg | 21.7% |
| Rev Chg Q | 37.0% |
| QoQ Delta Rev Chg LTM | 8.3% |
| Op Inc Chg LTM | 84.2% |
| Op Inc Chg 3Y Avg | 100.5% |
| Op Mgn LTM | 30.9% |
| Op Mgn 3Y Avg | 25.9% |
| QoQ Delta Op Mgn LTM | 2.0% |
| CFO/Rev LTM | 39.5% |
| CFO/Rev 3Y Avg | 35.4% |
| FCF/Rev LTM | 16.6% |
| FCF/Rev 3Y Avg | 10.8% |
Segment Financials
Revenue by Segment| $ Mil | 2025 | 2024 | 2023 | 2022 | 2021 |
|---|---|---|---|---|---|
| Single Segment | 673 | 608 | 525 | ||
| Copper contained in concentrate | 381 | 402 | |||
| Copper price adjustments on settlement | -5 | 8 | |||
| Molybdenum concentrate | 20 | 29 | |||
| Molybdenum price adjustments on settlement | 4 | 3 | |||
| Silver | 5 | 5 | |||
| Treatment and refining costs | -13 | -13 | |||
| Total | 673 | 608 | 525 | 392 | 433 |
Price Behavior
| Market Price | $7.36 | |
| Market Cap ($ Bil) | 2.7 | |
| First Trading Date | 06/02/1994 | |
| Distance from 52W High | -24.0% | |
| 50 Days | 200 Days | |
| DMA Price | $8.49 | $7.64 |
| DMA Trend | up | up |
| Distance from DMA | -13.3% | -3.6% |
| 3M | 1YR | |
| Volatility | 65.4% | 71.3% |
| Downside Capture | 161.77 | 281.51 |
| Upside Capture | 231.10 | 315.58 |
| Correlation (S&P 500) | 43.9% | 52.6% |
| 1M | 2M | 3M | 6M | 1Y | 3Y | |
|---|---|---|---|---|---|---|
| Beta | 1.60 | 2.34 | 2.91 | 3.20 | 2.73 | 1.87 |
| Up Beta | 4.28 | 4.48 | 4.18 | 2.63 | 2.28 | 1.47 |
| Down Beta | 9.01 | 6.58 | 4.67 | 4.38 | 2.59 | 2.00 |
| Up Capture | 45% | 212% | 299% | 476% | 1034% | 2926% |
| Bmk +ve Days | 6 | 16 | 27 | 66 | 132 | 424 |
| Stock +ve Days | 13 | 27 | 36 | 65 | 129 | 368 |
| Down Capture | 86% | -40% | 128% | 243% | 169% | 111% |
| Bmk -ve Days | 16 | 26 | 37 | 60 | 120 | 328 |
| Stock -ve Days | 9 | 15 | 28 | 61 | 119 | 346 |
[1] Upside and downside betas calculated using positive and negative benchmark daily returns respectively
Based On 1-Year Data
| Annualized Return | Annualized Volatility | Sharpe Ratio | Correlation with TGB | |
|---|---|---|---|---|
| TGB | 63.5% | 71.3% | 0.98 | - |
| Sector ETF (XLB) | 22.5% | 17.6% | 0.98 | 48.4% |
| Equity (SPY) | 10.9% | 12.8% | 0.52 | 53.0% |
| Gold (GLD) | -2.0% | 28.6% | -0.08 | 60.8% |
| Commodities (DBC) | 48.2% | 20.6% | 1.79 | 2.1% |
| Real Estate (VNQ) | 10.2% | 13.7% | 0.45 | 9.2% |
| Bitcoin (BTCUSD) | -30.3% | 43.5% | -0.71 | 32.4% |
Smart multi-asset allocation framework can stack odds in your favor. Learn How
Based On 5-Year Data
| Annualized Return | Annualized Volatility | Sharpe Ratio | Correlation with TGB | |
|---|---|---|---|---|
| TGB | 26.7% | 63.6% | 0.63 | - |
| Sector ETF (XLB) | 6.5% | 19.1% | 0.22 | 52.9% |
| Equity (SPY) | 12.2% | 17.1% | 0.53 | 46.1% |
| Gold (GLD) | 16.2% | 19.0% | 0.68 | 42.4% |
| Commodities (DBC) | 9.2% | 19.5% | 0.35 | 29.2% |
| Real Estate (VNQ) | 0.9% | 18.9% | -0.06 | 29.8% |
| Bitcoin (BTCUSD) | 4.8% | 51.6% | 0.28 | 26.1% |
Smart multi-asset allocation framework can stack odds in your favor. Learn How
Based On 10-Year Data
| Annualized Return | Annualized Volatility | Sharpe Ratio | Correlation with TGB | |
|---|---|---|---|---|
| TGB | 32.5% | 66.5% | 0.71 | - |
| Sector ETF (XLB) | 10.5% | 20.7% | 0.45 | 44.6% |
| Equity (SPY) | 15.2% | 17.9% | 0.72 | 37.8% |
| Gold (GLD) | 11.4% | 16.5% | 0.56 | 29.5% |
| Commodities (DBC) | 8.2% | 18.1% | 0.37 | 31.8% |
| Real Estate (VNQ) | 5.3% | 20.7% | 0.21 | 22.9% |
| Bitcoin (BTCUSD) | 61.7% | 66.2% | 1.01 | 16.0% |
Smart multi-asset allocation framework can stack odds in your favor. Learn How
Returns Analyses
Earnings Returns History
Updated 6/2/2026| Forward Returns | |||
|---|---|---|---|
| Earnings Date | 1D Returns | 5D Returns | 21D Returns |
| SUMMARY STATS | |||
| # Positive | 0 | 0 | 0 |
| # Negative | 0 | 0 | 0 |
| Median Positive | |||
| Median Negative | |||
| Max Positive | |||
| Max Negative | |||
| Forward Returns | |||
|---|---|---|---|
| Earnings Date | 1D Returns | 5D Returns | 21D Returns |
| SUMMARY STATS | |||
| # Positive | 0 | 0 | 0 |
| # Negative | 0 | 0 | 0 |
| Median Positive | |||
| Median Negative | |||
| Max Positive | |||
| Max Negative | |||
SEC Filings
Expand for More| Report Date | Filing Date | Filing |
|---|---|---|
| 03/31/2026 | 05/07/2026 | 6-K |
| 12/31/2025 | 03/31/2026 | 40-F |
| 09/30/2025 | 11/13/2025 | 6-K |
| 06/30/2025 | 08/07/2025 | 6-K |
| 03/31/2025 | 05/02/2025 | 6-K |
| 12/31/2024 | 03/28/2025 | 40-F |
| 09/30/2024 | 11/07/2024 | 6-K |
| 06/30/2024 | 08/01/2024 | 6-K |
| 03/31/2024 | 05/02/2024 | 6-K |
| 12/31/2023 | 03/28/2024 | 40-F |
| 09/30/2023 | 11/02/2023 | 6-K |
| 06/30/2023 | 08/02/2023 | 6-K |
| 03/31/2023 | 05/04/2023 | 6-K |
| 12/31/2022 | 03/31/2023 | 40-F |
| 09/30/2022 | 11/04/2022 | 6-K |
| 06/30/2022 | 08/09/2022 | 6-K |
| Report Date | Filing Date | Filing |
|---|---|---|
| 03/31/2026 | 05/07/2026 | 6-K |
| 12/31/2025 | 03/31/2026 | 40-F |
| 09/30/2025 | 11/13/2025 | 6-K |
| 06/30/2025 | 08/07/2025 | 6-K |
| 03/31/2025 | 05/02/2025 | 6-K |
| 12/31/2024 | 03/28/2025 | 40-F |
| 09/30/2024 | 11/07/2024 | 6-K |
| 06/30/2024 | 08/01/2024 | 6-K |
| 03/31/2024 | 05/02/2024 | 6-K |
| 12/31/2023 | 03/28/2024 | 40-F |
| 09/30/2023 | 11/02/2023 | 6-K |
| 06/30/2023 | 08/02/2023 | 6-K |
| 03/31/2023 | 05/04/2023 | 6-K |
| 12/31/2022 | 03/31/2023 | 40-F |
| 09/30/2022 | 11/04/2022 | 6-K |
| 06/30/2022 | 08/09/2022 | 6-K |
| 03/31/2022 | 05/05/2022 | 6-K |
| 12/31/2021 | 03/31/2022 | 40-F |
| 09/30/2021 | 11/03/2021 | 6-K |
| 06/30/2021 | 08/05/2021 | 6-K |
| 03/31/2021 | 05/06/2021 | 6-K |
| 12/31/2020 | 03/30/2021 | 40-F |
| 09/30/2020 | 10/26/2020 | 6-K |
| 06/30/2020 | 08/05/2020 | 6-K |
| 03/31/2020 | 04/29/2020 | 6-K |
| 12/31/2019 | 03/31/2020 | 40-F |
| 09/30/2019 | 11/06/2019 | 6-K |
| 06/30/2019 | 08/08/2019 | 6-K |
Investor Activity (13F)
Updated Oct 31, 2026Active managers (13F portfolio over $250M, at least 3 holdings) with a position over $5M that is either over 10% of their portfolio or held in a concentrated book of 50 or fewer total positions. Index/ETF, sovereign, bank, community-bank and charitable/donor-advised filers are excluded.
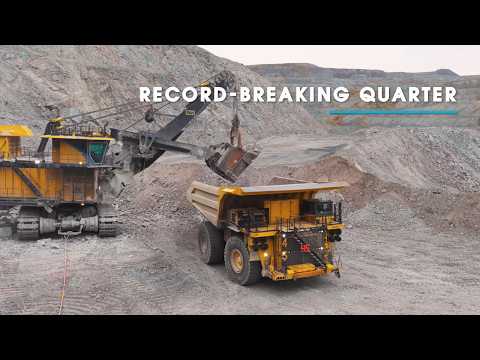
Trekor Metals — Investor Video Playlist



Industry Resources
| Materials Resources |
| Chemical & Engineering News (C&EN) |
| Mining.com |
| Plastics News |
| Copper Resources |
| International Copper Association |
| Copper Investing News |
| Kitco Copper |
External Quote Links
| Y Finance | Barrons |
| TradingView | Morningstar |
| SeekingAlpha | ValueLine |
| Motley Fool | Robinhood |
| CNBC | Etrade |
| MarketWatch | Unusual Whales |
| YCharts | Perplexity Finance |
| FinViz |
Prefer one of these to Trefis? Tell us why.