
Nutrien (NTR)
Market Price (10/21/2026): $69.01 | Market Cap: $33.1 BilSector: Materials | Industry: Fertilizers & Agricultural Chemicals
Nutrien (NTR)
Market Price (10/21/2026): $69.01Market Cap: $33.1 BilSector: MaterialsIndustry: Fertilizers & Agricultural Chemicals
Investment Highlights Why It Matters Detailed financial logic regarding cash flow yields vs trend-riding momentum.
Attractive yieldTotal YieldTotal Yield = Earnings Yield + Dividend Yield, Earnings Yield = Net Income / Market Cap Dividend Yield = Total Dividends / Market Cap is 10%, Dividend Yield is 3.2%, ERPEquity Risk Premium (ERP) = Total Yield - Risk Free Rate, Reflects the premium above risk free assets offered by the investment. is 6.4%, FCF Yield is 6.3% Attractive cash flow generationCFO/Rev LTMCash Flow from Operations / Revenue (Sales), Last Twelve Months (LTM) is 15%, CFO LTM is 4.2 Bil, FCF LTM is 2.1 Bil Stock buyback supportStock Buyback 3Y Total is 1.1 Bil Low stock price volatilityVol 12M is 33% Megatrend and thematic driversMegatrends include Sustainable Resource Management, Hydrogen Economy, and Energy Transition & Decarbonization. Themes include Resource Efficiency Solutions, Show more. | Weak multi-year price returns3Y Excs Rtn is -49% | Weak revenue growthRev Chg 3Y AvgRevenue Change % averaged over trailing 3 years is -4.8% Key risksNTR key risks include [1] potential financial distress indicated by its Altman Z-Score and considerable debt levels, Show more. |
| Attractive yieldTotal YieldTotal Yield = Earnings Yield + Dividend Yield, Earnings Yield = Net Income / Market Cap Dividend Yield = Total Dividends / Market Cap is 10%, Dividend Yield is 3.2%, ERPEquity Risk Premium (ERP) = Total Yield - Risk Free Rate, Reflects the premium above risk free assets offered by the investment. is 6.4%, FCF Yield is 6.3% |
| Attractive cash flow generationCFO/Rev LTMCash Flow from Operations / Revenue (Sales), Last Twelve Months (LTM) is 15%, CFO LTM is 4.2 Bil, FCF LTM is 2.1 Bil |
| Stock buyback supportStock Buyback 3Y Total is 1.1 Bil |
| Low stock price volatilityVol 12M is 33% |
| Megatrend and thematic driversMegatrends include Sustainable Resource Management, Hydrogen Economy, and Energy Transition & Decarbonization. Themes include Resource Efficiency Solutions, Show more. |
| Weak multi-year price returns3Y Excs Rtn is -49% |
| Weak revenue growthRev Chg 3Y AvgRevenue Change % averaged over trailing 3 years is -4.8% |
| Key risksNTR key risks include [1] potential financial distress indicated by its Altman Z-Score and considerable debt levels, Show more. |
Qualitative Assessment
AI Analysis | Feedback
Nutrien (NTR) stock has gained about 10% since 6/30/2026 because of the following key factors:
1. Favorable Fertilizer Market Conditions and Increasing Commodity Prices.
Global urea prices strengthened during fiscal Q3 2026, while potash markets remained constructive due to favorable affordability and stable supply. The broader fertilizer market experienced price increases in fiscal Q3 2026, influenced by geopolitical factors such as Russia's sulfur export ban and Kazakhstan's suspension of sulfur exports, which contributed to an estimated global sulfur supply-demand gap of 6.5 to 9 million tons. In the U.S., fertilizer prices continued to rise in September 2026, with anhydrous ammonia increasing 25% year-over-year to $977 per ton, urea rising 9% to $675 per ton, and potash gaining 2% to $498 per ton. Nutrien projects the global nitrogen market to remain tight through the second half of fiscal 2026, driven by trade disruptions, production outages, elevated energy costs, and strong import demand from India and Brazil.
2. Record Potash Sales Volumes and Upgraded Guidance.
Nutrien reported record potash sales volumes of 3.9 million tonnes in fiscal Q2 2026. This contributed to first-half fiscal 2026 potash sales volumes reaching an all-time high of 7.45 million tons. Consequently, the company raised its full-year fiscal 2026 potash sales volume guidance to a range of 14.2 to 14.8 million tons. This positive operational performance and outlook fueled investor optimism regarding the stock.
Show more
Nutrien (NTR) stock has gained about 10% since 6/30/2026 because of the following key factors:
1. Favorable Fertilizer Market Conditions and Increasing Commodity Prices.
Global urea prices strengthened during fiscal Q3 2026, while potash markets remained constructive due to favorable affordability and stable supply. The broader fertilizer market experienced price increases in fiscal Q3 2026, influenced by geopolitical factors such as Russia's sulfur export ban and Kazakhstan's suspension of sulfur exports, which contributed to an estimated global sulfur supply-demand gap of 6.5 to 9 million tons. In the U.S., fertilizer prices continued to rise in September 2026, with anhydrous ammonia increasing 25% year-over-year to $977 per ton, urea rising 9% to $675 per ton, and potash gaining 2% to $498 per ton. Nutrien projects the global nitrogen market to remain tight through the second half of fiscal 2026, driven by trade disruptions, production outages, elevated energy costs, and strong import demand from India and Brazil.
2. Record Potash Sales Volumes and Upgraded Guidance.
Nutrien reported record potash sales volumes of 3.9 million tonnes in fiscal Q2 2026. This contributed to first-half fiscal 2026 potash sales volumes reaching an all-time high of 7.45 million tons. Consequently, the company raised its full-year fiscal 2026 potash sales volume guidance to a range of 14.2 to 14.8 million tons. This positive operational performance and outlook fueled investor optimism regarding the stock.
3. Robust Retail Segment Performance Driven by Proprietary Products.
The company's Retail segment demonstrated strong performance, with adjusted EBITDA reaching $1.24 billion in the first half of fiscal 2026. This growth was largely attributable to an 18% year-over-year increase in proprietary-product gross margin, which amounted to $843 million in the first half of fiscal 2026. Management maintained its fiscal 2026 Retail adjusted EBITDA guidance at $1.75 billion to $1.95 billion, anticipating high-single-digit growth in proprietary-product gross margins.
4. Optimized Capital Allocation and Increased Shareholder Returns.
Nutrien demonstrated financial prudence by lowering its fiscal 2026 capital spending guidance to $1.95-$2.05 billion, down from an earlier projection of $2-$2.1 billion, reflecting enhanced capital efficiency. The company accelerated its share repurchase program in fiscal Q3 2026, repurchasing approximately $82 million of common shares as of August 4, 2026. Overall, Nutrien returned $848 million to shareholders in the first half of fiscal 2026 through a combination of dividends and a 26% increase in share repurchases.
Show less
Stock Movement Drivers
Fundamental Drivers
The 10.5% change in NTR stock from 6/30/2026 to 10/20/2026 was primarily driven by a 10.4% change in the company's P/E Multiple.| (LTM values as of) | 6302026 | 10202026 | Change |
|---|---|---|---|
| Stock Price ($) | 62.47 | 69.03 | 10.5% |
| Change Contribution By: | |||
| Total Revenues ($ Mil) | 27,831 | 28,205 | 1.3% |
| Net Income Margin (%) | 8.6% | 8.4% | -1.6% |
| P/E Multiple | 12.6 | 13.9 | 10.4% |
| Shares Outstanding (Mil) | 481 | 480 | 0.3% |
| Cumulative Contribution | 10.5% |
Market Drivers
6/30/2026 to 10/20/2026| Return | Correlation | |
|---|---|---|
| NTR | 10.5% | |
| Market (SPY) | 3.0% | -28.5% |
| Sector (XLB) | 0.8% | 21.4% |
Fundamental Drivers
The -7.0% change in NTR stock from 3/31/2026 to 10/20/2026 was primarily driven by a -12.0% change in the company's P/E Multiple.| (LTM values as of) | 3312026 | 10202026 | Change |
|---|---|---|---|
| Stock Price ($) | 74.21 | 69.03 | -7.0% |
| Change Contribution By: | |||
| Total Revenues ($ Mil) | 26,885 | 28,205 | 4.9% |
| Net Income Margin (%) | 8.4% | 8.4% | 0.1% |
| P/E Multiple | 15.8 | 13.9 | -12.0% |
| Shares Outstanding (Mil) | 483 | 480 | 0.7% |
| Cumulative Contribution | -7.0% |
Market Drivers
3/31/2026 to 10/20/2026| Return | Correlation | |
|---|---|---|
| NTR | -7.0% | |
| Market (SPY) | 18.6% | -16.5% |
| Sector (XLB) | 2.9% | 16.6% |
Fundamental Drivers
The 21.5% change in NTR stock from 9/30/2025 to 10/20/2026 was primarily driven by a 60.7% change in the company's Net Income Margin (%).| (LTM values as of) | 9302025 | 10202026 | Change |
|---|---|---|---|
| Stock Price ($) | 56.82 | 69.03 | 21.5% |
| Change Contribution By: | |||
| Total Revenues ($ Mil) | 25,965 | 28,205 | 8.6% |
| Net Income Margin (%) | 5.2% | 8.4% | 60.7% |
| P/E Multiple | 20.3 | 13.9 | -31.5% |
| Shares Outstanding (Mil) | 487 | 480 | 1.6% |
| Cumulative Contribution | 21.5% |
Market Drivers
9/30/2025 to 10/20/2026| Return | Correlation | |
|---|---|---|
| NTR | 21.5% | |
| Market (SPY) | 16.4% | -5.3% |
| Sector (XLB) | 15.9% | 29.1% |
Fundamental Drivers
The 25.5% change in NTR stock from 9/30/2023 to 10/20/2026 was primarily driven by a 88.9% change in the company's P/E Multiple.| (LTM values as of) | 9302023 | 10202026 | Change |
|---|---|---|---|
| Stock Price ($) | 55.01 | 69.03 | 25.5% |
| Change Contribution By: | |||
| Total Revenues ($ Mil) | 33,482 | 28,205 | -15.8% |
| Net Income Margin (%) | 11.1% | 8.4% | -23.6% |
| P/E Multiple | 7.4 | 13.9 | 88.9% |
| Shares Outstanding (Mil) | 495 | 480 | 3.3% |
| Cumulative Contribution | 25.5% |
Market Drivers
9/30/2023 to 10/20/2026| Return | Correlation | |
|---|---|---|
| NTR | 25.5% | |
| Market (SPY) | 86.1% | 16.8% |
| Sector (XLB) | 37.5% | 37.8% |
Price Returns Compared
| 2021 | 2022 | 2023 | 2024 | 2025 | 2026 | Total [1] | |
|---|---|---|---|---|---|---|---|
| Returns | |||||||
| NTR Return | 62% | -1% | -20% | -17% | 43% | 15% | 76% |
| Peers Return | 32% | 2% | -10% | -2% | -13% | -23% | -20% |
| S&P 500 Return | 27% | -19% | 24% | 23% | 16% | 12% | 104% |
Monthly Win Rates [3] | |||||||
| NTR Win Rate | 75% | 42% | 33% | 42% | 67% | 60% | |
| Peers Win Rate | 57% | 55% | 43% | 50% | 45% | 50% | |
| S&P 500 Win Rate | 75% | 42% | 67% | 75% | 67% | 50% | |
Max Drawdowns [4] | |||||||
| NTR Max Drawdown | -11% | -37% | -37% | -25% | -13% | -28% | |
| Peers Max Drawdown | -27% | -39% | -44% | -24% | -40% | -52% | |
| S&P 500 Max Drawdown | -5% | -25% | -10% | -8% | -19% | -9% | |
[1] Cumulative total returns since the beginning of 2021
[2] Peers: CF, FMC, CTVA, MOS, SMG.
[3] Win Rate = % of calendar months in which monthly returns were positive
[4] Max drawdown represents maximum peak-to-trough decline within a year
[5] 2026 data is for the year up to 10/20/2026 (YTD)
How Low Can It Go
| Event | NTR | S&P 500 |
|---|---|---|
| Summer-Fall 2023 Five Percent Yield Shock | ||
| % Loss | -20.6% | -9.5% |
| % Gain to Breakeven | 25.9% | 10.5% |
| Time to Breakeven | 549 days | 24 days |
| 2023 SVB Regional Banking Crisis | ||
| % Loss | -32.5% | -6.7% |
| % Gain to Breakeven | 48.1% | 7.1% |
| Time to Breakeven | 968 days | 31 days |
| 2020 COVID-19 Crash | ||
| % Loss | -40.2% | -33.7% |
| % Gain to Breakeven | 67.3% | 50.9% |
| Time to Breakeven | 184 days | 140 days |
| Q4 2018 Fed Policy Error / Growth Scare | ||
| % Loss | -23.9% | -19.2% |
| % Gain to Breakeven | 31.5% | 23.8% |
| Time to Breakeven | 750 days | 105 days |
In The Past
Nutrien's stock fell -9.6% during the 2025 US Tariff Shock. Such a loss loss requires a 10.7% gain to breakeven.
Preserve Wealth
Limiting losses and compounding gains is essential to preserving wealth.
Asset Allocation
Actively managed asset allocation strategies protect wealth. Learn more.
About Nutrien (NTR)
Nutrien Ltd. is a leading global provider of essential crop inputs and services, playing a crucial role in supporting agricultural productivity worldwide. The company's primary mission is to supply farmers with the critical resources and expertise needed for successful crop cultivation, ultimately ensuring healthy growth and optimal yields.
Nutrien's comprehensive product and service portfolio includes the production and distribution of vital crop nutrients such as potash, nitrogen, phosphate, and sulfate products. Beyond fertilizers, it offers a broad range of agricultural necessities, including crop protection products, seeds, and various merchandise. The company also provides financial solutions and direct services to growers through its extensive network of approximately 2,000 retail locations and farm centers across the United States, Canada, South America, and Australia, serving as a full-service partner for farmers in these key agricultural markets.
AI Analysis | Feedback
Here are 1-3 brief analogies for Nutrien (NTR):
- The Home Depot for agriculture.
- The Amazon of farm supplies.
AI Analysis | Feedback
Major Products and Services of Nutrien (NTR)
- Potash products: Fertilizers rich in potassium essential for plant growth.
- Nitrogen products: Fertilizers containing nitrogen, a key nutrient for crop development.
- Phosphate products: Fertilizers supplying phosphorus, important for root development and flowering.
- Sulfate products: Fertilizers providing sulfur, crucial for protein synthesis and enzyme functions in plants.
- Crop protection products: Products such as herbicides, insecticides, and fungicides designed to protect crops.
- Seeds: A variety of agricultural seeds for planting diverse crops.
- Merchandise products: General agricultural supplies and goods sold through retail channels.
- Financial solutions: Services providing financing and other monetary support to growers.
- Retail distribution of agricultural inputs: The service of distributing crop nutrients, crop protection products, seeds, and merchandise through a network of farm centers directly to growers.
AI Analysis | Feedback
Nutrien (NTR) primarily sells its crop inputs, services, and products directly to individual farmers and farming businesses (referred to as "growers") through its extensive network of approximately 2,000 retail locations and farm centers.
The major customer categories served by Nutrien are:
- Farmers/Growers in North America
- Farmers/Growers in South America
- Farmers/Growers in Australia
AI Analysis | Feedback
AI Analysis | Feedback
Ken Seitz, President and Chief Executive Officer
Ken Seitz was appointed President and Chief Executive Officer of Nutrien in August 2022, after serving as interim CEO since January 2022. He joined Nutrien in 2019 as Executive Vice President and CEO of Potash. Mr. Seitz brings over 25 years of global management experience in the agriculture and mining sectors, spanning more than 60 countries. Prior to joining Nutrien, he was the President and CEO of Canpotex, one of the world's largest suppliers of Potash. He holds a Bachelor of Science in Agriculture, a Bachelor of Engineering, and a Master of Business Administration from the University of Saskatchewan. He is also a Professional Engineer and a Professional Agrologist.
Mark Thompson, Executive Vice President and Chief Financial Officer
Mark Thompson assumed the role of Executive Vice President and Chief Financial Officer on August 26, 2024. He has been with Nutrien since 2011, working across all of the company's businesses. Mr. Thompson has held numerous executive and senior leadership positions within Nutrien, including Executive Vice President and Chief Commercial Officer, Executive Vice President and Chief Strategy & Sustainability Officer, Executive Vice President and Chief Corporate Development & Strategy Officer, and Vice President of Business Development for Nutrien's Retail business. He holds Chartered Financial Analyst (CFA) and Chartered Alternative Investment Analyst (CAIA) designations, and the SASB Fundamentals of Sustainability Accounting (FSA) credential. Mr. Thompson earned Bachelor's degrees in Commerce (Finance) and Arts (Sociology) from the University of Saskatchewan. He is also a member of the Board of Directors at Canpotex Ltd. and the Finance Committee for the International Fertilizer Association (IFA).
Noralee Bradley, Executive Vice President, External Affairs, Chief Legal Officer and Corporate Secretary
Noralee Bradley serves as Nutrien's Executive Vice President, External Affairs, Chief Legal Officer and Corporate Secretary. She joined Nutrien in 2019, bringing extensive experience in legal, corporate governance, and external affairs. Prior to Nutrien, she held various senior legal roles, including General Counsel and Corporate Secretary at Agrium Inc., one of Nutrien's predecessor companies. Her background includes advising public companies on a wide range of legal and strategic matters.
Andy Kelemen, Executive Vice President, Corporate Development and Chief Strategy Officer
Andy Kelemen is the Executive Vice President, Corporate Development and Chief Strategy Officer at Nutrien. He previously served as Senior Vice President of Corporate Development at Agrium Inc. before the merger that formed Nutrien. His career includes significant experience in mergers and acquisitions, business development, and strategic planning within the agriculture and chemical industries.
Sarah Walters, Executive Vice President, IT and Chief People Officer
Sarah Walters joined Nutrien in 2024 as Executive Vice President, IT and Chief People Officer. In this role, she is responsible for advancing the company's people, culture, information technology, and AI capabilities. Before joining Nutrien, Ms. Walters was the Senior Vice President of HR & Shared Services at KCA Deutag, an international oil and gas services company. She has over 20 years of experience in the energy sector in North America, including serving as Executive Vice-President, Corporate Services at Cenovus Energy from 2017 to 2022, where she played a key role in the successful integration of the Husky Energy merger. Ms. Walters also held senior HR leadership roles at Talisman Energy and ConocoPhillips and began her HR career at British Rail.
AI Analysis | Feedback
Key Risks to Nutrien's Business
- Fluctuating Commodity Prices: Nutrien's profitability and financial performance are significantly exposed to the volatility of global commodity prices for key products like potash, nitrogen, and phosphate. Fertilizer prices experienced a decline in 2023 and 2024, which impacted profitability. The fertilizer market is cyclical, meaning margins fluctuate with these prices, posing a constant threat to the company's financial health.
- Antitrust Investigation: The U.S. Department of Justice is currently investigating major fertilizer producers, including Nutrien, over potential coordinated pricing practices in the U.S. nitrogen market. This early-stage probe introduces additional legal, regulatory, and reputational risks for the company.
- Geopolitical Tensions and Supply Chain Disruptions: Nutrien faces risks stemming from geopolitical tensions and high production costs that impact global supply chains. Export challenges, particularly from major fertilizer-producing nations like Russia and Belarus, have materially affected global supplies and trade flows, contributing to market volatility.
AI Analysis | Feedback
The widespread emergence and adoption of advanced biological solutions that enhance nutrient uptake and fixation in crops, particularly microbial inoculants for nitrogen fixation, pose a clear emerging threat. These solutions offer alternatives to traditional synthetic fertilizers, potentially reducing the overall demand for the bulk fertilizer products that constitute a significant portion of Nutrien's business. Ag-biotech companies are actively developing and commercializing these products, demonstrating their viability and increasing efficacy.
AI Analysis | Feedback
Nutrien (NTR) operates in several significant addressable markets for its main products and services:
- Potash: The global potash market size was estimated at USD 62.37 billion in 2024 and USD 66.11 billion in 2025. It is projected to increase to approximately USD 106.09 billion by 2035.
- Nitrogen Fertilizers: The global nitrogenous fertilizer market size was valued at approximately USD 128.06 billion in 2024 and is anticipated to reach around USD 223.35 billion by 2034. In 2024, the Asia Pacific nitrogenous fertilizer market size surpassed USD 86.21 billion. The U.S. Nitrogenous Fertilizer Market is projected to hit USD 14.90 billion by 2035.
- Phosphate Fertilizers: The global phosphate fertilizer market size was estimated at USD 71.61 billion in 2025 and is projected to reach USD 176.06 billion by 2040. The Asia Pacific region dominated the phosphate fertilizer market with a 61.3% revenue share in 2025.
-
Sulfate Products:
- Global Sulfur Fertilizer Market: This market generated a revenue of USD 4.74 billion in 2023 and is expected to reach USD 5.44 billion by 2030. North America accounted for 26.8% of the global sulfur fertilizer market revenue in 2023.
- Global Ammonium Sulfate Market: This market was approximately USD 3.4 billion in 2024 and is expected to reach around USD 6.6 billion by 2034. The Asia Pacific (APAC) region held a dominant share of 39.40% (approximately USD 1.3 billion) in 2024, and Europe held around 25% in 2024.
- Global Potassium Sulfate Market: This market is valued at USD 5.7 billion in 2026 and is projected to reach USD 9.2 billion by 2036.
- Crop Protection Products: The global crop protection products market size was valued at USD 83.86 billion in 2024 and USD 67.18 billion in 2025. It is expected to reach USD 121.47 billion by 2032. North America dominated this market with a 38.5% revenue share in 2024. The U.S. market is projected to reach USD 11.14 billion by 2032. Asia Pacific held a 29.20% market share in 2025. Latin America dominated the global market, accounting for a 32.0% value share in 2025.
- Seeds: The global commercial seeds market size was valued at USD 85.42 billion in 2024 and is projected to reach USD 138.32 billion by 2030. North America accounted for the largest global revenue share of 33.5% in 2024.
AI Analysis | Feedback
Here are 3-5 expected drivers of future revenue growth for Nutrien (NTR) over the next 2-3 years:
- Strong Potash Market Fundamentals and Increased Sales Volumes: Nutrien anticipates continued robust demand for potash, projecting global potash shipments to grow for the fourth consecutive year in 2026. This growth is supported by favorable affordability, the need for nutrient replenishment, and low inventory levels in key markets. Nutrien is targeting potash sales volume growth of approximately 2.0 to 3.0 million tonnes by 2026, compared to 2023 levels.
- Higher Retail Earnings and Proprietary Products Growth: The company is focused on increasing its retail earnings, with a 2026 Retail adjusted EBITDA guidance of $1.75 to $1.95 billion. A significant contributor to this growth is the expected high-single digit growth in proprietary products gross margins. Additionally, Nutrien is optimizing its downstream retail network through modernization and consolidation in North America and a targeted margin improvement plan in Brazil, including the development of digital fulfillment hubs to enhance proprietary product sales.
- Improved Nitrogen Margin Profile and Capacity Expansion: Nutrien expects an improved nitrogen margin profile to be a key driver of growth. The company's Geismar clean ammonia project is progressing, which will add significant nitrogen capacity and serve both traditional fertilizer markets and the emerging low-carbon fuel sector, diversifying revenue streams.
- Strategic Retail Expansion and Acquisitions in Key Markets: Nutrien plans targeted bolt-on retail acquisitions in North America and Australia to expand its service footprint and market penetration. In South America, specifically Brazil, the company is integrating recent acquisitions under a unified retail brand to capture a larger market share in the top global soybean and corn regions.
- Operational Efficiencies and Cost Reduction Initiatives: Nutrien has demonstrated a strong focus on operational improvements and cost management. In 2025, the company surpassed its annual cost savings target of $200 million and reduced capital expenditures. Continued emphasis on maintaining a low-cost position, enhancing reliability in upstream production through automation in potash operations, and implementing energy efficiency programs in nitrogen are expected to contribute to improved earnings and revenue growth.
AI Analysis | Feedback
Share Repurchases
- In 2025, Nutrien repurchased approximately 2% of its outstanding shares, totaling $551 million.
- For 2026, Nutrien's Board of Directors approved a normal course issuer bid (NCIB) to repurchase up to 5% of its outstanding common shares over a twelve-month period, which commenced on March 3, 2026.
- Nutrien repurchased 53 million shares in 2022 and an additional 8 million shares in early 2023, completing its normal course issuer bid. Under a prior program, Nutrien repurchased 8,708,901 common shares for $510,031,461 through February 17, 2026.
Outbound Investments
- Nutrien completed the sale of its 50% equity position in Argentina-based nitrogen producer Profertil S.A. for approximately $600 million in 2025.
- Since the fourth quarter of 2024, Nutrien has generated approximately $900 million in gross proceeds from asset sales, including equity interests in Profertil and Sinofert.
- In 2022, Nutrien expanded its Retail network by completing 21 acquisitions in Brazil, the US, and Australia, for a total investment of approximately $400 million.
Capital Expenditures
- Capital expenditures declined to $2,005 million in 2025, which was below its target range of $2.2 to $2.3 billion.
- For fiscal year 2026, Nutrien plans capital expenditures of $2.0 billion to $2.1 billion.
- Approximately $400 million of the 2026 capital expenditures are growth investments focused on proprietary products, network optimization, digital capabilities in Retail, low-cost brownfield expansions and product optimization projects in Nitrogen, and mine automation in Potash.
Peer Outperformance in Fertilizers & Agricultural Chemicals
| Ticker | Name | Rev Growth 3Y Avg | P/E | 1Y | 3Y | 5Y | 5Y Gap |
|---|---|---|---|---|---|---|---|
| NTR | Nutrien | -4.8% | 13.9x | 23.9% | 30.5% | 13.9% | — |
| CF | CF Industries | -1.0% | 8.6x | 43.4% | 52.2% | 116.8% | +103pp |
| Industry | Names | 1Y med | 3Y med | 5Y med | Top 3 by 5Y |
|---|---|---|---|---|---|
| Copper | 7 | 45.6% | 124.7% | 141.0% | SCCO 280% · TGB 249% · HBM 221% |
| Steel | 14 | 22.4% | 47.5% | 140.3% | STLD 304% · HCC 264% · RS 203% |
| Gold | 35 | -2.2% | 173.1% | 120.6% | IAG 517% · OGC 395% · KGC 311% |
| Silver | 6 | 21.7% | 260.7% | 108.6% | AYA 251% · HL 166% · SVM 128% |
| Aluminum | 3 | 5.5% | 164.4% | 60.4% | CENX 109% · KALU 60% · AA -18% |
| Construction Materials | 6 | -21.2% | 26.0% | 41.9% | USLM 359% · CRH 89% · VMC 47% |
| Metal, Glass & Plastic Containers | 11 | -4.1% | 7.0% | 4.8% | GEF 48% · SLGN 7% · ATR 5% |
| Paper & Plastic Packaging Products & Materials | 7 | 15.1% | 15.4% | -4.6% | PKG 104% · CCK 14% · SON 0% |
| Diversified Metals & Mining | 23 | -65.2% | -17.8% | -9.1% | USAR 33658% · MTRN 243% · MP 8% |
| Diversified Chemicals | 3 | 6.8% | 0.5% | -18.2% | CBT 52% · ASH -18% |
| Specialty Chemicals | 41 | 10.1% | 7.6% | -21.1% | NEU 159% · ESI 70% · SXT 56% |
| Commodity Chemicals | 13 | -1.1% | -25.5% | -34.8% | HWKN 259% · MEOH 44% · DOW -33% |
| Precious Metals & Minerals | 8 | -20.2% | 153.0% | -45.4% | PPTA 280% |
| Fertilizers & Agricultural Chemicals ← | 10 | -45.3% | -54.9% | -61.6% | CF 117% · NTR 14% · MOS -52% |
| Paper Products | 4 | -33.8% | -55.8% | -75.5% |
Latest Trefis Analyses
| Title | Date | |
|---|---|---|
| DASHBOARDS | ||
| CF Industries vs Nutrien: Which Is the Stronger Buy Today? | 03/17/2026 | |
| Can Nutrien Stock Hold Up When Markets Turn? | 10/17/2025 | |
| NTR Dip Buy Analysis | 07/10/2025 | |
| Nutrien (NTR) Valuation Ratios Comparison | 05/15/2025 | |
| Nutrien Total Shareholder Return (TSR): -12.4% in 2024 and -8.6% 3-yr compounded annual returns (below peer average) | 03/07/2025 | |
| Should You Buy Nutrien Stock? | 02/28/2025 | |
| Nutrien (NTR) Operating Cash Flow Comparison | 02/17/2025 | |
| Nutrien (NTR) Net Income Comparison | 02/16/2025 | |
| Nutrien (NTR) Operating Income Comparison | 02/15/2025 | |
| Nutrien (NTR) Revenue Comparison | 02/13/2025 | |
| ARTICLES | ||
| A 7-Day Winning Streak Has Nutrien Stock Up 12% | 08/22/2026 | |
| Between CF Industries and Nutrien, Which Stock Looks Set to Break Out? | 03/17/2026 | |
| Mid Cap Stocks Trading At 52-Week High | 02/28/2026 | |
| Is CF Industries a Better Buy Than Nutrien? | 01/16/2026 | |
| Nutrien vs CF Industries: Which Stock Could Rally? | 11/12/2025 |
Research & Analysis
Invest in Strategies
Wealth Management
Peer Comparisons
| Peers to compare with: |
Financials
| Median | |
|---|---|
| Name | |
| Mkt Price | 37.00 |
| Mkt Cap | 7.1 |
| Rev LTM | 9,993 |
| Op Inc LTM | 1,756 |
| FCF LTM | 446 |
| FCF 3Y Avg | 911 |
| CFO LTM | 828 |
| CFO 3Y Avg | 1,674 |
Growth & Margins
| Median | |
|---|---|
| Name | |
| Rev Chg LTM | 6.6% |
| Rev Chg 3Y Avg | -3.2% |
| Rev Chg Q | -0.0% |
| QoQ Delta Rev Chg LTM | -0.0% |
| Op Inc Chg LTM | 18.6% |
| Op Inc Chg 3Y Avg | 0.6% |
| Op Mgn LTM | 14.1% |
| Op Mgn 3Y Avg | 12.5% |
| QoQ Delta Op Mgn LTM | -0.1% |
| CFO/Rev LTM | 8.7% |
| CFO/Rev 3Y Avg | 14.2% |
| FCF/Rev LTM | 5.5% |
| FCF/Rev 3Y Avg | 8.6% |
Segment Financials
Revenue by Segment| $ Mil | 2025 | 2024 | 2023 | 2022 | 2021 |
|---|---|---|---|---|---|
| Retail | 17,620 | 17,832 | 19,542 | 21,350 | 17,665 |
| Nitrogen | 4,739 | 4,307 | 4,735 | 8,048 | 4,216 |
| Potash | 3,995 | 3,378 | 4,166 | 8,199 | 4,021 |
| Phosphate | 1,958 | 1,888 | 2,263 | 2,620 | 1,810 |
| Corporate and Others | 246 | 22 | 0 | 0 | |
| Eliminations | -1,673 | -1,455 | -1,650 | -2,333 | |
| Total | 26,885 | 25,972 | 29,056 | 37,884 | 27,712 |
| $ Mil | 2022 | 2021 | 2020 | 2019 | 2002 |
|---|---|---|---|---|---|
| Potash | 5,326 | 2,239 | 715 | 1,203 | 216 |
| Nitrogen | 3,373 | 1,729 | 700 | 704 | 47 |
| Retail | 1,558 | 1,222 | 762 | 636 | |
| Phosphate | 1,186 | 385 | -755 | -43 | 39 |
| Eliminations | -19 | -89 | 21 | 5 | |
| Corporate and Others | -615 | -705 | -541 | -643 | |
| Total | 10,809 | 4,781 | 902 | 1,862 | 302 |
| $ Mil | 2024 | 2023 | 2022 | 2021 | 2020 |
|---|---|---|---|---|---|
| Retail | 22,149 | 23,056 | 24,451 | 22,387 | 20,526 |
| Potash | 13,792 | 13,571 | 13,921 | 13,148 | 12,032 |
| Nitrogen | 11,603 | 11,466 | 11,807 | 11,093 | 10,612 |
| Corporate and Others | 2,571 | 2,818 | 2,622 | 2,266 | 2,983 |
| Phosphate | 2,453 | 2,438 | 2,661 | 1,699 | 1,462 |
| Eliminations | -728 | -600 | -876 | -639 | -423 |
| Total | 51,840 | 52,749 | 54,586 | 49,954 | 47,192 |
Price Behavior
| Market Price | $69.03 | |
| Market Cap ($ Bil) | 33.1 | |
| First Trading Date | 01/02/2018 | |
| Distance from 52W High | -15.8% | |
| 50 Days | 200 Days | |
| DMA Price | $72.73 | $69.75 |
| DMA Trend | up | up |
| Distance from DMA | -5.1% | -1.0% |
| 3M | 1YR | |
| Volatility | 29.7% | 33.0% |
| Downside Capture | -101.38 | -41.57 |
| Upside Capture | -62.10 | -4.99 |
| Correlation (S&P 500) | -25.8% | -8.0% |
| 1M | 2M | 3M | 6M | 1Y | 3Y | |
|---|---|---|---|---|---|---|
| Beta | -0.31 | -0.72 | -0.75 | -0.38 | -0.11 | 0.34 |
| Up Beta | -2.83 | -1.29 | -1.09 | -1.37 | -1.01 | 0.23 |
| Down Beta | -1.34 | -1.42 | -0.63 | 0.48 | 0.55 | 0.53 |
| Up Capture | -12% | -33% | -32% | -19% | 7% | 10% |
| Bmk +ve Days | 6 | 16 | 27 | 66 | 132 | 424 |
| Stock +ve Days | 9 | 21 | 35 | 66 | 137 | 388 |
| Down Capture | 49% | -75% | -134% | -26% | -28% | 54% |
| Bmk -ve Days | 16 | 26 | 37 | 60 | 120 | 328 |
| Stock -ve Days | 13 | 20 | 28 | 59 | 113 | 358 |
[1] Upside and downside betas calculated using positive and negative benchmark daily returns respectively
Based On 1-Year Data
| Annualized Return | Annualized Volatility | Sharpe Ratio | Correlation with NTR | |
|---|---|---|---|---|
| NTR | 24.3% | 33.0% | 0.69 | - |
| Sector ETF (XLB) | 18.2% | 17.8% | 0.78 | 28.8% |
| Equity (SPY) | 16.8% | 12.7% | 0.93 | -7.9% |
| Gold (GLD) | -2.9% | 29.3% | -0.10 | 21.6% |
| Commodities (DBC) | 52.5% | 20.7% | 1.93 | 49.2% |
| Real Estate (VNQ) | 5.1% | 13.8% | 0.11 | -1.8% |
| Bitcoin (BTCUSD) | -23.7% | 43.6% | -0.50 | 6.7% |
Smart multi-asset allocation framework can stack odds in your favor. Learn How
Based On 5-Year Data
| Annualized Return | Annualized Volatility | Sharpe Ratio | Correlation with NTR | |
|---|---|---|---|---|
| NTR | 3.0% | 34.1% | 0.15 | - |
| Sector ETF (XLB) | 6.7% | 19.1% | 0.24 | 43.4% |
| Equity (SPY) | 13.6% | 17.1% | 0.61 | 27.6% |
| Gold (GLD) | 18.1% | 18.9% | 0.77 | 18.7% |
| Commodities (DBC) | 9.7% | 19.5% | 0.38 | 38.8% |
| Real Estate (VNQ) | 1.4% | 18.9% | -0.03 | 27.0% |
| Bitcoin (BTCUSD) | 7.7% | 51.7% | 0.33 | 12.9% |
Smart multi-asset allocation framework can stack odds in your favor. Learn How
Based On 10-Year Data
| Annualized Return | Annualized Volatility | Sharpe Ratio | Correlation with NTR | |
|---|---|---|---|---|
| NTR | 5.6% | 33.8% | 0.27 | - |
| Sector ETF (XLB) | 10.2% | 20.7% | 0.43 | 56.1% |
| Equity (SPY) | 15.3% | 17.9% | 0.72 | 43.6% |
| Gold (GLD) | 12.1% | 16.4% | 0.60 | 12.1% |
| Commodities (DBC) | 8.2% | 18.1% | 0.37 | 41.4% |
| Real Estate (VNQ) | 5.2% | 20.7% | 0.21 | 37.9% |
| Bitcoin (BTCUSD) | 62.9% | 66.2% | 1.03 | 14.7% |
Smart multi-asset allocation framework can stack odds in your favor. Learn How
Returns Analyses
Earnings Returns History
Updated 6/2/2026| Forward Returns | |||
|---|---|---|---|
| Earnings Date | 1D Returns | 5D Returns | 21D Returns |
| SUMMARY STATS | |||
| # Positive | 0 | 0 | 0 |
| # Negative | 0 | 0 | 0 |
| Median Positive | |||
| Median Negative | |||
| Max Positive | |||
| Max Negative | |||
| Forward Returns | |||
|---|---|---|---|
| Earnings Date | 1D Returns | 5D Returns | 21D Returns |
| SUMMARY STATS | |||
| # Positive | 0 | 0 | 0 |
| # Negative | 0 | 0 | 0 |
| Median Positive | |||
| Median Negative | |||
| Max Positive | |||
| Max Negative | |||
SEC Filings
Expand for More| Report Date | Filing Date | Filing |
|---|---|---|
| 06/30/2026 | 08/05/2026 | 6-K |
| 03/31/2026 | 05/07/2026 | 6-K |
| 12/31/2025 | 02/27/2026 | 40-F |
| 09/30/2025 | 11/06/2025 | 6-K |
| 06/30/2025 | 08/07/2025 | 6-K |
| 03/31/2025 | 05/08/2025 | 6-K |
| 12/31/2024 | 02/28/2025 | 40-F |
| 09/30/2024 | 11/07/2024 | 6-K |
| 06/30/2024 | 08/08/2024 | 6-K |
| 03/31/2024 | 05/09/2024 | 6-K |
| 12/31/2023 | 03/01/2024 | 40-F |
| 09/30/2023 | 11/01/2023 | 6-K |
| 06/30/2023 | 08/03/2023 | 6-K |
| 03/31/2023 | 05/11/2023 | 6-K |
| 12/31/2022 | 02/24/2023 | 40-F |
| 09/30/2022 | 11/03/2022 | 6-K |
| Report Date | Filing Date | Filing |
|---|---|---|
| 06/30/2026 | 08/05/2026 | 6-K |
| 03/31/2026 | 05/07/2026 | 6-K |
| 12/31/2025 | 02/27/2026 | 40-F |
| 09/30/2025 | 11/06/2025 | 6-K |
| 06/30/2025 | 08/07/2025 | 6-K |
| 03/31/2025 | 05/08/2025 | 6-K |
| 12/31/2024 | 02/28/2025 | 40-F |
| 09/30/2024 | 11/07/2024 | 6-K |
| 06/30/2024 | 08/08/2024 | 6-K |
| 03/31/2024 | 05/09/2024 | 6-K |
| 12/31/2023 | 03/01/2024 | 40-F |
| 09/30/2023 | 11/01/2023 | 6-K |
| 06/30/2023 | 08/03/2023 | 6-K |
| 03/31/2023 | 05/11/2023 | 6-K |
| 12/31/2022 | 02/24/2023 | 40-F |
| 09/30/2022 | 11/03/2022 | 6-K |
| 06/30/2022 | 08/04/2022 | 6-K |
| 03/31/2022 | 05/03/2022 | 6-K |
| 12/31/2021 | 02/25/2022 | 40-F |
| 09/30/2021 | 11/02/2021 | 6-K |
| 06/30/2021 | 08/10/2021 | 6-K |
| 03/31/2021 | 05/04/2021 | 6-K |
| 12/31/2020 | 02/26/2021 | 40-F |
| 09/30/2020 | 11/03/2020 | 6-K |
| 06/30/2020 | 08/11/2020 | 6-K |
| 03/31/2020 | 05/07/2020 | 6-K |
| 12/31/2019 | 02/28/2020 | 40-F |
| 09/30/2019 | 11/05/2019 | 6-K |
Investor Activity (13F)
Updated Oct 21, 2026Active managers (13F portfolio over $250M, at least 3 holdings) with a position over $5M that is either over 10% of their portfolio or held in a concentrated book of 50 or fewer total positions. Index/ETF, sovereign, bank, community-bank and charitable/donor-advised filers are excluded.
| Active Manager | Value | % of Portfolio | Total Positions | QoQ | Filing |
|---|---|---|---|---|---|
| Moerus Capital Management LLC | $45.2 Mil | 16.7% | 15 | ADD +15.3% | 13F |
| Kopernik Global Investors, LLC | $107.4 Mil | 7.5% | 27 | TRIM -18.8% | 13F |
| Drummond Knight Asset Management Pty Ltd | $20.7 Mil | 7.3% | 14 | New | 13F |
| Promethos Capital, LLC | $18.4 Mil | 5.0% | 46 | Hold | 13F |
| Colrain Capital LLC | $12.7 Mil | 4.9% | 26 | ADD +16.2% | 13F |
| Black Creek Investment Management Inc. | $65.3 Mil | 3.5% | 25 | TRIM -66.0% | 13F |
| Goehring & Rozencwajg Associates, LLC | $62.1 Mil | 3.3% | 43 | Hold | 13F |
| SailingStone Capital Partners LLC | $10.1 Mil | 2.3% | 17 | TRIM -21.9% | 13F |
| Scheer, Rowlett & Associates Investment Management Ltd. | $21.7 Mil | 1.6% | 33 | TRIM -37.2% | 13F |
| Albar Capital Partners LLP | $5.4 Mil | 0.9% | 36 | ADD +1483.0% | 13F |
| Contrarius Group Holdings Ltd | $7.1 Mil | 0.4% | 47 | New | 13F |
| Active Manager | Value | % of Portfolio | Total Positions | QoQ | Filing |
|---|---|---|---|---|---|
| Drummond Knight Asset Management Pty Ltd | $20.7 Mil | 7.3% | 14 | New | 13F |
| Contrarius Group Holdings Ltd | $7.1 Mil | 0.4% | 47 | New | 13F |
| Albar Capital Partners LLP | $5.4 Mil | 0.9% | 36 | ADD +1483.0% | 13F |
| Colrain Capital LLC | $12.7 Mil | 4.9% | 26 | ADD +16.2% | 13F |
| Moerus Capital Management LLC | $45.2 Mil | 16.7% | 15 | ADD +15.3% | 13F |
| Active Manager | Value | % of Portfolio | Total Positions | QoQ | Filing |
|---|---|---|---|---|---|
| Black Creek Investment Management Inc. | $65.3 Mil | 3.5% | 25 | TRIM -66.0% | 13F |
| Scheer, Rowlett & Associates Investment Management Ltd. | $21.7 Mil | 1.6% | 33 | TRIM -37.2% | 13F |
| SailingStone Capital Partners LLC | $10.1 Mil | 2.3% | 17 | TRIM -21.9% | 13F |
| Kopernik Global Investors, LLC | $107.4 Mil | 7.5% | 27 | TRIM -18.8% | 13F |
| Active Manager | Value | % of Portfolio | Total Positions | QoQ | Filing |
|---|---|---|---|---|---|
| Kopernik Global Investors, LLC | $107.4 Mil | 7.5% | 27 | TRIM -18.8% | 13F |
| Black Creek Investment Management Inc. | $65.3 Mil | 3.5% | 25 | TRIM -66.0% | 13F |
| Goehring & Rozencwajg Associates, LLC | $62.1 Mil | 3.3% | 43 | Hold | 13F |
| Moerus Capital Management LLC | $45.2 Mil | 16.7% | 15 | ADD +15.3% | 13F |
| Scheer, Rowlett & Associates Investment Management Ltd. | $21.7 Mil | 1.6% | 33 | TRIM -37.2% | 13F |
| Drummond Knight Asset Management Pty Ltd | $20.7 Mil | 7.3% | 14 | New | 13F |
| Promethos Capital, LLC | $18.4 Mil | 5.0% | 46 | Hold | 13F |
| Colrain Capital LLC | $12.7 Mil | 4.9% | 26 | ADD +16.2% | 13F |
| SailingStone Capital Partners LLC | $10.1 Mil | 2.3% | 17 | TRIM -21.9% | 13F |
| Contrarius Group Holdings Ltd | $7.1 Mil | 0.4% | 47 | New | 13F |
| Albar Capital Partners LLP | $5.4 Mil | 0.9% | 36 | ADD +1483.0% | 13F |
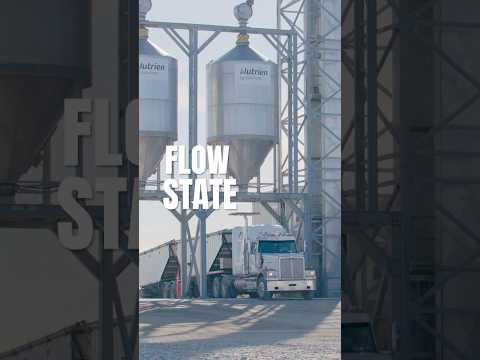
Nutrien — Investor Video Playlist





Industry Resources
| Materials Resources |
| Chemical & Engineering News (C&EN) |
| Mining.com |
| Plastics News |
| Fertilizers & Agricultural Chemicals Resources |
| World Fertilizer |
| Fertilizer Daily |
| Argus Media - Fertilizer |
External Quote Links
| Y Finance | Barrons |
| TradingView | Morningstar |
| SeekingAlpha | ValueLine |
| Motley Fool | Robinhood |
| CNBC | Etrade |
| MarketWatch | Unusual Whales |
| YCharts | Perplexity Finance |
| FinViz |
Prefer one of these to Trefis? Tell us why.