
Wheaton Precious Metals (WPM)
Market Price (11/11/2026): $137.29 | Market Cap: $62.4 BilSector: Materials | Industry: Gold
Wheaton Precious Metals (WPM)
Market Price (11/11/2026): $137.29Market Cap: $62.4 BilSector: MaterialsIndustry: Gold
Investment Highlights Why It Matters Detailed financial logic regarding cash flow yields vs trend-riding momentum.
Strong revenue growthRev Chg LTMRevenue Change % Last Twelve Months (LTM) is 89% Attractive operating marginsOp Mgn LTMOperating Margin = Operating Income / Revenue Reflects profitability before taxes and before impact of capital structure (interest payments). is 72% Attractive cash flow generationCFO/Rev LTMCash Flow from Operations / Revenue (Sales), Last Twelve Months (LTM) is 81%, CFO LTM is 2.8 Bil Megatrend and thematic driversMegatrends include Strategic Metals & Resource Finance. Themes include Precious Metals Streaming, and Critical Industrial Metals Supply. | Expensive valuation multiplesP/SPrice/Sales ratio is 18x, P/EBITPrice/EBIT or Price/(Operating Income) ratio is 25x Not cash flow generativeFCF/Rev LTMFree Cash Flow / Revenue (Sales), Last Twelve Months (LTM) is -72% Key risksWPM key risks include [1] its reliance on third-party mining partners, Show more. |
| Strong revenue growthRev Chg LTMRevenue Change % Last Twelve Months (LTM) is 89% |
| Attractive operating marginsOp Mgn LTMOperating Margin = Operating Income / Revenue Reflects profitability before taxes and before impact of capital structure (interest payments). is 72% |
| Attractive cash flow generationCFO/Rev LTMCash Flow from Operations / Revenue (Sales), Last Twelve Months (LTM) is 81%, CFO LTM is 2.8 Bil |
| Megatrend and thematic driversMegatrends include Strategic Metals & Resource Finance. Themes include Precious Metals Streaming, and Critical Industrial Metals Supply. |
| Expensive valuation multiplesP/SPrice/Sales ratio is 18x, P/EBITPrice/EBIT or Price/(Operating Income) ratio is 25x |
| Not cash flow generativeFCF/Rev LTMFree Cash Flow / Revenue (Sales), Last Twelve Months (LTM) is -72% |
| Key risksWPM key risks include [1] its reliance on third-party mining partners, Show more. |
Qualitative Assessment
AI Analysis | Feedback
Nov 10: down 5.1% in one day (S&P 500 down 0.4%)
The decline came without company news that explained the drop. The overall market also saw a slight decrease.
Up 23.5% from its Oct 30 low to Nov 9, down 5.1% since (S&P 500 down 0.4%)
The run was fueled by strong company performance in the third quarter and broader market optimism. Key drivers were the November 5 announcement of Q3 results and November 9 earnings call highlights.
Nov 10: down 5.1% in one day (S&P 500 down 0.4%)
The decline came without company news that explained the drop. The overall market also saw a slight decrease.
Up 23.5% from its Oct 30 low to Nov 9, down 5.1% since (S&P 500 down 0.4%)
The run was fueled by strong company performance in the third quarter and broader market optimism. Key drivers were the November 5 announcement of Q3 results and November 9 earnings call highlights.
Show less
Stock Movement Drivers
Fundamental Drivers
The 25.5% change in WPM stock from 7/31/2026 to 11/10/2026 was primarily driven by a 26.3% change in the company's Total Revenues ($ Mil).| (LTM values as of) | 7312026 | 11102026 | Change |
|---|---|---|---|
| Stock Price ($) | 108.89 | 136.62 | 25.5% |
| Change Contribution By: | |||
| Total Revenues ($ Mil) | 2,746 | 3,467 | 26.3% |
| Net Income Margin (%) | 65.6% | 60.4% | -7.9% |
| P/E Multiple | 27.5 | 29.6 | 7.9% |
| Shares Outstanding (Mil) | 454 | 454 | 0.0% |
| Cumulative Contribution | 25.5% |
Market Drivers
7/31/2026 to 11/10/2026| Return | Correlation | |
|---|---|---|
| WPM | 25.5% | |
| Market (SPY) | 0.4% | 45.3% |
| Sector (XLB) | 4.8% | 53.8% |
Fundamental Drivers
The 8.3% change in WPM stock from 4/30/2026 to 11/10/2026 was primarily driven by a 49.8% change in the company's Total Revenues ($ Mil).| (LTM values as of) | 4302026 | 11102026 | Change |
|---|---|---|---|
| Stock Price ($) | 126.10 | 136.62 | 8.3% |
| Change Contribution By: | |||
| Total Revenues ($ Mil) | 2,315 | 3,467 | 49.8% |
| Net Income Margin (%) | 63.6% | 60.4% | -5.0% |
| P/E Multiple | 38.9 | 29.6 | -23.8% |
| Shares Outstanding (Mil) | 454 | 454 | 0.0% |
| Cumulative Contribution | 8.3% |
Market Drivers
4/30/2026 to 11/10/2026| Return | Correlation | |
|---|---|---|
| WPM | 8.3% | |
| Market (SPY) | 4.6% | 53.1% |
| Sector (XLB) | 3.1% | 57.6% |
Fundamental Drivers
The 42.4% change in WPM stock from 10/31/2025 to 11/10/2026 was primarily driven by a 108.6% change in the company's Total Revenues ($ Mil).| (LTM values as of) | 10312025 | 11102026 | Change |
|---|---|---|---|
| Stock Price ($) | 95.94 | 136.62 | 42.4% |
| Change Contribution By: | |||
| Total Revenues ($ Mil) | 1,662 | 3,467 | 108.6% |
| Net Income Margin (%) | 47.5% | 60.4% | 27.2% |
| P/E Multiple | 55.2 | 29.6 | -46.3% |
| Shares Outstanding (Mil) | 454 | 454 | -0.1% |
| Cumulative Contribution | 42.4% |
Market Drivers
10/31/2025 to 11/10/2026| Return | Correlation | |
|---|---|---|
| WPM | 42.4% | |
| Market (SPY) | 10.9% | 48.9% |
| Sector (XLB) | 25.0% | 60.4% |
Fundamental Drivers
The 231.9% change in WPM stock from 10/31/2023 to 11/10/2026 was primarily driven by a 271.1% change in the company's Total Revenues ($ Mil).| (LTM values as of) | 10312023 | 11102026 | Change |
|---|---|---|---|
| Stock Price ($) | 41.17 | 136.62 | 231.9% |
| Change Contribution By: | |||
| Total Revenues ($ Mil) | 934 | 3,467 | 271.1% |
| Net Income Margin (%) | 65.9% | 60.4% | -8.3% |
| P/E Multiple | 30.3 | 29.6 | -2.2% |
| Shares Outstanding (Mil) | 453 | 454 | -0.3% |
| Cumulative Contribution | 231.9% |
Market Drivers
10/31/2023 to 11/10/2026| Return | Correlation | |
|---|---|---|
| WPM | 231.9% | |
| Market (SPY) | 85.5% | 31.1% |
| Sector (XLB) | 46.5% | 44.9% |
Price Returns Compared
| 2021 | 2022 | 2023 | 2024 | 2025 | 2026 | Total [1] | |
|---|---|---|---|---|---|---|---|
| Returns | |||||||
| WPM Return | 4% | -8% | 28% | 15% | 111% | 17% | 249% |
| Peers Return | 3% | 3% | 4% | 15% | 82% | 17% | 170% |
| S&P 500 Return | 27% | -19% | 24% | 23% | 16% | 10% | 101% |
Monthly Win Rates [3] | |||||||
| WPM Win Rate | 58% | 50% | 58% | 50% | 92% | 45% | |
| Peers Win Rate | 53% | 44% | 39% | 56% | 69% | 45% | |
| S&P 500 Win Rate | 75% | 42% | 67% | 75% | 67% | 36% | |
Max Drawdowns [4] | |||||||
| WPM Max Drawdown | -24% | -43% | -25% | -21% | -17% | -37% | |
| Peers Max Drawdown | -25% | -36% | -32% | -16% | -20% | -36% | |
| S&P 500 Max Drawdown | -5% | -25% | -10% | -8% | -19% | -9% | |
[1] Cumulative total returns since the beginning of 2021
[2] Peers: FNV, RGLD, OR. See WPM Returns vs. Peers.
[3] Win Rate = % of calendar months in which monthly returns were positive
[4] Max drawdown represents maximum peak-to-trough decline within a year
[5] 2026 data is for the year up to 11/10/2026 (YTD)
How Low Can It Go
| Event | WPM | S&P 500 |
|---|---|---|
| Summer-Fall 2023 Five Percent Yield Shock | ||
| % Loss | -14.6% | -9.5% |
| % Gain to Breakeven | 17.1% | 10.5% |
| Time to Breakeven | 43 days | 24 days |
| 2023 SVB Regional Banking Crisis | ||
| % Loss | -10.0% | -6.7% |
| % Gain to Breakeven | 11.1% | 7.1% |
| Time to Breakeven | 5 days | 31 days |
| 2022 Inflation Shock & Fed Tightening | ||
| % Loss | -29.7% | -24.5% |
| % Gain to Breakeven | 42.2% | 32.4% |
| Time to Breakeven | 100 days | 427 days |
| 2020 COVID-19 Crash | ||
| % Loss | -26.2% | -33.7% |
| % Gain to Breakeven | 35.6% | 50.9% |
| Time to Breakeven | 25 days | 140 days |
| 2016-2017 Trump Reflation Bond Selloff | ||
| % Loss | -38.6% | -3.7% |
| % Gain to Breakeven | 62.9% | 3.9% |
| Time to Breakeven | 945 days | 6 days |
| 2015-2016 China Devaluation / Global Growth Scare | ||
| % Loss | -24.1% | -12.2% |
| % Gain to Breakeven | 31.7% | 13.9% |
| Time to Breakeven | 17 days | 62 days |
In The Past
Wheaton Precious Metals's stock fell -2.0% during the 2025 US Tariff Shock. Such a loss loss requires a 2.1% gain to breakeven.
Preserve Wealth
Limiting losses and compounding gains is essential to preserving wealth.
Asset Allocation
Actively managed asset allocation strategies protect wealth. Learn more.
| Event | WPM | S&P 500 |
|---|---|---|
| 2022 Inflation Shock & Fed Tightening | ||
| % Loss | -29.7% | -24.5% |
| % Gain to Breakeven | 42.2% | 32.4% |
| Time to Breakeven | 100 days | 427 days |
| 2020 COVID-19 Crash | ||
| % Loss | -26.2% | -33.7% |
| % Gain to Breakeven | 35.6% | 50.9% |
| Time to Breakeven | 25 days | 140 days |
| 2016-2017 Trump Reflation Bond Selloff | ||
| % Loss | -38.6% | -3.7% |
| % Gain to Breakeven | 62.9% | 3.9% |
| Time to Breakeven | 945 days | 6 days |
| 2015-2016 China Devaluation / Global Growth Scare | ||
| % Loss | -24.1% | -12.2% |
| % Gain to Breakeven | 31.7% | 13.9% |
| Time to Breakeven | 17 days | 62 days |
| 2014-2016 Oil Price Collapse | ||
| % Loss | -57.4% | -6.8% |
| % Gain to Breakeven | 134.5% | 7.3% |
| Time to Breakeven | 164 days | 15 days |
| 2013 Taper Tantrum | ||
| % Loss | -26.2% | -0.2% |
| % Gain to Breakeven | 35.5% | 0.2% |
| Time to Breakeven | 47 days | 1 days |
| 2011 US Debt Ceiling Crisis & European Contagion | ||
| % Loss | -30.5% | -17.9% |
| % Gain to Breakeven | 43.8% | 21.8% |
| Time to Breakeven | 147 days | 123 days |
| 2008-2009 Global Financial Crisis | ||
| % Loss | -85.5% | -53.4% |
| % Gain to Breakeven | 587.9% | 114.4% |
| Time to Breakeven | 519 days | 1085 days |
| Summer 2007 Credit Crunch | ||
| % Loss | -25.2% | -8.6% |
| % Gain to Breakeven | 33.8% | 9.5% |
| Time to Breakeven | 43 days | 47 days |
In The Past
Wheaton Precious Metals's stock fell -2.0% during the 2025 US Tariff Shock. Such a loss loss requires a 2.1% gain to breakeven.
Preserve Wealth
Limiting losses and compounding gains is essential to preserving wealth.
Asset Allocation
Actively managed asset allocation strategies protect wealth. Learn more.
About Wheaton Precious Metals (WPM)
Wheaton Precious Metals Corp. (WPM) operates as a precious metals streaming company, a distinct business model within the mining sector. Rather than owning and operating mines directly, WPM provides upfront capital financing to mining companies. In exchange for this investment, WPM secures long-term contractual rights to purchase a fixed percentage of future production of specific metals from these mines at a predetermined, low fixed price. This strategy allows WPM to gain exposure to metal production and prices while avoiding the significant capital expenditures and operational risks associated with traditional mining.
The company's primary products are streams of precious and strategic metals, specifically gold, silver, palladium, and cobalt. Through its diversified portfolio of streaming agreements, WPM holds interests in 23 operating mines and 13 development projects across various international locations, ensuring a robust and diversified source of metals. These precious metals are subsequently sold by Wheaton Precious Metals in Canada and to other markets internationally.
```AI Analysis | Feedback
Here are 1-3 brief analogies for Wheaton Precious Metals (WPM):
It's like a specialized bank for precious metal miners, but instead of getting paid back with interest, they receive a stream of actual gold, silver, and other precious metals directly from the mines.
Imagine it as a "landlord" for future metal production, where they provide upfront funding to miners for their projects and, in return, receive a percentage of the physical gold, silver, and palladium produced, without actually owning or operating the mines.
AI Analysis | Feedback
- Gold: A precious metal acquired through streaming agreements and sold by Wheaton Precious Metals.
- Silver: A precious metal acquired through streaming agreements and sold by Wheaton Precious Metals.
- Palladium: A precious metal acquired through streaming agreements and sold by Wheaton Precious Metals.
- Cobalt: A metal acquired through streaming agreements and sold by Wheaton Precious Metals.
AI Analysis | Feedback
AI Analysis | Feedback
- Vale S.A. (VALE)
- Newmont Corporation (NEM)
- Sibanye Stillwater Limited (SBSW)
- Teck Resources Limited (TECK)
- Glencore plc (GLEN)
- BHP Group (BHP)
- Mitsubishi Corporation
AI Analysis | Feedback
Haytham Hodaly
President & CEO
Haytham Hodaly became President on June 30, 2025, and then Chief Executive Officer and a Director of Wheaton Precious Metals on March 31, 2026. He brings 30 years of experience in mining investment analysis and has been instrumental in the execution of over US$15 billion in streaming transactions for the company. Prior to joining Wheaton, Mr. Hodaly was a Director and Mining Analyst at RBC Capital Markets, and co-directed research at Salman Partners Inc. He is an engineer by training.
Vincent Lau
Chief Financial Officer
Vincent Lau was appointed Chief Financial Officer of Wheaton Precious Metals, effective March 31, 2025, as part of a planned leadership succession. He served as Wheaton's Vice President of Finance for 13 years, where he managed the corporate finance and risk management functions. Mr. Lau holds both Chartered Professional Accountant and Chartered Financial Analyst designations.
Curt Bernardi
Executive Vice President, Strategy and General Counsel
Curt Bernardi was appointed Executive Vice President, Strategy and General Counsel on June 30, 2025. He joined Wheaton in 2008 as Senior Vice President, Legal, and has been instrumental in providing strategic direction and expertly structuring many of the company's key streaming transactions. With a legal career spanning over three decades, Mr. Bernardi brings deep expertise in corporate finance, mergers and acquisitions, and governance. Prior to joining Wheaton, he held senior legal roles at Westcoast Energy, Duke Energy Gas Transmission, and Union Gas.
Neil Burns
Vice President, Corporate Development
Neil Burns was promoted to Vice President, Corporate Development, effective June 30, 2025. He originally joined Wheaton in July 2008 as Director, Geology, and was promoted to Vice President, Technical Services in 2012. Mr. Burns has extensive international experience in exploration, mining, and resource evaluation. Before Wheaton, he held numerous positions with mining and consulting firms, including Corporate Resource Geologist and Project Geologist for Lundin Mining Corporation and Resource Consultant for Snowden Mining Industry Consultants. He holds a master's degree in mineral exploration and a Bachelor of Science degree.
Simona Antolak
Vice President, Communications & Corporate Affairs
Simona Antolak joined Wheaton Precious Metals Corp. in 2016 and currently serves as the Vice President of Communications & Corporate Affairs. In this role, she manages both internal and external communications and supports the development and execution of Wheaton's sustainability strategy. Ms. Antolak has nearly 15 years of experience in the resource industry, specializing in corporate communications, investor relations, branding, media relations, and sustainability. She holds a Bachelor of Business Administration and Diploma of Technology in Marketing Communications.
AI Analysis | Feedback
Here are the key risks to Wheaton Precious Metals:
- Commodity Price Volatility: Wheaton Precious Metals' financial performance is highly dependent on the market prices of precious metals such as gold, silver, palladium, and cobalt. Fluctuations in these commodity prices directly impact the company's revenue and operating margins. Even though Wheaton's streaming model provides some insulation from direct mining cost inflation, a significant downturn in precious metal prices would negatively affect its profitability.
- Counterparty and Operational Risk: As a streaming company, Wheaton Precious Metals does not operate mines directly but relies on third-party mining companies. This exposes Wheaton to the operational risks of its partners, including potential disruptions or delays in stream production, lower ore grades than anticipated, project delays, or production shortfalls at the operating mines. Such issues at partner mines can directly reduce the volume of metals delivered to Wheaton.
- Geopolitical, Regulatory, and Tax Risks: Wheaton Precious Metals operates globally, which exposes it to a range of geopolitical uncertainties, as well as changes in tax and mining regulations in the various countries where its partner mines are located. These factors can include new taxes (like a global minimum tax), changes in mining laws, political instability, or other regulatory developments that could adversely affect the financial projections and operations of the company and its mining partners.
AI Analysis | Feedback
The accelerating global transition to electric vehicles (EVs) presents a clear emerging threat to Wheaton Precious Metals' palladium streams. Palladium's primary industrial demand stems from its use in catalytic converters for gasoline-powered internal combustion engine vehicles. As EV adoption increases and regulations favor zero-emission vehicles, the long-term demand for new gasoline vehicles, and consequently palladium, is projected to significantly decline, undermining the value of WPM's palladium agreements.
Additionally, the rapid evolution of battery technology poses an emerging threat to WPM's cobalt streams. Driven by ethical sourcing concerns, supply chain instability, and cost reduction efforts, battery manufacturers are actively developing and deploying alternative battery chemistries that utilize less cobalt or are entirely cobalt-free (e.g., lithium iron phosphate (LFP) batteries, high-nickel chemistries). Widespread adoption of these alternative technologies would reduce overall demand for cobalt, negatively impacting the profitability of WPM's cobalt interests.
AI Analysis | Feedback
Wheaton Precious Metals (symbol: WPM) operates in the precious metals streaming sector, with its main products being gold, silver, palladium, and cobalt. The addressable markets for these products are as follows:
- Gold: The global gold market size is valued at approximately USD 1308.43 billion in 2026.
- Silver: The global silver market size is projected to grow from approximately USD 105.15 billion in 2026.
- Palladium: The global palladium market size is estimated to be valued at approximately US$ 16.8 billion in 2026.
- Cobalt: The global cobalt market size is projected to grow from approximately USD 20.5 billion in 2026.
AI Analysis | Feedback
Here are 3 expected drivers of future revenue growth for Wheaton Precious Metals (WPM) over the next 2-3 years:
- Organic Production Growth from Portfolio Assets: Wheaton Precious Metals anticipates significant organic growth in its attributable production of gold equivalent ounces (GEOs). The company has provided guidance targeting an increase to 860,000-940,000 GEOs for 2026, representing approximately 12% growth from 2025, and expects production to reach 1.2 million GEOs by 2030, reflecting roughly 50% organic growth from 2025 levels. This growth is driven by contributions from a diverse portfolio of operating mines and development projects, including increased silver streams from Antamina, and ramping up production from assets such as Blackwater, Koné, Mineral Park, Fenix, Hemlo, Goose, and Platreef.
- Strategic Acquisitions and New Streaming Agreements: Wheaton Precious Metals actively pursues and executes new streaming and royalty agreements to expand its portfolio and diversify its production sources. A notable example is the substantial silver stream acquired from BHP at the Antamina mine, which is projected to significantly boost silver production and overall GEOs. The company's management has indicated a continued focus on evaluating new opportunities, deploying significant capital for new deals, and enhancing its long-term growth profile through strategic investments.
- Leverage to Precious Metal Prices: As a streaming company, Wheaton Precious Metals benefits significantly from increases in the market prices of gold, silver, palladium, and cobalt. The company's business model involves purchasing metals at fixed, low costs and selling them at prevailing spot prices. This structure provides direct leverage to commodity prices, allowing higher metal prices to translate into expanded margins and increased revenue without proportionate increases in operating costs. Strong precious metal prices have historically led to record revenues and operating cash flows for the company.
AI Analysis | Feedback
Share Repurchases
- Wheaton Precious Metals has made no share repurchases in recent years, with the share buybacks for WPM stock recorded as $0.00.
- Management indicated they would consider future buybacks once specific leverage metrics are achieved.
Share Issuance
- As of February 28, 2026, the company's issued share capital was 454,036,958 common shares.
- On March 3, 2026, Wheaton Precious Metals issued and allotted 461 common shares due to the exercise of vested share option rights by eligible employees.
- The company operates a Dividend Reinvestment Plan (DRIP), where common shares are issued through treasury without a discount for quarterly dividends.
Outbound Investments
- In February 2026, Wheaton Precious Metals announced the acquisition of an additional silver stream on the Antamina Mine from BHP Group Limited, with an upfront cash consideration of US$4.3 billion. This transaction closed on April 1, 2026, doubling Wheaton's exposure to Antamina's silver production.
- The Antamina silver stream is projected to increase 2026 production by 11.3% on a pro-forma basis and contribute approximately 18% of total gold equivalent production by 2030, solidifying Antamina as Wheaton's second-largest asset.
- The company also has a cobalt stream relating to the Jervois project, which involves a sizeable upfront commitment paid in installments.
Capital Expenditures
- For a streaming company like Wheaton Precious Metals, a significant portion of capital allocation for growth involves upfront payments for streaming agreements. The Antamina silver stream, for instance, involved an upfront payment of US$4.3 billion in April 2026.
- This US$4.3 billion transaction was financed through a combination of cash, a revolving credit facility, and a new term loan, shifting the company to a modest net-debt position.
- Wheaton's capital allocation strategy focuses on acquiring high-quality assets and entering into well-structured agreements that offer attractive margins and long-term growth.
Peer Outperformance in Gold
| Industry | Names | 1Y med | 3Y med | 5Y med | Top 3 by 5Y |
|---|---|---|---|---|---|
| Copper | 7 | 34.5% | 123.4% | 151.1% | SCCO 258% · TGB 243% · HBM 219% |
| Steel | 14 | 25.4% | 45.3% | 127.4% | HCC 350% · STLD 293% · RS 182% |
| Gold ← | 38 | 12.1% | 197.5% | 92.2% | IAG 484% · OGC 356% · AGI 278% |
| Silver | 6 | 31.7% | 299.7% | 83.1% | AYA 259% · HL 138% · SVM 111% |
| Construction Materials | 6 | -13.8% | 18.4% | 40.7% | USLM 350% · CRH 106% · VMC 50% |
| Aluminum | 3 | 12.7% | 118.7% | 28.9% | CENX 168% · AA -9% |
| Metal, Glass & Plastic Containers | 11 | 16.2% | 20.9% | 4.8% | GEF 22% · ATR 18% · SLGN 9% |
| Paper & Plastic Packaging Products & Materials | 7 | 19.8% | 17.4% | -6.0% | PKG 117% · CCK 22% · SON -1% |
| Diversified Metals & Mining | 24 | -54.0% | -11.7% | -8.2% | SKE 163% · MTRN 127% · MP -6% |
| Diversified Chemicals | 3 | 21.0% | 3.3% | -15.4% | CBT 40% · ASH -15% · CC -49% |
| Specialty Chemicals | 42 | 9.8% | 5.1% | -25.1% | PRM 149% · NEU 127% · ESI 39% |
| Precious Metals & Minerals | 7 | -8.1% | 132.7% | -28.7% | PPTA 291% |
| Commodity Chemicals | 12 | 19.1% | -25.5% | -29.4% | HWKN 332% · MEOH 64% · DOW -30% |
| Fertilizers & Agricultural Chemicals | 10 | 5.8% | 11.5% | -40.2% | CF 116% · CTVA 79% · NTR 26% |
| Paper Products | 4 | -49.3% | -70.1% | -80.6% |
Latest Trefis Analyses
Research & Analysis
Invest in Strategies
Wealth Management
Peer Comparisons
| Peers to compare with: |
Financials
| Median | |
|---|---|
| Name | |
| Mkt Price | 196.41 |
| Mkt Cap | 36.3 |
| Rev LTM | 2,038 |
| Op Inc LTM | 1,428 |
| FCF LTM | -92 |
| FCF 3Y Avg | 26 |
| CFO LTM | 1,215 |
| CFO 3Y Avg | 770 |
Growth & Margins
| Median | |
|---|---|
| Name | |
| Rev Chg LTM | 81.5% |
| Rev Chg 3Y Avg | 38.7% |
| Rev Chg Q | 62.0% |
| QoQ Delta Rev Chg LTM | 10.8% |
| Op Inc Chg LTM | 92.8% |
| Op Inc Chg 3Y Avg | 53.8% |
| Op Mgn LTM | 73.9% |
| Op Mgn 3Y Avg | 64.6% |
| QoQ Delta Op Mgn LTM | 0.5% |
| CFO/Rev LTM | 80.9% |
| CFO/Rev 3Y Avg | 79.9% |
| FCF/Rev LTM | -25.3% |
| FCF/Rev 3Y Avg | 19.8% |
Segment Financials
Revenue by Segment| $ Mil | 2025 | 2024 | 2023 | 2022 | 2021 |
|---|---|---|---|---|---|
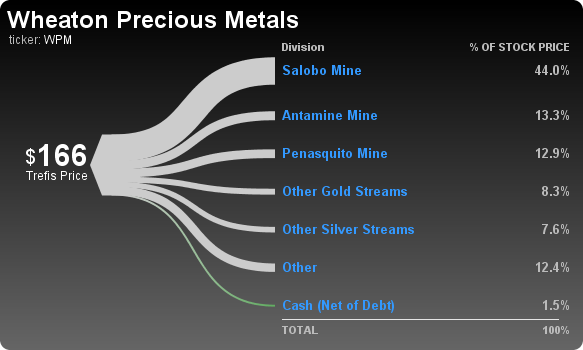
| Salobo | 1,040 | 540 | 400 | 296 | 343 |
| Peñasquito | 302 | 194 | 102 | 175 | 202 |
| Antamina | 230 | 101 | 87 | 108 | 157 |
| Constancia | 221 | 183 | 147 | 100 | 70 |
| Other | 214 | 107 | 111 | 191 | 233 |
| San Dimas | 109 | 69 | 83 | 75 | 86 |
| Blackwater | 76 | 0 | |||
| Sudbury | 58 | 39 | 37 | 39 | 24 |
| Stillwater | 33 | 39 | 35 | 49 | 66 |
| Voisey’s Bay | 31 | 14 | 15 | 32 | 20 |
| Marathon | 0 | 0 | 0 | 0 | |
| Platreef | 0 | 0 | |||
| Total | 2,315 | 1,285 | 1,016 | 1,065 | 1,202 |
| $ Mil | 2008 | 2007 |
|---|---|---|
| Luism in | 57 | |
| Yauliyacu | 22 | 20 |
| Zinkgruvan | 15 | 15 |
| Stratoni | 7 | 5 |
| Peñasquito | 2 | |
| Other 1 | 0 | |
| Luismin | 63 | |
| Total | 103 | 103 |
| $ Mil | 2023 | 2022 | 2021 | 2020 | 2019 |
|---|---|---|---|---|---|
| Salobo | 243 | 173 | 193 | 250 | 158 |
| Constancia | 84 | 54 | 36 | 26 | 19 |
| Other | 73 | 252 | 116 | 86 | 57 |
| Peñasquito | 65 | 112 | 139 | 95 | 41 |
| San Dimas | 45 | 38 | 41 | 33 | 22 |
| Antamina | 44 | 51 | 78 | 40 | 20 |
| Stillwater | 18 | 30 | 41 | 40 | 24 |
| Sudbury | 9 | 7 | 5 | 16 | 5 |
| Voisey’s Bay | 3 | 13 | 166 | 0 | -166 |
| Marathon | 0 | 0 | |||
| Total | 585 | 730 | 816 | 586 | 180 |
| $ Mil | 2025 | 2024 | 2023 | 2022 | 2021 |
|---|---|---|---|---|---|
| Salobo | 2,621 | 2,595 | 2,681 | 2,383 | 2,438 |
| Other | 2,014 | 887 | 1,186 | 947 | 958 |
| Others | 1,729 | 1,045 | 909 | 1,053 | 390 |
| Blackwater | 499 | 481 | |||
| Antamina | 459 | 491 | 520 | 545 | 580 |
| Stillwater | 413 | 421 | 432 | 443 | 453 |
| Platreef | 412 | 412 | |||
| Sudbury | 218 | 242 | 262 | 283 | 307 |
| Voisey’s Bay | 216 | 231 | 351 | 358 | 372 |
| Peñasquito | 207 | 244 | 276 | 294 | 322 |
| Constancia | 204 | 230 | 260 | 289 | 310 |
| San Dimas | 125 | 136 | 145 | 156 | 167 |
| Marathon | 9 | 9 | 9 | 9 | |
| Total | 9,126 | 7,424 | 7,031 | 6,760 | 6,296 |
Price Behavior
| Market Price | $136.62 | |
| Market Cap ($ Bil) | 62.0 | |
| First Trading Date | 07/06/2005 | |
| Distance from 52W High | -17.2% | |
| 50 Days | 200 Days | |
| DMA Price | $138.13 | $133.25 |
| DMA Trend | indeterminate | indeterminate |
| Distance from DMA | -1.1% | 2.5% |
| 3M | 1YR | |
| Volatility | 55.5% | 52.3% |
| Downside Capture | 233.13 | 218.97 |
| Upside Capture | 304.96 | 235.43 |
| Correlation (S&P 500) | 44.7% | 49.6% |
| 1M | 2M | 3M | 6M | 1Y | 3Y | |
|---|---|---|---|---|---|---|
| Beta | 2.79 | 2.64 | 2.41 | 2.39 | 1.99 | 0.80 |
| Up Beta | 2.74 | 0.19 | 0.40 | 1.55 | 1.43 | 0.46 |
| Down Beta | 2.48 | 3.58 | 3.85 | 2.95 | 1.85 | 0.67 |
| Up Capture | 198% | 203% | 305% | 286% | 403% | 167% |
| Bmk +ve Days | 12 | 18 | 28 | 62 | 130 | 427 |
| Stock +ve Days | 10 | 18 | 33 | 60 | 133 | 409 |
| Down Capture | 337% | 313% | 214% | 207% | 157% | 101% |
| Bmk -ve Days | 10 | 25 | 36 | 64 | 121 | 325 |
| Stock -ve Days | 12 | 25 | 31 | 66 | 118 | 342 |
[1] Upside and downside betas calculated using positive and negative benchmark daily returns respectively
Based On 1-Year Data
| Annualized Return | Annualized Volatility | Sharpe Ratio | Correlation with WPM | |
|---|---|---|---|---|
| WPM | 38.9% | 52.3% | 0.80 | - |
| Sector ETF (XLB) | 24.9% | 18.2% | 1.06 | 60.3% |
| Equity (SPY) | 12.7% | 13.7% | 0.62 | 48.8% |
| Gold (GLD) | 0.3% | 28.9% | 0.00 | 82.3% |
| Commodities (DBC) | 34.5% | 21.3% | 1.28 | -2.5% |
| Real Estate (VNQ) | 11.7% | 14.2% | 0.53 | 25.7% |
| Bitcoin (BTCUSD) | -27.7% | 43.5% | -0.63 | 35.4% |
Smart multi-asset allocation framework can stack odds in your favor. Learn How
Based On 5-Year Data
| Annualized Return | Annualized Volatility | Sharpe Ratio | Correlation with WPM | |
|---|---|---|---|---|
| WPM | 29.5% | 37.6% | 0.77 | - |
| Sector ETF (XLB) | 6.1% | 19.2% | 0.20 | 44.4% |
| Equity (SPY) | 11.6% | 17.3% | 0.50 | 31.5% |
| Gold (GLD) | 17.2% | 19.1% | 0.72 | 76.0% |
| Commodities (DBC) | 7.4% | 19.6% | 0.26 | 19.1% |
| Real Estate (VNQ) | 1.4% | 18.9% | -0.04 | 29.7% |
| Bitcoin (BTCUSD) | 3.4% | 51.5% | 0.25 | 20.0% |
Smart multi-asset allocation framework can stack odds in your favor. Learn How
Based On 10-Year Data
| Annualized Return | Annualized Volatility | Sharpe Ratio | Correlation with WPM | |
|---|---|---|---|---|
| WPM | 20.5% | 37.2% | 0.61 | - |
| Sector ETF (XLB) | 10.6% | 20.7% | 0.45 | 31.0% |
| Equity (SPY) | 15.2% | 18.0% | 0.71 | 22.7% |
| Gold (GLD) | 11.7% | 16.6% | 0.58 | 71.1% |
| Commodities (DBC) | 7.5% | 18.1% | 0.33 | 18.6% |
| Real Estate (VNQ) | 5.9% | 20.7% | 0.24 | 21.8% |
| Bitcoin (BTCUSD) | 59.5% | 66.3% | 0.99 | 13.3% |
Smart multi-asset allocation framework can stack odds in your favor. Learn How
SEC Filings
Expand for More| Report Date | Filing Date | Filing |
|---|---|---|
| 06/30/2026 | 08/07/2026 | 6-K |
| 03/31/2026 | 05/07/2026 | 6-K |
| 12/31/2025 | 03/31/2026 | 40-F |
| 09/30/2025 | 11/07/2025 | 6-K |
| 06/30/2025 | 08/08/2025 | 6-K |
| 03/31/2025 | 05/09/2025 | 6-K |
| 12/31/2024 | 03/31/2025 | 40-F |
| 09/30/2024 | 11/07/2024 | 6-K |
| 06/30/2024 | 08/08/2024 | 6-K |
| 03/31/2024 | 05/10/2024 | 6-K |
| 12/31/2023 | 03/28/2024 | 40-F |
| 09/30/2023 | 11/09/2023 | 6-K |
| 06/30/2023 | 08/11/2023 | 6-K |
| 03/31/2023 | 05/04/2023 | 6-K |
| 12/31/2022 | 03/31/2023 | 40-F |
| 09/30/2022 | 11/03/2022 | 6-K |
| Report Date | Filing Date | Filing |
|---|---|---|
| 06/30/2026 | 08/07/2026 | 6-K |
| 03/31/2026 | 05/07/2026 | 6-K |
| 12/31/2025 | 03/31/2026 | 40-F |
| 09/30/2025 | 11/07/2025 | 6-K |
| 06/30/2025 | 08/08/2025 | 6-K |
| 03/31/2025 | 05/09/2025 | 6-K |
| 12/31/2024 | 03/31/2025 | 40-F |
| 09/30/2024 | 11/07/2024 | 6-K |
| 06/30/2024 | 08/08/2024 | 6-K |
| 03/31/2024 | 05/10/2024 | 6-K |
| 12/31/2023 | 03/28/2024 | 40-F |
| 09/30/2023 | 11/09/2023 | 6-K |
| 06/30/2023 | 08/11/2023 | 6-K |
| 03/31/2023 | 05/04/2023 | 6-K |
| 12/31/2022 | 03/31/2023 | 40-F |
| 09/30/2022 | 11/03/2022 | 6-K |
| 06/30/2022 | 08/12/2022 | 6-K |
| 03/31/2022 | 05/05/2022 | 6-K |
| 12/31/2021 | 03/31/2022 | 40-F |
| 09/30/2021 | 11/05/2021 | 6-K |
| 06/30/2021 | 08/13/2021 | 6-K |
| 03/31/2021 | 05/07/2021 | 6-K |
| 12/31/2020 | 03/31/2021 | 40-F |
| 09/30/2020 | 11/10/2020 | 6-K |
| 06/30/2020 | 08/12/2020 | 6-K |
| 03/31/2020 | 05/07/2020 | 6-K |
| 12/31/2019 | 03/30/2020 | 40-F |
| 09/30/2019 | 11/14/2019 | 6-K |


Industry Resources
| Materials Resources |
| Chemical & Engineering News (C&EN) |
| Mining.com |
| Plastics News |
| Gold Resources |
| Kitco News |
| World Gold Council |
| Mining Journal |
External Quote Links
| Y Finance | Barrons |
| TradingView | Morningstar |
| SeekingAlpha | ValueLine |
| Motley Fool | Robinhood |
| CNBC | Etrade |
| MarketWatch | Unusual Whales |
| YCharts | Perplexity Finance |
| FinViz |
Prefer one of these to Trefis? Tell us why.