
Monster Beverage (MNST)
Market Price (9/23/2026): $44.3 | Market Cap: $86.7 BilInvestor Relations Sector: Consumer Staples | Industry: Soft Drinks & Non-alcoholic Beverages
Monster Beverage (MNST)
Market Price (9/23/2026): $44.3Market Cap: $86.7 BilSector: Consumer StaplesIndustry: Soft Drinks & Non-alcoholic Beverages
Investment Highlights Why It Matters Detailed financial logic regarding cash flow yields vs trend-riding momentum.
Strong revenue growthRev Chg LTMRevenue Change % Last Twelve Months (LTM) is 20% Attractive operating marginsOp Mgn LTMOperating Margin = Operating Income / Revenue Reflects profitability before taxes and before impact of capital structure (interest payments). is 29% Attractive cash flow generationCFO/Rev LTMCash Flow from Operations / Revenue (Sales), Last Twelve Months (LTM) is 24%, FCF/Rev LTMFree Cash Flow / Revenue (Sales), Last Twelve Months (LTM) is 23%, CFO LTM is 2.2 Bil, FCF LTM is 2.1 Bil Stock buyback supportStock Buyback 3Y Total is 4.6 Bil Low stock price volatilityVol 12M is 26% Megatrend and thematic driversMegatrends include Health & Wellness Trends. Themes include Functional Foods & Beverages, and Nutritional Supplements. | Weak multi-year price returns3Y Excs Rtn is -17% | Expensive valuation multiplesP/SPrice/Sales ratio is 9.4x, P/CFOPrice/(Cash Flow from Operations). CFO is cash before capital expenditures. is 39x Key risksMNST key risks include [1] regulatory and health scrutiny targeting its core energy and alcohol products, Show more. |
| Strong revenue growthRev Chg LTMRevenue Change % Last Twelve Months (LTM) is 20% |
| Attractive operating marginsOp Mgn LTMOperating Margin = Operating Income / Revenue Reflects profitability before taxes and before impact of capital structure (interest payments). is 29% |
| Attractive cash flow generationCFO/Rev LTMCash Flow from Operations / Revenue (Sales), Last Twelve Months (LTM) is 24%, FCF/Rev LTMFree Cash Flow / Revenue (Sales), Last Twelve Months (LTM) is 23%, CFO LTM is 2.2 Bil, FCF LTM is 2.1 Bil |
| Stock buyback supportStock Buyback 3Y Total is 4.6 Bil |
| Low stock price volatilityVol 12M is 26% |
| Megatrend and thematic driversMegatrends include Health & Wellness Trends. Themes include Functional Foods & Beverages, and Nutritional Supplements. |
| Weak multi-year price returns3Y Excs Rtn is -17% |
| Expensive valuation multiplesP/SPrice/Sales ratio is 9.4x, P/CFOPrice/(Cash Flow from Operations). CFO is cash before capital expenditures. is 39x |
| Key risksMNST key risks include [1] regulatory and health scrutiny targeting its core energy and alcohol products, Show more. |
Qualitative Assessment
AI Analysis | Feedback
Monster Beverage (MNST) stock has remained largely at the same level since 5/31/2026 because of the following key factors:
1. Mixed Fiscal Q2 2026 Earnings Performance and Increasing Expenses.
Monster Beverage reported strong financial results for its fiscal second quarter ended June 30, 2026, with net sales increasing 20.2% to $2.54 billion, exceeding analyst expectations of $2.43 billion. Adjusted earnings per share (EPS) of $0.60 also surpassed the consensus estimate of $0.58. However, the Alcohol Brands segment experienced a 15.2% decrease in net sales, and selling expenses rose to 10.6% of net sales from 9.3% in the prior year due to increased marketing investments. These mixed signals, with strong overall growth but specific segment weakness and higher operational costs, likely prevented a significant upward movement in the stock price.
2. Two-for-One Stock Split.
The company announced and executed a two-for-one stock split in the form of a 100% stock dividend, with shares beginning to trade at the split-adjusted price on August 11, 2026. While a stock split does not alter the fundamental value of the company, it typically leads to a period of price adjustment and can result in short-term stagnation as the market digests the increased number of shares and new per-share price.
Show more
Monster Beverage (MNST) stock has remained largely at the same level since 5/31/2026 because of the following key factors:
1. Mixed Fiscal Q2 2026 Earnings Performance and Increasing Expenses.
Monster Beverage reported strong financial results for its fiscal second quarter ended June 30, 2026, with net sales increasing 20.2% to $2.54 billion, exceeding analyst expectations of $2.43 billion. Adjusted earnings per share (EPS) of $0.60 also surpassed the consensus estimate of $0.58. However, the Alcohol Brands segment experienced a 15.2% decrease in net sales, and selling expenses rose to 10.6% of net sales from 9.3% in the prior year due to increased marketing investments. These mixed signals, with strong overall growth but specific segment weakness and higher operational costs, likely prevented a significant upward movement in the stock price.
2. Two-for-One Stock Split.
The company announced and executed a two-for-one stock split in the form of a 100% stock dividend, with shares beginning to trade at the split-adjusted price on August 11, 2026. While a stock split does not alter the fundamental value of the company, it typically leads to a period of price adjustment and can result in short-term stagnation as the market digests the increased number of shares and new per-share price.
3. Tempered Analyst Price Targets.
Despite the positive top-line results in fiscal Q2 2026, the consensus analyst rating remained a "Moderate Buy" with an average 12-month price target of approximately $50.33. This target suggested a limited upside potential of around 6.7% from the stock's late August trading price, indicating that analysts did not foresee an immediate significant surge in the stock's value even with the strong earnings.
4. Potential Sales Momentum Deceleration and Margin Concerns.
Following the robust fiscal Q2 2026, initial estimates for July 2026 indicated a lower year-over-year sales growth of approximately 14.3%, suggesting a potential deceleration in sales momentum. Additionally, the increasing contribution of international sales, which reached 46% of total net sales and typically carry lower gross margins compared to domestic sales, raised concerns about the potential dilution of overall profitability.
Show less
Stock Movement Drivers
Fundamental Drivers
The 0.5% change in MNST stock from 5/31/2026 to 9/22/2026 was primarily driven by a 4.8% change in the company's Total Revenues ($ Mil).| (LTM values as of) | 5312026 | 9222026 | Change |
|---|---|---|---|
| Stock Price ($) | 44.04 | 44.27 | 0.5% |
| Change Contribution By: | |||
| Total Revenues ($ Mil) | 8,793 | 9,219 | 4.8% |
| Net Income Margin (%) | 23.1% | 23.1% | -0.1% |
| P/E Multiple | 42.4 | 40.7 | -4.0% |
| Shares Outstanding (Mil) | 1,957 | 1,957 | 0.0% |
| Cumulative Contribution | 0.5% |
Market Drivers
5/31/2026 to 9/22/2026| Return | Correlation | |
|---|---|---|
| MNST | 0.5% | |
| Market (SPY) | 2.5% | -6.3% |
| Sector (XLP) | 0.5% | 52.9% |
Fundamental Drivers
The 3.8% change in MNST stock from 2/28/2026 to 9/22/2026 was primarily driven by a 11.1% change in the company's Total Revenues ($ Mil).| (LTM values as of) | 2282026 | 9222026 | Change |
|---|---|---|---|
| Stock Price ($) | 42.65 | 44.27 | 3.8% |
| Change Contribution By: | |||
| Total Revenues ($ Mil) | 8,294 | 9,219 | 11.1% |
| Net Income Margin (%) | 23.0% | 23.1% | 0.5% |
| P/E Multiple | 43.8 | 40.7 | -6.9% |
| Shares Outstanding (Mil) | 1,955 | 1,957 | -0.1% |
| Cumulative Contribution | 3.8% |
Market Drivers
2/28/2026 to 9/22/2026| Return | Correlation | |
|---|---|---|
| MNST | 3.8% | |
| Market (SPY) | 13.3% | 20.6% |
| Sector (XLP) | -6.9% | 44.5% |
Fundamental Drivers
The 41.9% change in MNST stock from 8/31/2025 to 9/22/2026 was primarily driven by a 20.4% change in the company's Total Revenues ($ Mil).| (LTM values as of) | 8312025 | 9222026 | Change |
|---|---|---|---|
| Stock Price ($) | 31.20 | 44.27 | 41.9% |
| Change Contribution By: | |||
| Total Revenues ($ Mil) | 7,659 | 9,219 | 20.4% |
| Net Income Margin (%) | 20.5% | 23.1% | 12.3% |
| P/E Multiple | 38.7 | 40.7 | 5.2% |
| Shares Outstanding (Mil) | 1,951 | 1,957 | -0.3% |
| Cumulative Contribution | 41.9% |
Market Drivers
8/31/2025 to 9/22/2026| Return | Correlation | |
|---|---|---|
| MNST | 41.9% | |
| Market (SPY) | 21.2% | 9.2% |
| Sector (XLP) | 5.3% | 42.9% |
Fundamental Drivers
The 54.2% change in MNST stock from 8/31/2023 to 9/22/2026 was primarily driven by a 37.8% change in the company's Total Revenues ($ Mil).| (LTM values as of) | 8312023 | 9222026 | Change |
|---|---|---|---|
| Stock Price ($) | 28.70 | 44.27 | 54.2% |
| Change Contribution By: | |||
| Total Revenues ($ Mil) | 6,691 | 9,219 | 37.8% |
| Net Income Margin (%) | 21.5% | 23.1% | 7.6% |
| P/E Multiple | 41.9 | 40.7 | -2.8% |
| Shares Outstanding (Mil) | 2,094 | 1,957 | 7.0% |
| Cumulative Contribution | 54.2% |
Market Drivers
8/31/2023 to 9/22/2026| Return | Correlation | |
|---|---|---|
| MNST | 54.2% | |
| Market (SPY) | 78.3% | 20.9% |
| Sector (XLP) | 23.4% | 47.3% |
Price Returns Compared
| 2021 | 2022 | 2023 | 2024 | 2025 | 2026 | Total [1] | |
|---|---|---|---|---|---|---|---|
| Returns | |||||||
| MNST Return | 4% | 6% | 13% | -9% | 46% | 15% | 90% |
| Peers Return | 22% | 12% | 10% | -12% | 10% | 0% | 47% |
| S&P 500 Return | 27% | -19% | 24% | 23% | 16% | 13% | 107% |
Monthly Win Rates [3] | |||||||
| MNST Win Rate | 50% | 50% | 58% | 50% | 67% | 67% | |
| Peers Win Rate | 58% | 50% | 50% | 43% | 52% | 56% | |
| S&P 500 Win Rate | 75% | 42% | 67% | 75% | 67% | 56% | |
Max Drawdowns [4] | |||||||
| MNST Max Drawdown | -18% | -26% | -21% | -26% | -12% | -18% | |
| Peers Max Drawdown | -26% | -24% | -21% | -28% | -26% | -25% | |
| S&P 500 Max Drawdown | -5% | -25% | -10% | -8% | -19% | -9% | |
[1] Cumulative total returns since the beginning of 2021
[2] Peers: PEP, KO, CELH, KDP, FIZZ. See MNST Returns vs. Peers.
[3] Win Rate = % of calendar months in which monthly returns were positive
[4] Max drawdown represents maximum peak-to-trough decline within a year
[5] 2026 data is for the year up to 9/22/2026 (YTD)
How Low Can It Go
| Event | MNST | S&P 500 |
|---|---|---|
| Summer-Fall 2023 Five Percent Yield Shock | ||
| % Loss | -18.1% | -9.5% |
| % Gain to Breakeven | 22.2% | 10.5% |
| Time to Breakeven | 82 days | 24 days |
| 2022 Inflation Shock & Fed Tightening | ||
| % Loss | -24.9% | -24.5% |
| % Gain to Breakeven | 33.2% | 32.4% |
| Time to Breakeven | 120 days | 427 days |
| 2020 COVID-19 Crash | ||
| % Loss | -27.3% | -33.7% |
| % Gain to Breakeven | 37.5% | 50.9% |
| Time to Breakeven | 65 days | 140 days |
| Q4 2018 Fed Policy Error / Growth Scare | ||
| % Loss | -15.4% | -19.2% |
| % Gain to Breakeven | 18.2% | 23.8% |
| Time to Breakeven | 38 days | 105 days |
| 2016-2017 Trump Reflation Bond Selloff | ||
| % Loss | -16.5% | -3.7% |
| % Gain to Breakeven | 19.8% | 3.9% |
| Time to Breakeven | 190 days | 6 days |
| 2015-2016 China Devaluation / Global Growth Scare | ||
| % Loss | -22.5% | -12.2% |
| % Gain to Breakeven | 29.0% | 13.9% |
| Time to Breakeven | 90 days | 62 days |
In The Past
Monster Beverage's stock fell -0.9% during the 2025 US Tariff Shock. Such a loss loss requires a 0.9% gain to breakeven.
Preserve Wealth
Limiting losses and compounding gains is essential to preserving wealth.
Asset Allocation
Actively managed asset allocation strategies protect wealth. Learn more.
| Event | MNST | S&P 500 |
|---|---|---|
| 2022 Inflation Shock & Fed Tightening | ||
| % Loss | -24.9% | -24.5% |
| % Gain to Breakeven | 33.2% | 32.4% |
| Time to Breakeven | 120 days | 427 days |
| 2020 COVID-19 Crash | ||
| % Loss | -27.3% | -33.7% |
| % Gain to Breakeven | 37.5% | 50.9% |
| Time to Breakeven | 65 days | 140 days |
| 2015-2016 China Devaluation / Global Growth Scare | ||
| % Loss | -22.5% | -12.2% |
| % Gain to Breakeven | 29.0% | 13.9% |
| Time to Breakeven | 90 days | 62 days |
| 2008-2009 Global Financial Crisis | ||
| % Loss | -55.7% | -53.4% |
| % Gain to Breakeven | 125.7% | 114.4% |
| Time to Breakeven | 680 days | 1085 days |
In The Past
Monster Beverage's stock fell -0.9% during the 2025 US Tariff Shock. Such a loss loss requires a 0.9% gain to breakeven.
Preserve Wealth
Limiting losses and compounding gains is essential to preserving wealth.
Asset Allocation
Actively managed asset allocation strategies protect wealth. Learn more.
About Monster Beverage (MNST)
Monster Beverage Corporation (MNST) is a prominent global developer, marketer, seller, and distributor of energy drink beverages and concentrates. The company primarily operates through its Monster Energy Drinks segment, complemented by Strategic Brands and Other segments, making it a key player in the beverage industry both in the United States and internationally.
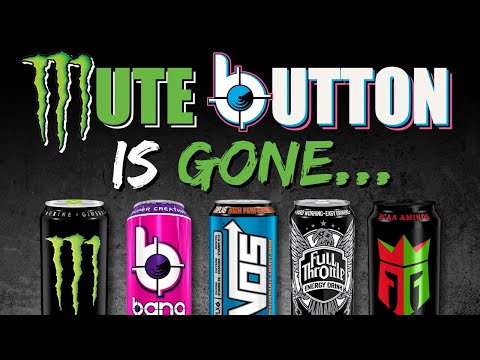
The company's core offering revolves around its extensive portfolio of energy drinks, most notably under the flagship Monster Energy brand, which includes variations like Monster Energy Ultra, Monster Rehab, and Java Monster. Beyond its renowned energy drinks, Monster Beverage also diversified its product line to include non-carbonated ready-to-drink iced teas, lemonades, juice cocktails, dairy and coffee drinks, sports drinks, and natural sparkling beverages, marketed under a broad array of brands such as Reign Total Body Fuel, NOS, and Full Throttle.
Monster Beverage serves a wide range of customers through a multifaceted distribution network. It sells its products to bottlers and full-service beverage distributors, as well as directly to a vast array of retail channels. These include retail grocery and specialty chains, wholesalers, club stores, mass merchandisers, convenience chains, drug stores, foodservice customers, value stores, and e-commerce retailers. The company also supplies concentrates and beverage bases to authorized bottling and canning operations worldwide.
AI Analysis | Feedback
Monster Beverage is like **the Coca-Cola of energy drinks**.
Alternatively, think of it as **a PepsiCo focused on the energy drink and specialty beverage market**.
AI Analysis | Feedback
- Energy Drinks: Carbonated and non-carbonated beverages formulated to provide an energy boost, including flagship Monster Energy products and brands like Reign, NOS, and Full Throttle.
- Ready-to-Drink Coffee & Dairy Beverages: Prepared coffee and dairy-based drinks, often with an added energy or protein component, found under brands like Java Monster and Muscle Monster.
- Juice-Based Beverages: A variety of juice cocktails, single-serve juices, and fruit beverages offered through lines such as Punch Monster and Juice Monster.
- Hydration and Sports Drinks: Still waters, flavored energy waters, and performance-enhancing sports drinks, including the Monster Hydro and Monster Super Fuel series.
- Iced Teas and Lemonades: Ready-to-drink teas and lemonades, such as the Monster Dragon Tea products.
- Sparkling Juices and Flavored Sodas: Natural sparkling juices and flavored sparkling beverages, exemplified by the True North brand.
AI Analysis | Feedback
Monster Beverage Corporation (MNST) primarily sells its products to other companies, acting as a business-to-business (B2B) supplier.
Its major customers fall into the following categories:
- Beverage Bottlers and Distributors: These companies purchase concentrates and/or finished Monster products for bottling, distribution, and sale in various markets globally. The most significant customer in this category, fitting the description of a "bottler" and "full-service beverage distributor" for Monster globally, is The Coca-Cola Company (KO). Through a strategic partnership, The Coca-Cola Company serves as a primary distributor for Monster's products in many regions, purchasing products for onward distribution to retailers.
-
Direct Retail and Wholesale Channels: Monster also sells directly to a wide array of retail and wholesale partners. While specific company names for these direct sales relationships are not provided in the background description, these customers represent various types of businesses that directly purchase and resell Monster's beverages. These include:
- Retail grocery and speciality chains
- Wholesalers
- Club stores
- Mass merchandisers
- Convenience chains
- Drug stores
- Foodservice customers
- Value stores
- E-commerce retailers
- The military (selling to entities like commissaries and base exchanges)
AI Analysis | Feedback
AI Analysis | Feedback
Rodney C. Sacks, Chairman of the Board
Rodney Sacks, born in South Africa in 1949 or 1950, is a billionaire businessman. He earned a law degree from the University of the Witwatersrand and was the youngest partner at Werksmans, a prominent South African corporate law firm, before emigrating to California in 1989. In 1990, he co-led a consortium with Hilton Schlosberg to acquire Hansen Natural Corporation for $14.5 million, which was later rebranded as Monster Beverage Corporation in 2012. He served as Co-Chief Executive Officer until June 2025, when he transitioned to solely the Chairman of the Board role. Under his leadership, the company launched the highly successful Monster Energy drink line in 2002. Beyond Monster, Sacks and Schlosberg also acquired Thrifty Ice Cream through their holding company, Hilton Holdings, in June 2025.
Hilton H. Schlosberg, Chief Executive Officer and Vice Chairman
Hilton Schlosberg, a South African-born British billionaire businessman born in 1952, holds an MBA from the University of the Witwatersrand. In 1992, he partnered with Rodney Sacks to acquire Hansen Natural Corporation, where he initially served as President and Chief Operating Officer. He also held the position of Chief Financial Officer for over 23 years until 2021. Effective June 13, 2025, Schlosberg assumed the role of sole Chief Executive Officer, having previously served as Co-Chief Executive Officer and Vice Chairman. He was instrumental in revitalizing the company and launching the Monster Energy brand in 2002. Along with Rodney Sacks, he acquired Thrifty Ice Cream through their company, Hilton Holdings.
Thomas J. Kelly, Chief Financial Officer
Thomas J. Kelly serves as the Chief Financial Officer of Monster Beverage Corporation, a role he took on in 2021. He is responsible for overseeing all financial aspects of the company, including financial planning and analysis, corporate finance, and accounting. Kelly is a Certified Public Accountant (CPA) with extensive expertise in finance and accounting.
Mark J. Hall, President, Beverage Alcohol and Director
Mark J. Hall has been a Director on Monster Beverage Corporation's Board since January 2014. He currently serves as the President of Beverage Alcohol, a position he has held since May 2023. Prior to this, he played key roles in product ideation, design, and development at Monster Energy Company, which he joined in 1997. Hall was notably instrumental in the launch of the Monster Energy drink in 2002. He also previously held the position of Vice President-Sales at Arizona Beverage Co.
Guy P. Carling, President, EMEA & OSP
Guy P. Carling serves as the President of EMEA (Europe, the Middle East, and Africa) & OSP for Monster Beverage Corporation. He joined the company in 2010 and has been crucial in expanding Monster's market presence and share across the EMEA region. Carling's strategic approach and deep understanding of diverse markets have been vital in driving the company's international performance.
AI Analysis | Feedback
Here are the key risks to Monster Beverage (MNST):
- Intensified Competition and Market Share Erosion: Monster Beverage operates in a fiercely competitive beverage industry, facing challenges from both established players like Red Bull and numerous new entrants. This intense competition can lead to price wars, increased marketing expenditures, and difficulty in maintaining or expanding market share, which could materially impact the company's revenues and operating results.
- Changing Consumer Preferences and Regulatory Scrutiny: There is a growing global trend towards health and wellness, which could reduce demand for energy drinks with high caffeine and sugar content. Coupled with this, the energy drink industry faces increasing regulatory scrutiny regarding the health effects of its ingredients, particularly caffeine. Potential regulatory changes, such as new restrictions on product formulations, marketing practices (especially concerning minors), or the imposition of taxes on sugary drinks, could negatively impact Monster Beverage's product offerings, consumer demand, and financial performance.
- Currency Fluctuations: Given Monster Beverage's significant international sales and operations, its financial performance is susceptible to adverse currency exchange rate fluctuations. Changes in exchange rates can affect the value of international sales and profits when translated back into U.S. dollars, impacting the company's reported financial results.
AI Analysis | Feedback
AI Analysis | Feedback
Global Energy Drink Market
The global energy drinks market was estimated at approximately USD 79.39 billion in 2024. This market is projected to grow to about USD 125.11 billion by 2030, with a compound annual growth rate (CAGR) of 8.0% from 2025 to 2030.U.S. Energy Drink Market
In the U.S., the energy drinks market was valued at approximately USD 25.01 billion in 2024. It is expected to expand at a CAGR of 7.2% from 2024 to 2030. Another source indicates the U.S. market was valued at USD 23.19 billion in 2024 and is projected to reach USD 43.08 billion by 2032, growing at a CAGR of 8.1%.AI Analysis | Feedback
Monster Beverage Corporation (MNST) is expected to drive future revenue growth over the next 2-3 years through several key strategies:
-
International Market Expansion: Monster Beverage has demonstrated significant growth in its international markets, with foreign currency favorably impacting Q4 2025 sales and international net sales rising 26.9% in the same quarter, representing approximately 42% of total sales. The EMEA region, in particular, saw a 32.6% increase in dollar sales, contributing substantially to offshore growth.
-
Product Innovation and Portfolio Expansion, particularly in Zero Sugar Offerings: The company continues to expand its product portfolio with innovative offerings, and a strategic focus on zero-sugar products has been a crucial element of its success. Monster Beverage has a robust innovation pipeline planned for 2026 and beyond, with staggered launches expected. The volume mix of no-sugar products reached 40.3% of the portfolio in Q4 2025, aligning with broader consumer trends.
-
Strategic Pricing Initiatives: Higher pricing has already contributed to a strong increase in net income for Monster Beverage in Q4 2025. The company is actively conducting an ongoing review of pricing opportunities, both domestically and internationally, to further enhance revenue through improved pricing power.
-
Continued Growth of the Core Monster Energy Drinks Segment: The Monster Energy Drinks segment, which includes key brands such as Monster Energy, Reign Total Body Fuel, and Bang Energy drinks, remains a primary driver of the company's performance. This segment experienced an 18.9% increase in net sales in the fourth quarter of 2025.
AI Analysis | Feedback
Share Repurchases
- Monster Beverage authorized a new share repurchase program for up to an additional $500.0 million on November 8, 2023, with approximately $282.8 million remaining under a previously authorized program at that time.
- As of February 26, 2026, approximately $500.0 million remained available under the share repurchase program.
- The company repurchased approximately $3.8 billion of common stock in 2024, which included a $3.0 billion tender offer completed in June 2024.
Share Issuance
- Monster Beverage's shares outstanding have generally declined over the last few years, with 0.984 billion shares outstanding in 2025, a 2.83% decrease from 2024.
- Shares outstanding were 1.013 billion in 2024, a 4.24% decrease from 2023, and 1.058 billion in 2023, a 0.79% decrease from 2022.
Outbound Investments
- On July 31, 2023, Monster Beverage acquired substantially all the assets of Vital Pharmaceuticals, Inc. and certain affiliates (Bang Energy), which included the Bang Energy® drink business and a beverage production facility in Phoenix, Arizona.
- In 2022, Monster Beverage completed the acquisition of Monster Brewing Company, marking its entry into the alcohol beverage sector.
Capital Expenditures
- Monster Beverage's capital expenditures were $264.1 million in fiscal year 2024, which was a peak for the last five years.
- Capital expenditures increased in 2022 to $188.7 million, in 2023 to $221.4 million, and in 2024 to $264.1 million, following a low of $43.868 million in 2021.
- Capital expenditures for the latest twelve months were $195.4 million, and for Q4 2025, they were $28.2 million.
Peer Outperformance in Soft Drinks & Non-alcoholic Beverages
| Industry | Names | 1Y med | 3Y med | 5Y med | Top 3 by 5Y |
|---|---|---|---|---|---|
| Consumer Staples Merchandise Retail | 12 | 8.0% | 41.2% | 54.6% | NGVC 239% · VLGEA 147% · WMT 146% |
| Food Retail | 6 | -7.2% | 48.0% | 42.6% | CASY 219% · SFM 202% · KR 62% |
| Tobacco | 6 | -40.6% | 9.5% | 31.7% | PM 137% · MO 106% · TPB 40% |
| Food Distributors | 9 | -0.6% | 29.1% | 12.5% | CHEF 244% · USFD 169% · ANDE 145% |
| Soft Drinks & Non-alcoholic Beverages ← | 12 | -5.7% | -16.6% | 2.4% | COKE 410% · BRFH 168% · CCHGY 113% |
| Brewers | 3 | -14.5% | -35.2% | -6.1% | BUD 43% · TAP -6% · SAM -68% |
| Agricultural Products & Services | 12 | 2.0% | 2.2% | -14.3% | BG 60% · ADM 57% · INGR 27% |
| Household Products | 19 | -2.0% | -7.6% | -14.8% | ACU 103% · IPAR 89% · CL 28% |
| Personal Care Products | 4 | -0.3% | -2.9% | -24.7% | ELF 250% · PG 17% · EL -66% |
| Packaged Foods & Meats | 47 | -24.8% | -33.5% | -40.7% | MAMA 459% · LWAY 305% · SENEA 295% |
| Distillers & Vintners | 5 | -43.7% | -59.4% | -77.9% | STZ -40% · BF-B -57% · MGPI -78% |
| Drug Retail | 3 | -40.3% | -85.7% | -93.5% | HITI -57% · PETS -93% · SCNX -99% |
Latest Trefis Analyses
Research & Analysis
Invest in Strategies
Wealth Management
Peer Comparisons
| Peers to compare with: |
Financials
| Median | |
|---|---|
| Name | |
| Mkt Price | 37.89 |
| Mkt Cap | 86.7 |
| Rev LTM | 20,090 |
| Op Inc LTM | 3,338 |
| FCF LTM | 2,081 |
| FCF 3Y Avg | 1,803 |
| CFO LTM | 2,527 |
| CFO 3Y Avg | 2,088 |
Growth & Margins
| Median | |
|---|---|
| Name | |
| Rev Chg LTM | 20.4% |
| Rev Chg 3Y Avg | 11.5% |
| Rev Chg Q | 10.6% |
| QoQ Delta Rev Chg LTM | 2.6% |
| Op Inc Chg LTM | 17.0% |
| Op Inc Chg 3Y Avg | 8.4% |
| Op Mgn LTM | 18.8% |
| Op Mgn 3Y Avg | 20.4% |
| QoQ Delta Op Mgn LTM | -0.1% |
| CFO/Rev LTM | 16.7% |
| CFO/Rev 3Y Avg | 16.3% |
| FCF/Rev LTM | 15.2% |
| FCF/Rev 3Y Avg | 14.8% |
Valuation
| Median | |
|---|---|
| Name | |
| Mkt Cap | 86.7 |
| P/S | 2.5 |
| P/Op Inc | 13.1 |
| P/EBIT | 20.3 |
| P/E | 30.0 |
| P/CFO | 17.0 |
| Total Yield | 6.4% |
| Dividend Yield | 2.9% |
| FCF Yield 3Y Avg | 3.3% |
| D/E | 0.1 |
| Net D/E | 0.1 |
Returns
| Median | |
|---|---|
| Name | |
| 1M Rtn | -5.6% |
| 3M Rtn | 1.2% |
| 6M Rtn | 11.1% |
| 12M Rtn | 11.2% |
| 3Y Rtn | -6.4% |
| 1M Excs Rtn | -6.8% |
| 3M Excs Rtn | -4.2% |
| 6M Excs Rtn | -7.6% |
| 12M Excs Rtn | -8.3% |
| 3Y Excs Rtn | -82.2% |
Comparison Analyses
Segment Financials
Revenue by Segment| $ Mil | 2025 | 2024 | 2023 | 2022 | 2021 |
|---|---|---|---|---|---|
| Monster Energy® Drinks | 7,666 | 6,865 | 6,555 | 5,833 | 5,221 |
| Strategic Brands | 469 | 432 | 377 | 353 | 295 |
| Alcohol Brands | 135 | 172 | 185 | 101 | 0 |
| Other | 25 | 24 | 23 | 23 | 26 |
| Corporate and unallocated | 0 | 0 | |||
| Total | 8,294 | 7,493 | 7,140 | 6,311 | 5,541 |
| $ Mil | 2025 | 2024 | 2023 | 2022 | 2021 |
|---|---|---|---|---|---|
| Monster Energy® Drinks | 2,977 | 2,462 | 2,339 | 1,850 | 1,991 |
| Strategic Brands | 241 | 234 | 207 | 198 | 174 |
| Other | 3 | 5 | 4 | 3 | 7 |
| Alcohol Brands | -127 | -200 | -81 | -32 | 0 |
| Corporate overhead expenses, excluding payroll | -229 | -193 | -183 | ||
| Corporate payroll expenses | -446 | -377 | -332 | ||
| Corporate and unallocated | -435 | -374 | |||
| Total | 2,419 | 1,930 | 1,953 | 1,585 | 1,797 |
Price Behavior
| Market Price | $44.27 | |
| Market Cap ($ Bil) | 86.7 | |
| First Trading Date | 08/18/1995 | |
| Distance from 52W High | -11.4% | |
| 50 Days | 200 Days | |
| DMA Price | $46.41 | $42.17 |
| DMA Trend | up | down |
| Distance from DMA | -4.6% | 5.0% |
| 3M | 1YR | |
| Volatility | 24.2% | 26.4% |
| Downside Capture | 4.77 | -8.99 |
| Upside Capture | -24.10 | 30.29 |
| Correlation (SPY) | -4.0% | 9.8% |
| 1M | 2M | 3M | 6M | 1Y | 3Y | |
|---|---|---|---|---|---|---|
| Beta | -0.79 | 0.00 | -0.08 | 0.50 | 0.21 | 0.34 |
| Up Beta | -0.22 | -0.56 | -0.02 | 0.86 | 0.64 | 0.45 |
| Down Beta | -1.10 | 0.88 | 0.15 | 0.55 | 0.09 | 0.26 |
| Up Capture | -115% | -20% | -7% | 31% | 24% | 12% |
| Bmk +ve Days | 10 | 21 | 32 | 68 | 138 | 427 |
| Stock +ve Days | 12 | 21 | 36 | 69 | 146 | 405 |
| Down Capture | -84% | 31% | -33% | 32% | -22% | 48% |
| Bmk -ve Days | 11 | 21 | 32 | 59 | 113 | 324 |
| Stock -ve Days | 9 | 21 | 28 | 58 | 105 | 345 |
[1] Upside and downside betas calculated using positive and negative benchmark daily returns respectively
Based On 1-Year Data
| Annualized Return | Annualized Volatility | Sharpe Ratio | Correlation with MNST | |
|---|---|---|---|---|
| MNST | 38.2% | 26.3% | 1.19 | - |
| Sector ETF (XLP) | 7.1% | 14.5% | 0.25 | 42.7% |
| Equity (SPY) | 17.6% | 13.0% | 0.98 | 9.6% |
| Gold (GLD) | 18.0% | 29.3% | 0.56 | 8.3% |
| Commodities (DBC) | 46.6% | 20.7% | 1.75 | -25.3% |
| Real Estate (VNQ) | 5.2% | 13.6% | 0.12 | 24.6% |
| Bitcoin (BTCUSD) | -26.0% | 44.9% | -0.54 | -3.5% |
Smart multi-asset allocation framework can stack odds in your favor. Learn How
Based On 5-Year Data
| Annualized Return | Annualized Volatility | Sharpe Ratio | Correlation with MNST | |
|---|---|---|---|---|
| MNST | 13.3% | 24.8% | 0.47 | - |
| Sector ETF (XLP) | 5.7% | 13.7% | 0.19 | 53.2% |
| Equity (SPY) | 13.3% | 17.2% | 0.59 | 39.8% |
| Gold (GLD) | 18.9% | 18.8% | 0.81 | 4.5% |
| Commodities (DBC) | 10.8% | 19.6% | 0.43 | -5.2% |
| Real Estate (VNQ) | 1.0% | 18.9% | -0.05 | 39.4% |
| Bitcoin (BTCUSD) | 12.7% | 52.6% | 0.42 | 12.2% |
Smart multi-asset allocation framework can stack odds in your favor. Learn How
Based On 10-Year Data
| Annualized Return | Annualized Volatility | Sharpe Ratio | Correlation with MNST | |
|---|---|---|---|---|
| MNST | 13.6% | 26.4% | 0.51 | - |
| Sector ETF (XLP) | 7.3% | 14.9% | 0.35 | 57.6% |
| Equity (SPY) | 15.4% | 17.9% | 0.73 | 51.6% |
| Gold (GLD) | 12.2% | 16.4% | 0.61 | 5.6% |
| Commodities (DBC) | 8.3% | 18.1% | 0.37 | 7.7% |
| Real Estate (VNQ) | 4.7% | 20.7% | 0.19 | 44.4% |
| Bitcoin (BTCUSD) | 64.0% | 66.2% | 1.04 | 9.2% |
Smart multi-asset allocation framework can stack odds in your favor. Learn How
Earnings Returns History
Updated 9/9/2026| Forward Returns | |||
|---|---|---|---|
| Earnings Date | 1D Returns | 5D Returns | 21D Returns |
| 8/6/2026 | -4.0% | -0.8% | -6.9% |
| 5/7/2026 | 13.6% | 13.0% | 16.5% |
| 2/26/2026 | -1.6% | -11.5% | -17.1% |
| 11/6/2025 | 5.2% | 7.2% | 10.9% |
| 8/7/2025 | 6.4% | 5.6% | 3.7% |
| 5/8/2025 | 1.4% | 3.6% | 4.8% |
| 2/27/2025 | 5.3% | 7.3% | 11.4% |
| 11/7/2024 | -1.1% | 2.2% | -2.8% |
| ... | |||
| SUMMARY STATS | |||
| # Positive | 15 | 17 | 14 |
| # Negative | 9 | 7 | 10 |
| Median Positive | 5.3% | 4.4% | 6.1% |
| Median Negative | -4.0% | -5.8% | -2.8% |
| Max Positive | 13.6% | 13.0% | 16.5% |
| Max Negative | -10.9% | -11.5% | -17.1% |
| Forward Returns | |||
|---|---|---|---|
| Earnings Date | 1D Returns | 5D Returns | 21D Returns |
| 8/6/2026 | -4.0% | -0.8% | -6.9% |
| 5/7/2026 | 13.6% | 13.0% | 16.5% |
| 2/26/2026 | -1.6% | -11.5% | -17.1% |
| 11/6/2025 | 5.2% | 7.2% | 10.9% |
| 8/7/2025 | 6.4% | 5.6% | 3.7% |
| 5/8/2025 | 1.4% | 3.6% | 4.8% |
| 2/27/2025 | 5.3% | 7.3% | 11.4% |
| 11/7/2024 | -1.1% | 2.2% | -2.8% |
| 8/7/2024 | -10.9% | -8.5% | -3.7% |
| 5/2/2024 | 3.0% | 3.4% | -2.8% |
| 2/28/2024 | 5.8% | 4.4% | 6.1% |
| 11/2/2023 | 5.5% | 4.6% | 4.8% |
| 8/3/2023 | -4.9% | 0.2% | -2.5% |
| 5/4/2023 | 3.3% | 2.5% | 2.5% |
| 2/28/2023 | -2.5% | 1.4% | 2.5% |
| 11/3/2022 | 7.5% | 9.0% | 12.2% |
| 8/4/2022 | -5.2% | -7.3% | -8.3% |
| 5/5/2022 | 4.4% | 3.2% | 10.0% |
| 2/24/2022 | 5.3% | 3.7% | -2.1% |
| 11/4/2021 | 4.4% | 5.1% | -2.4% |
| 8/5/2021 | 5.5% | 6.2% | 6.1% |
| 5/6/2021 | -4.0% | -5.8% | -0.8% |
| 2/25/2021 | 2.8% | -0.8% | 7.4% |
| 11/5/2020 | -0.5% | -0.9% | 4.2% |
| SUMMARY STATS | |||
| # Positive | 15 | 17 | 14 |
| # Negative | 9 | 7 | 10 |
| Median Positive | 5.3% | 4.4% | 6.1% |
| Median Negative | -4.0% | -5.8% | -2.8% |
| Max Positive | 13.6% | 13.0% | 16.5% |
| Max Negative | -10.9% | -11.5% | -17.1% |
SEC Filings
Expand for More| Report Date | Filing Date | Filing |
|---|---|---|
| 06/30/2026 | 08/07/2026 | 10-Q |
| 03/31/2026 | 05/08/2026 | 10-Q |
| 12/31/2025 | 02/27/2026 | 10-K |
| 09/30/2025 | 11/07/2025 | 10-Q |
| 06/30/2025 | 08/08/2025 | 10-Q |
| 03/31/2025 | 05/09/2025 | 10-Q |
| 12/31/2024 | 02/28/2025 | 10-K |
| 09/30/2024 | 11/08/2024 | 10-Q |
| 06/30/2024 | 08/08/2024 | 10-Q |
| 03/31/2024 | 05/07/2024 | 10-Q |
| 12/31/2023 | 02/29/2024 | 10-K |
| 09/30/2023 | 11/06/2023 | 10-Q |
| 06/30/2023 | 08/04/2023 | 10-Q |
| 03/31/2023 | 05/05/2023 | 10-Q |
| 12/31/2022 | 03/01/2023 | 10-K |
| 09/30/2022 | 11/04/2022 | 10-Q |
| Report Date | Filing Date | Filing |
|---|---|---|
| 06/30/2026 | 08/07/2026 | 10-Q |
| 03/31/2026 | 05/08/2026 | 10-Q |
| 12/31/2025 | 02/27/2026 | 10-K |
| 09/30/2025 | 11/07/2025 | 10-Q |
| 06/30/2025 | 08/08/2025 | 10-Q |
| 03/31/2025 | 05/09/2025 | 10-Q |
| 12/31/2024 | 02/28/2025 | 10-K |
| 09/30/2024 | 11/08/2024 | 10-Q |
| 06/30/2024 | 08/08/2024 | 10-Q |
| 03/31/2024 | 05/07/2024 | 10-Q |
| 12/31/2023 | 02/29/2024 | 10-K |
| 09/30/2023 | 11/06/2023 | 10-Q |
| 06/30/2023 | 08/04/2023 | 10-Q |
| 03/31/2023 | 05/05/2023 | 10-Q |
| 12/31/2022 | 03/01/2023 | 10-K |
| 09/30/2022 | 11/04/2022 | 10-Q |
| 06/30/2022 | 08/05/2022 | 10-Q |
| 03/31/2022 | 05/06/2022 | 10-Q |
| 12/31/2021 | 02/28/2022 | 10-K |
| 09/30/2021 | 11/05/2021 | 10-Q |
| 06/30/2021 | 08/09/2021 | 10-Q |
| 03/31/2021 | 05/07/2021 | 10-Q |
| 12/31/2020 | 03/01/2021 | 10-K |
| 09/30/2020 | 11/06/2020 | 10-Q |
| 06/30/2020 | 08/06/2020 | 10-Q |
| 03/31/2020 | 05/11/2020 | 10-Q |
| 12/31/2019 | 02/28/2020 | 10-K |
| 09/30/2019 | 11/08/2019 | 10-Q |
Insider Activity
Updated 7/10/2026| # | Owner | Title | Holding | Action | Filing Date | Price | Shares | Transacted Value | Value of Held Shares | Form |
|---|---|---|---|---|---|---|---|---|---|---|
| 1 | Carling, Guy | CEO, EMEA and OSP | Direct | Sell | 6122026 | 90.90 | 19,000 | 1,727,100 | 1,987,347 | Form |
| 2 | Hall, Mark J | MJCF Hall Family Trust | Sell | 5152026 | 85.81 | 54,000 | 4,633,740 | 25,678,299 | Form | |
| 3 | Tirre, Emelie | Chief Strategy Officer | Direct | Sell | 5152026 | 85.74 | 10,000 | 857,400 | 6,152,960 | Form |
| 4 | Kelly, Thomas J | Chief Financial Officer | Direct | Sell | 5152026 | 87.81 | 7,000 | 614,670 | 5,492,779 | Form |
| 5 | Tirre, Emelie | Chief Strategy Officer | Direct | Sell | 5152026 | 85.96 | 88,700 | 7,624,652 | 7,028,347 | Form |
| # | Owner | Title | Holding | Action | Filing Date | Price | Shares | Transacted Value | Value of Held Shares | Form |
|---|---|---|---|---|---|---|---|---|---|---|
| 1 | Carling, Guy | CEO, EMEA and OSP | Direct | Sell | 6122026 | 90.90 | 19,000 | 1,727,100 | 1,987,347 | Form |
| 2 | Hall, Mark J | MJCF Hall Family Trust | Sell | 5152026 | 85.81 | 54,000 | 4,633,740 | 25,678,299 | Form | |
| 3 | Tirre, Emelie | Chief Strategy Officer | Direct | Sell | 5152026 | 85.74 | 10,000 | 857,400 | 6,152,960 | Form |
| 4 | Kelly, Thomas J | Chief Financial Officer | Direct | Sell | 5152026 | 87.81 | 7,000 | 614,670 | 5,492,779 | Form |
| 5 | Tirre, Emelie | Chief Strategy Officer | Direct | Sell | 5152026 | 85.96 | 88,700 | 7,624,652 | 7,028,347 | Form |
| 6 | Kelly, Thomas J | Chief Financial Officer | Direct | Sell | 3172026 | 77.22 | 8,000 | 617,760 | 4,731,501 | Form |
| 7 | Tirre, Emelie | Chief Commercial Officer | Direct | Sell | 12162025 | 73.31 | 30,000 | 2,199,300 | 4,687,368 | Form |
| 8 | Sacks, Rodney C | Hilrod Holdings XVIII, L.P. | Sell | 12162025 | 73.58 | 16,997 | 1,250,639 | 26,558,554 | Form | |
| 9 | Sacks, Rodney C | Hilrod Holdings XXIII, L.P. | Sell | 12162025 | 73.58 | 52,342 | Form | |||
| 10 | Sacks, Rodney C | Hilrod Holdings XXVI, L.P. | Sell | 12162025 | 73.58 | 137,204 | 10,095,470 | 21,060,656 | Form | |
| 11 | Carling, Guy | President of EMEA & OSP | Direct | Sell | 11172025 | 71.33 | 38,438 | 2,741,783 | 1,568,761 | Form |
| 12 | Vidergauz, Mark | Direct | Sell | 8152025 | 63.73 | 10,000 | 637,300 | 3,262,402 | Form |
Investor Activity (13F)
Updated Sep 23, 2026Active managers (13F portfolio over $250M, at least 3 holdings) with a position over $5M that is either over 10% of their portfolio or held in a concentrated book of 50 or fewer total positions. Index/ETF, sovereign, bank, community-bank and charitable/donor-advised filers are excluded.
| Active Manager |
|---|
Monster Beverage — Investor Video Playlist


Industry Resources
| Consumer Staples Resources |
| FoodNavigator |
| Consumer Goods Technology (CGT) |
| Beverage Digest |
| Soft Drinks & Non-alcoholic Beverages Resources |
| Beverage Daily |
| BevNET |
| Beverage Industry |
External Quote Links
| Y Finance | Barrons |
| TradingView | Morningstar |
| SeekingAlpha | ValueLine |
| Motley Fool | Robinhood |
| CNBC | Etrade |
| MarketWatch | Unusual Whales |
| YCharts | Perplexity Finance |
| FinViz |
Prefer one of these to Trefis? Tell us why.