
Casey's General Stores (CASY)
Market Price (9/25/2026): $596.02 | Market Cap: $-Investor Relations Sector: Consumer Staples | Industry: Food Retail
Casey's General Stores (CASY)
Market Price (9/25/2026): $596.02Market Cap: $-Sector: Consumer StaplesIndustry: Food Retail
Investment Highlights Why It Matters Detailed financial logic regarding cash flow yields vs trend-riding momentum.
Low stock price volatilityVol 12M is 37% | Key risksCASY key risks include [1] significant margin pressure from its heavy dependence on volatile fuel sales and [2] a long-term structural threat to fuel demand from the consumer shift toward electric vehicles. |
| Low stock price volatilityVol 12M is 37% |
| Key risksCASY key risks include [1] significant margin pressure from its heavy dependence on volatile fuel sales and [2] a long-term structural threat to fuel demand from the consumer shift toward electric vehicles. |
Qualitative Assessment
AI Analysis | Feedback
Casey's General Stores (CASY) stock has lost about 20% since 5/31/2026 because of the following key factors:
1. Investor concerns over slowing fiscal year 2027 (FY27) guidance, despite strong fiscal Q4 2026 and fiscal Q1 2027 results.
Casey's General Stores reported strong fiscal Q4 2026 results on June 9, 2026, with diluted EPS up 66.2% year-over-year to $4.37, exceeding estimates. However, management's projection for fiscal 2027 (ending April 30, 2027) indicated an anticipated EBITDA growth of 8% to 10%, a "sharp deceleration" from the approximately 23% growth achieved in fiscal 2026. This conservative outlook continued to weigh on the stock, exacerbated after the fiscal Q1 2027 earnings release on September 8, 2026, where despite beating analyst estimates with diluted EPS of $7.37 (up 27.7% year-over-year) and revenue of $5.68 billion (up 24.3% year-over-year), the company maintained its prior full-year guidance for FY27. This lack of an improved outlook, despite the strong quarterly performance, triggered a "sell-the-news" reaction, contributing significantly to the stock's decline.
2. Premium valuation and elevated market expectations led to a significant reset.
Prior to the stock's decline, Casey's General Stores reached a 52-week high of $927.85 in mid-June 2026. Analysts and investors expressed concerns that the stock was trading at a "premium valuation," with a trailing price-to-earnings (P/E) ratio of 29.94 around the time of the fiscal Q1 2027 earnings release. Despite consistently strong operational performance and earnings beats, market expectations were considered "elevated" and "skewed toward the high end of the company's guidance range". This led to a substantial correction as investors "reset expectations" in response to the unchanged fiscal 2027 guidance and perceived stretched valuation. The stock experienced a single-session drop of approximately 5.4% in late August and fell over 14% on September 9, 2026, following the Q1 FY27 report.
Show more
Casey's General Stores (CASY) stock has lost about 20% since 5/31/2026 because of the following key factors:
1. Investor concerns over slowing fiscal year 2027 (FY27) guidance, despite strong fiscal Q4 2026 and fiscal Q1 2027 results.
Casey's General Stores reported strong fiscal Q4 2026 results on June 9, 2026, with diluted EPS up 66.2% year-over-year to $4.37, exceeding estimates. However, management's projection for fiscal 2027 (ending April 30, 2027) indicated an anticipated EBITDA growth of 8% to 10%, a "sharp deceleration" from the approximately 23% growth achieved in fiscal 2026. This conservative outlook continued to weigh on the stock, exacerbated after the fiscal Q1 2027 earnings release on September 8, 2026, where despite beating analyst estimates with diluted EPS of $7.37 (up 27.7% year-over-year) and revenue of $5.68 billion (up 24.3% year-over-year), the company maintained its prior full-year guidance for FY27. This lack of an improved outlook, despite the strong quarterly performance, triggered a "sell-the-news" reaction, contributing significantly to the stock's decline.
2. Premium valuation and elevated market expectations led to a significant reset.
Prior to the stock's decline, Casey's General Stores reached a 52-week high of $927.85 in mid-June 2026. Analysts and investors expressed concerns that the stock was trading at a "premium valuation," with a trailing price-to-earnings (P/E) ratio of 29.94 around the time of the fiscal Q1 2027 earnings release. Despite consistently strong operational performance and earnings beats, market expectations were considered "elevated" and "skewed toward the high end of the company's guidance range". This led to a substantial correction as investors "reset expectations" in response to the unchanged fiscal 2027 guidance and perceived stretched valuation. The stock experienced a single-session drop of approximately 5.4% in late August and fell over 14% on September 9, 2026, following the Q1 FY27 report.
3. Reduction in free cash flow raised concerns about future capital spending and cash generation.
Alongside the maintained fiscal 2027 guidance, the fiscal Q1 2027 earnings report highlighted a decrease in free cash flow, which fell to $190 million, down from $262 million in the same period a year prior. While operating cash flow remained robust at $384 million, the decline in free cash flow fueled investor apprehension regarding the company's cash generation capabilities and its implications for future capital spending, despite ambitious growth targets outlined in the September 2026 investor presentation. This specific financial metric contributed to a broader investor concern about the company's outlook and cash generation, further pressuring the stock.
Show less
Stock Movement Drivers
Fundamental Drivers
nullnull
Market Drivers
5/31/2026 to 9/24/2026| Return | Correlation | |
|---|---|---|
| CASY | -21.9% | |
| Market (SPY) | 1.7% | -23.6% |
| Sector (XLP) | -0.8% | 27.9% |
Fundamental Drivers
nullnull
Market Drivers
2/28/2026 to 9/24/2026| Return | Correlation | |
|---|---|---|
| CASY | -12.5% | |
| Market (SPY) | 12.4% | -1.5% |
| Sector (XLP) | -8.1% | 29.7% |
Fundamental Drivers
nullnull
Market Drivers
8/31/2025 to 9/24/2026| Return | Correlation | |
|---|---|---|
| CASY | 21.5% | |
| Market (SPY) | 20.3% | -1.5% |
| Sector (XLP) | 3.9% | 31.1% |
Fundamental Drivers
nullnull
Market Drivers
8/31/2023 to 9/24/2026| Return | Correlation | |
|---|---|---|
| CASY | 148.4% | |
| Market (SPY) | 76.8% | 21.1% |
| Sector (XLP) | 21.8% | 28.8% |
Price Returns Compared
| 2021 | 2022 | 2023 | 2024 | 2025 | 2026 | Total [1] | |
|---|---|---|---|---|---|---|---|
| Returns | |||||||
| CASY Return | 11% | 14% | 23% | 45% | 40% | 8% | 246% |
| Peers Return | 46% | 3% | 22% | 36% | -1% | -1% | 143% |
| S&P 500 Return | 27% | -19% | 24% | 23% | 16% | 13% | 105% |
Monthly Win Rates [3] | |||||||
| CASY Win Rate | 75% | 67% | 67% | 75% | 58% | 67% | |
| Peers Win Rate | 65% | 48% | 67% | 57% | 58% | 47% | |
| S&P 500 Win Rate | 75% | 42% | 67% | 75% | 67% | 56% | |
Max Drawdowns [4] | |||||||
| CASY Max Drawdown | -19% | -16% | -13% | -9% | -14% | -36% | |
| Peers Max Drawdown | -18% | -27% | -12% | -13% | -23% | -25% | |
| S&P 500 Max Drawdown | -5% | -25% | -10% | -8% | -19% | -9% | |
[1] Cumulative total returns since the beginning of 2021
[2] Peers: MUSA, KR, ACI, WMT, COST. See CASY Returns vs. Peers.
[3] Win Rate = % of calendar months in which monthly returns were positive
[4] Max drawdown represents maximum peak-to-trough decline within a year
[5] 2026 data is for the year up to 9/24/2026 (YTD)
How Low Can It Go
| Event | CASY | S&P 500 |
|---|---|---|
| 2025 US Tariff Shock | ||
| % Loss | -11.1% | -18.8% |
| % Gain to Breakeven | 12.5% | 23.1% |
| Time to Breakeven | 16 days | 79 days |
| 2022 Inflation Shock & Fed Tightening | ||
| % Loss | -12.7% | -24.5% |
| % Gain to Breakeven | 14.6% | 32.4% |
| Time to Breakeven | 20 days | 427 days |
| 2020 COVID-19 Crash | ||
| % Loss | -30.7% | -33.7% |
| % Gain to Breakeven | 44.3% | 50.9% |
| Time to Breakeven | 133 days | 140 days |
| 2011 US Debt Ceiling Crisis & European Contagion | ||
| % Loss | -14.4% | -17.9% |
| % Gain to Breakeven | 16.9% | 21.8% |
| Time to Breakeven | 23 days | 123 days |
| 2010 Eurozone Sovereign Debt Crisis / Flash Crash | ||
| % Loss | -10.6% | -15.4% |
| % Gain to Breakeven | 11.9% | 18.2% |
| Time to Breakeven | 69 days | 125 days |
| 2008-2009 Global Financial Crisis | ||
| % Loss | -39.3% | -53.4% |
| % Gain to Breakeven | 64.8% | 114.4% |
| Time to Breakeven | 188 days | 1085 days |
In The Past
Casey's General Stores's stock fell -11.1% during the 2025 US Tariff Shock. Such a loss loss requires a 12.5% gain to breakeven.
Preserve Wealth
Limiting losses and compounding gains is essential to preserving wealth.
Asset Allocation
Actively managed asset allocation strategies protect wealth. Learn more.
| Event | CASY | S&P 500 |
|---|---|---|
| 2020 COVID-19 Crash | ||
| % Loss | -30.7% | -33.7% |
| % Gain to Breakeven | 44.3% | 50.9% |
| Time to Breakeven | 133 days | 140 days |
| 2008-2009 Global Financial Crisis | ||
| % Loss | -39.3% | -53.4% |
| % Gain to Breakeven | 64.8% | 114.4% |
| Time to Breakeven | 188 days | 1085 days |
In The Past
Casey's General Stores's stock fell -11.1% during the 2025 US Tariff Shock. Such a loss loss requires a 12.5% gain to breakeven.
Preserve Wealth
Limiting losses and compounding gains is essential to preserving wealth.
Asset Allocation
Actively managed asset allocation strategies protect wealth. Learn more.
About Casey's General Stores (CASY)
Casey's General Stores, Inc. (CASY) operates a large chain of convenience stores primarily across the United States. Founded in 1959, the company manages approximately 2,400 locations under the Casey's and Casey's General Store names. Its core business model centers on providing a convenient one-stop shop for both motor fuel and an extensive array of everyday essentials, positioning itself as a vital retail presence in the communities it serves.
The company's offerings are diverse, encompassing two primary categories: fuel and in-store merchandise. On the fuel side, Casey's provides self-service gasoline and diesel fuel. Inside the stores, a significant differentiator is its robust freshly prepared food program, featuring popular items like pizza, donuts, and sandwiches. This is complemented by a wide selection of convenience items including tobacco and nicotine products, soft drinks, snacks, candy, packaged bakery goods, health and beauty aids, automotive products, beer, wine, spirits, and lottery tickets, among others. The company also operates a small number of specialized stores, such as Tobacco City and liquor stores.
Casey's primarily serves a broad customer base of everyday consumers and travelers seeking convenience and value in local communities and along major routes throughout the United States. Its primary markets are the regions surrounding its store locations, catering to residents and commuters looking for quick access to fuel, groceries, snacks, and prepared meals. The company's strategy focuses on efficiently meeting daily consumer needs, establishing itself as an essential part of the local retail landscape in its operational areas.
AI Analysis | Feedback
Here are 1-3 brief analogies for Casey's General Stores:
- It's like a 7-Eleven that has significantly expanded its fresh food menu to include items like pizza and donuts, alongside fuel and typical convenience store offerings.
- Think of it as the Midwest's version of a Wawa or Sheetz, combining gas, a wide range of convenience store items, and a strong emphasis on freshly prepared foods.
AI Analysis | Feedback
- Freshly Prepared Foods: Offers a selection of items like pizza, donuts, and sandwiches made fresh for customers.
- Motor Fuel: Provides self-service gasoline and diesel fuel for vehicles.
- Tobacco & Nicotine Products: Sells a variety of tobacco and nicotine products, including through specialized stores.
- Beverages: Features a wide selection of soft drinks, coffee, tea, dairy products, and alcoholic beverages like beer, wine, and spirits.
- Snacks & Packaged Groceries: Includes snacks, candy, packaged bakery items, ice cream, and other convenience grocery products.
- General Merchandise: Sells a range of non-food items such as health and beauty aids, automotive products, and electronic accessories.
- Convenience Services: Provides services like lotto/lottery tickets and prepaid cards.
AI Analysis | Feedback
Casey's General Stores (CASY) primarily sells directly to individuals through its network of convenience stores. Its major customer categories include:
-
Commuters and Travelers: Individuals who stop at Casey's locations for motor fuel, quick snacks, beverages, coffee, and grab-and-go meals while on their daily commutes or longer journeys. This group values speed, convenience, and accessibility.
-
Local Residents and Households: People living in the communities served by Casey's stores who rely on them for everyday essentials, including groceries (milk, bread, etc.), freshly prepared foods (pizza, donuts, sandwiches), tobacco products, lottery tickets, and other household convenience items. This segment appreciates the proximity and extended operating hours.
-
On-the-go Consumers: This category encompasses individuals such as workers, students, or anyone seeking quick meals, snacks, coffee, or beverages throughout their day. They often utilize Casey's for its freshly prepared food options and convenient selection of drinks and treats.
AI Analysis | Feedback
AI Analysis | Feedback
Darren Rebelez, Chairman of the Board, Chief Executive Officer and President
Darren Rebelez was appointed CEO in June 2019. Prior to joining Casey's, he served as President of IHOP Restaurants and as Executive Vice President and Chief Operating Officer at 7-Eleven. He also held various leadership roles at ExxonMobil Corporation, Thornton Oil Corp, and KFC (when it was owned by PepsiCo). Rebelez is a graduate of the U.S. Military Academy at West Point, a Gulf War veteran (Army Ranger), and holds an MBA from the University of Houston. He serves on the board of directors of Genuine Parts Company and as an advisory board member for the Children of Fallen Patriots Foundation.
Stephen P. Bramlage, Jr., Chief Financial Officer and Principal Accounting Officer
Stephen P. Bramlage, Jr. was appointed CFO in 2020. His previous roles include EVP & CFO at Aramark and SVP & CFO at Owens-Illinois. He also held various financial positions at PPG Industries, Eli-Lilly, and EY. Bramlage holds an MBA from Northwestern University and a Bachelor of Science from the University of Dayton. He also serves on the board of directors for Cracker Barrel Old Country Store, Inc.
Ena Williams, Chief Operations Officer
Ena Williams serves as the Chief Operations Officer of Casey's General Stores.
Thomas P Brennan, Chief Merchandising Officer
Thomas P Brennan is the Chief Merchandising Officer at Casey's General Stores.
Chad Michael Frazell, Chief Human Resources Officer
Chad Michael Frazell holds the position of Chief Human Resources Officer at Casey's General Stores.
```AI Analysis | Feedback
Key Risks to Casey's General Stores (CASY)
- Dependence on Fuel Sales and the Transition to Electric Vehicles: Casey's General Stores' financial performance is significantly influenced by its fuel sales, which are subject to volatile market prices and fluctuating consumer demand. The company's reliance on fuel sales poses a risk due to external factors such as changes in oil prices and the long-term structural threat of consumers shifting towards more fuel-efficient or electric vehicles (EVs). This dependence could impact the company's overall financial stability in the face of evolving industry trends.
- Intense Industry Competition: The convenience store industry is highly competitive, with Casey's facing competition from national chains, supermarkets, drugstores, discount stores, and non-traditional retailers. This competitive landscape impacts Casey's revenue and profitability, as various players vie for market share. Maintaining market position requires continuous innovation and adaptation regarding price, location, product offerings, and service quality.
- Operational, Legal, and Security Risks: As a company with a vast network of stores and internal operations, Casey's faces inherent operational risks, including those associated with managing a large workforce. The company is also exposed to legal challenges, such as ongoing lawsuits related to the misclassification of Store Managers, which could result in financial liabilities and reputational damage. Furthermore, convenience stores and gas stations, like those operated by Casey's, are susceptible to significant security risks, including robberies, thefts, antisocial behavior, and potential gun violence, which can endanger employees and customers and lead to losses.
AI Analysis | Feedback
The rapid expansion and adoption of e-commerce, particularly for grocery and meal delivery services, presents another clear emerging threat. These services increasingly offer consumers the convenience of having goods delivered directly to their homes, reducing the need for impromptu stops at convenience stores for packaged goods, snacks, beverages, and even freshly prepared meals. Services like Instacart, DoorDash, Uber Eats, and grocery store delivery compete directly with Casey's convenience proposition across multiple product categories.
AI Analysis | Feedback
Casey's General Stores operates within several large addressable markets across the United States for its main products and services.
The overall **U.S. convenience store industry** recorded total sales of $837.4 billion in 2024, which includes both fuel and in-store items. Within this, **in-store sales** (excluding fuel) for U.S. convenience stores reached $335.5 billion in 2024.
For specific product categories:
- Motor Fuel: Fuel sales at U.S. convenience stores amounted to $501.9 billion in 2024. Convenience stores sell an estimated 80% of the fuel purchased in the U.S.
- Foodservice (including freshly prepared foods like pizza, donuts, and sandwiches): The U.S. convenience store foodservice market is projected to reach $78.1 billion in 2026. In 2024, foodservice accounted for 27.7% of in-store sales at convenience stores.
- Tobacco and Nicotine Products: The U.S. tobacco market was valued at approximately $85.93 billion in 2024 and is projected to grow to $88.85 billion in 2025.
- Packaged Beverages (excluding beer, wine, and liquor): Sales of packaged beverages in U.S. convenience stores constituted 17.9% of in-store sales in 2024, which translates to approximately $60.03 billion (based on $335.5 billion in-store sales).
- Convenience Food (including snacks, packaged bakery, and other food items): The U.S. convenience food market was valued at $186.40 billion in 2025.
AI Analysis | Feedback
Casey's General Stores (CASY) is anticipated to drive future revenue growth over the next 2-3 years through several key initiatives:
- Strategic Store Expansion: The company is pursuing an aggressive expansion strategy, aiming to add approximately 500 new locations by the end of fiscal year 2026. This growth will be achieved through a combination of strategic mergers and acquisitions, such as the acquisition of 198 CEFCO convenience stores in November 2024, and organic development, with plans to open at least 80 new stores in fiscal year 2026. These expansions particularly bolster Casey's presence in southern markets like Texas, Alabama, Florida, and Mississippi.
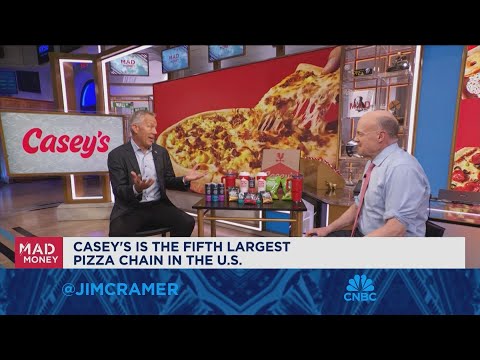
- Growth in Prepared Foods and Dispensed Beverages: A significant driver of revenue and profitability is Casey's high-margin prepared food business. The company, recognized as the fifth-largest pizza chain in the U.S., saw its prepared food and dispensed beverages contribute 58% of inside-store gross profit in the first quarter of fiscal year 2025. Ongoing product innovation, including new menu items like thin crust pizza and an expanded lunch sandwich menu, along with the rollout of wings to over 550 stores, is expected to continue boosting sales in this category. Prepared food and dispensed beverage same-store sales increased by 4.3% in Q3 FY2026.
- Leveraging Casey's Rewards Loyalty Program and Digital Engagement: With over 10 million members by Q3 FY2026, the Casey's Rewards loyalty program is a crucial tool for enhancing customer engagement and driving repeat business through personalized offers. The company is also focusing on strengthening its omnichannel presence and digital sales capabilities, which contributed to a 20% increase in digital sales in Q3 FY2024.
- Sustained Inside Sales Growth: Beyond prepared foods, overall inside sales, including grocery and general merchandise, are expected to contribute to revenue growth. Casey's projects inside same-store sales to increase between 3.5% and 4.5% for fiscal year 2026. Specific categories like energy drinks and nicotine alternatives are outperforming, showing double-digit growth within grocery and general merchandise.
- Optimizing Fuel Volume and Margin Management: While fuel revenue can be subject to market volatility, increasing fuel gallons sold and maintaining strong fuel margins are key contributors to overall gross profit. In Q3 FY2026, same-store fuel gallons sold increased by 0.4%, and the company achieved a fuel margin exceeding $0.40 per gallon. Casey's strategy includes increasing its capacity to haul fuel in its own trucks and expanding business-to-business relationships to maintain a strategic advantage.
AI Analysis | Feedback
Share Repurchases
- Casey's General Stores repurchased approximately $76 million of shares during the third quarter of fiscal year 2026 (ended January 31, 2026).
- As of March 9, 2026, the company had approximately $157 million remaining under its existing share repurchase authorization.
- Annual share buybacks amounted to $104.898 million in fiscal year 2024 and $734,000 in fiscal year 2025.
Share Issuance
- Casey's shares outstanding saw a slight increase in fiscal year 2023 (0.44% from 2022) due to capital-preserving activity prior to the Fikes acquisition.
Outbound Investments
- The company plans to open at least 80 stores in fiscal year 2026 through a mix of mergers and acquisitions (M&A) and new store construction, aiming for approximately 500 new stores over a three-year strategic plan period.
- Casey's has acquired 394 stores in the last three years (as of March 10, 2026), significantly accelerating its M&A strategy.
- Acquisitions of businesses resulted in cash outflows of approximately $1,239.25 million, $330.03 million, $85.57 million, and $901.64 million in various periods, including the Fikes and CEFCO acquisitions.
Capital Expenditures
- Capital expenditures averaged $454.5 million annually from fiscal years 2021 to 2025.
- Actual capital expenditures were $441.3 million in fiscal year 2021, $326.5 million in fiscal year 2022, $476.6 million in fiscal year 2023, $522.0 million in fiscal year 2024, and $506.2 million in fiscal year 2025.
- Expected capital expenditures for fiscal year 2026 (purchase of property and equipment) are approximately $600 million, primarily focused on store base expansion, prepared foods innovation, and growing the wings platform.
Peer Outperformance in Food Retail
| Industry | Names | 1Y med | 3Y med | 5Y med | Top 3 by 5Y |
|---|---|---|---|---|---|
| Consumer Staples Merchandise Retail | 12 | 5.6% | 39.9% | 54.4% | NGVC 232% · VLGEA 148% · WMT 140% |
| Food Retail ← | 6 | -8.1% | 42.3% | 44.4% | CASY 225% · SFM 192% · KR 64% |
| Tobacco | 6 | -39.5% | 7.7% | 30.6% | PM 138% · MO 109% · TPB 39% |
| Food Distributors | 9 | -1.7% | 31.3% | 10.9% | CHEF 244% · USFD 165% · ANDE 141% |
| Soft Drinks & Non-alcoholic Beverages | 12 | -8.1% | -18.1% | 0.8% | COKE 409% · BRFH 143% · CCHGY 113% |
| Brewers | 3 | -16.2% | -35.7% | -7.8% | BUD 43% · TAP -8% · SAM -68% |
| Agricultural Products & Services | 12 | 4.8% | 2.2% | -15.5% | BG 60% · ADM 58% · INGR 25% |
| Household Products | 19 | 2.9% | -9.2% | -16.5% | ACU 106% · IPAR 84% · CL 25% |
| Personal Care Products | 4 | -1.6% | -5.8% | -25.9% | ELF 245% · PG 15% · COTY -67% |
| Packaged Foods & Meats | 47 | -27.5% | -34.4% | -42.3% | MAMA 457% · SENEA 286% · LWAY 279% |
| Distillers & Vintners | 5 | -46.5% | -60.5% | -79.2% | STZ -41% · BF-B -57% · SNDL -79% |
| Drug Retail | 3 | -41.1% | -85.7% | -93.5% | HITI -58% · PETS -94% · SCNX -99% |
Latest Trefis Analyses
Research & Analysis
Invest in Strategies
Wealth Management
Peer Comparisons
| Peers to compare with: |
Financials
| Median | |
|---|---|
| Name | |
| Mkt Price | 313.44 |
| Mkt Cap | 35.7 |
| Rev LTM | 149,326 |
| Op Inc LTM | 2,083 |
| FCF LTM | 2,384 |
| FCF 3Y Avg | 2,118 |
| CFO LTM | 6,708 |
| CFO 3Y Avg | 6,205 |
Growth & Margins
| Median | |
|---|---|
| Name | |
| Rev Chg LTM | 6.2% |
| Rev Chg 3Y Avg | 2.0% |
| Rev Chg Q | 5.9% |
| QoQ Delta Rev Chg LTM | 1.5% |
| Op Inc Chg LTM | 11.3% |
| Op Inc Chg 3Y Avg | 4.7% |
| Op Mgn LTM | 3.8% |
| Op Mgn 3Y Avg | 3.7% |
| QoQ Delta Op Mgn LTM | 0.0% |
| CFO/Rev LTM | 4.6% |
| CFO/Rev 3Y Avg | 4.3% |
| FCF/Rev LTM | 1.8% |
| FCF/Rev 3Y Avg | 1.9% |
Valuation
| Median | |
|---|---|
| Name | |
| Mkt Cap | 35.7 |
| P/S | 0.4 |
| P/Op Inc | 17.1 |
| P/EBIT | 17.8 |
| P/E | 38.8 |
| P/CFO | 9.7 |
| Total Yield | 5.5% |
| Dividend Yield | 0.9% |
| FCF Yield 3Y Avg | 5.0% |
| D/E | 0.3 |
| Net D/E | 0.3 |
Returns
| Median | |
|---|---|
| Name | |
| 1M Rtn | -4.0% |
| 3M Rtn | -5.8% |
| 6M Rtn | -13.7% |
| 12M Rtn | 0.5% |
| 3Y Rtn | 59.9% |
| 1M Excs Rtn | -4.4% |
| 3M Excs Rtn | -10.5% |
| 6M Excs Rtn | -30.6% |
| 12M Excs Rtn | -15.0% |
| 3Y Excs Rtn | -12.7% |
Comparison Analyses
Price Behavior
| Market Price | $598.85 | |
| Market Cap ($ Bil) | 22.1 | |
| First Trading Date | 10/20/1983 | |
| Distance from 52W High | -34.6% | |
| 50 Days | 200 Days | |
| DMA Price | $775.19 | $729.79 |
| DMA Trend | up | down |
| Distance from DMA | -22.7% | -17.9% |
| 3M | 1YR | |
| Volatility | 44.4% | 37.5% |
| Downside Capture | 30.48 | -1.73 |
| Upside Capture | -108.49 | 9.46 |
| Correlation (SPY) | -11.0% | -1.7% |
| 1M | 2M | 3M | 6M | 1Y | 3Y | |
|---|---|---|---|---|---|---|
| Beta | -0.41 | -1.15 | -1.33 | -0.14 | -0.10 | 0.44 |
| Up Beta | 0.17 | 0.48 | 0.43 | 0.86 | 0.41 | 0.49 |
| Down Beta | 1.47 | -1.35 | -2.26 | -0.96 | -0.62 | 0.43 |
| Up Capture | -171% | -145% | -119% | -8% | 15% | 28% |
| Bmk +ve Days | 10 | 21 | 32 | 68 | 138 | 427 |
| Stock +ve Days | 8 | 20 | 29 | 63 | 130 | 391 |
| Down Capture | 74% | -207% | -202% | -51% | -56% | 44% |
| Bmk -ve Days | 11 | 21 | 32 | 59 | 113 | 324 |
| Stock -ve Days | 13 | 22 | 35 | 64 | 121 | 360 |
[1] Upside and downside betas calculated using positive and negative benchmark daily returns respectively
Based On 1-Year Data
| Annualized Return | Annualized Volatility | Sharpe Ratio | Correlation with CASY | |
|---|---|---|---|---|
| CASY | 9.1% | 37.5% | 0.30 | - |
| Sector ETF (XLP) | 6.5% | 14.4% | 0.20 | 31.3% |
| Equity (SPY) | 16.7% | 13.0% | 0.92 | -1.8% |
| Gold (GLD) | 13.1% | 29.3% | 0.42 | -2.1% |
| Commodities (DBC) | 45.1% | 20.7% | 1.71 | 0.4% |
| Real Estate (VNQ) | 3.7% | 13.7% | 0.01 | 16.1% |
| Bitcoin (BTCUSD) | -24.8% | 44.8% | -0.51 | -1.5% |
Smart multi-asset allocation framework can stack odds in your favor. Learn How
Based On 5-Year Data
| Annualized Return | Annualized Volatility | Sharpe Ratio | Correlation with CASY | |
|---|---|---|---|---|
| CASY | 26.2% | 29.3% | 0.81 | - |
| Sector ETF (XLP) | 5.4% | 13.7% | 0.18 | 36.7% |
| Equity (SPY) | 12.9% | 17.2% | 0.57 | 30.2% |
| Gold (GLD) | 19.0% | 18.8% | 0.82 | 2.6% |
| Commodities (DBC) | 10.6% | 19.6% | 0.42 | 0.2% |
| Real Estate (VNQ) | 0.7% | 18.9% | -0.07 | 29.4% |
| Bitcoin (BTCUSD) | 12.0% | 52.6% | 0.41 | 11.5% |
Smart multi-asset allocation framework can stack odds in your favor. Learn How
Based On 10-Year Data
| Annualized Return | Annualized Volatility | Sharpe Ratio | Correlation with CASY | |
|---|---|---|---|---|
| CASY | 18.4% | 28.8% | 0.63 | - |
| Sector ETF (XLP) | 7.3% | 14.9% | 0.35 | 44.6% |
| Equity (SPY) | 15.5% | 17.9% | 0.73 | 40.6% |
| Gold (GLD) | 12.0% | 16.4% | 0.60 | 2.3% |
| Commodities (DBC) | 8.5% | 18.1% | 0.39 | 8.2% |
| Real Estate (VNQ) | 4.8% | 20.7% | 0.19 | 38.7% |
| Bitcoin (BTCUSD) | 63.7% | 66.2% | 1.03 | 8.5% |
Smart multi-asset allocation framework can stack odds in your favor. Learn How
Returns Analyses
Earnings Returns History
Updated 9/17/2026| Forward Returns | |||
|---|---|---|---|
| Earnings Date | 1D Returns | 5D Returns | 21D Returns |
| 9/8/2026 | -14.2% | -20.0% | |
| 6/9/2026 | 20.3% | 13.7% | 7.7% |
| 3/9/2026 | 3.8% | 1.3% | 14.1% |
| 12/9/2025 | -5.3% | -1.9% | 5.4% |
| 9/8/2025 | 3.8% | 6.4% | 6.4% |
| 6/9/2025 | 11.6% | 15.3% | 17.6% |
| 3/11/2025 | 6.2% | 2.2% | 16.1% |
| 12/9/2024 | -0.3% | 1.5% | -7.7% |
| ... | |||
| SUMMARY STATS | |||
| # Positive | 11 | 14 | 16 |
| # Negative | 14 | 11 | 8 |
| Median Positive | 7.4% | 5.8% | 7.1% |
| Median Negative | -3.1% | -5.1% | -6.3% |
| Max Positive | 20.3% | 17.6% | 18.1% |
| Max Negative | -14.2% | -20.0% | -9.8% |
| Forward Returns | |||
|---|---|---|---|
| Earnings Date | 1D Returns | 5D Returns | 21D Returns |
| 9/8/2026 | -14.2% | -20.0% | |
| 6/9/2026 | 20.3% | 13.7% | 7.7% |
| 3/9/2026 | 3.8% | 1.3% | 14.1% |
| 12/9/2025 | -5.3% | -1.9% | 5.4% |
| 9/8/2025 | 3.8% | 6.4% | 6.4% |
| 6/9/2025 | 11.6% | 15.3% | 17.6% |
| 3/11/2025 | 6.2% | 2.2% | 16.1% |
| 12/9/2024 | -0.3% | 1.5% | -7.7% |
| 9/4/2024 | 7.4% | 5.3% | 3.4% |
| 6/11/2024 | 16.7% | 15.4% | 15.3% |
| 3/11/2024 | -1.6% | 2.1% | 4.5% |
| 12/11/2023 | -0.4% | -0.9% | 4.9% |
| 9/11/2023 | 11.2% | 17.6% | 15.5% |
| 6/6/2023 | -2.9% | -1.6% | 8.2% |
| 3/7/2023 | 3.9% | -0.3% | 2.4% |
| 12/6/2022 | 7.4% | 6.3% | -3.0% |
| 9/7/2022 | -0.7% | -3.0% | -8.2% |
| 6/7/2022 | -4.0% | -9.8% | -5.9% |
| 3/8/2022 | 7.8% | 7.9% | 18.1% |
| 12/7/2021 | -6.9% | -5.2% | -2.0% |
| 9/7/2021 | -4.8% | -5.6% | -6.7% |
| 6/8/2021 | -4.6% | -5.1% | -9.8% |
| 3/8/2021 | -2.4% | 3.0% | 6.6% |
| 12/7/2020 | -3.4% | -7.9% | -1.5% |
| 9/8/2020 | -2.2% | 1.3% | 3.9% |
| SUMMARY STATS | |||
| # Positive | 11 | 14 | 16 |
| # Negative | 14 | 11 | 8 |
| Median Positive | 7.4% | 5.8% | 7.1% |
| Median Negative | -3.1% | -5.1% | -6.3% |
| Max Positive | 20.3% | 17.6% | 18.1% |
| Max Negative | -14.2% | -20.0% | -9.8% |
SEC Filings
Expand for More| Report Date | Filing Date | Filing |
|---|---|---|
| 07/31/2026 | 09/08/2026 | 10-Q |
| 04/30/2026 | 06/22/2026 | 10-K |
| 01/31/2026 | 03/09/2026 | 10-Q |
| 10/31/2025 | 12/09/2025 | 10-Q |
| 07/31/2025 | 09/08/2025 | 10-Q |
| 04/30/2025 | 06/23/2025 | 10-K |
| 01/31/2025 | 03/11/2025 | 10-Q |
| 10/31/2024 | 12/09/2024 | 10-Q |
| 07/31/2024 | 09/04/2024 | 10-Q |
| 04/30/2024 | 06/24/2024 | 10-K |
| 01/31/2024 | 03/11/2024 | 10-Q |
| 10/31/2023 | 12/11/2023 | 10-Q |
| 07/31/2023 | 09/11/2023 | 10-Q |
| 04/30/2023 | 06/23/2023 | 10-K |
| 01/31/2023 | 03/07/2023 | 10-Q |
| 10/31/2022 | 12/06/2022 | 10-Q |
| Report Date | Filing Date | Filing |
|---|---|---|
| 07/31/2026 | 09/08/2026 | 10-Q |
| 04/30/2026 | 06/22/2026 | 10-K |
| 01/31/2026 | 03/09/2026 | 10-Q |
| 10/31/2025 | 12/09/2025 | 10-Q |
| 07/31/2025 | 09/08/2025 | 10-Q |
| 04/30/2025 | 06/23/2025 | 10-K |
| 01/31/2025 | 03/11/2025 | 10-Q |
| 10/31/2024 | 12/09/2024 | 10-Q |
| 07/31/2024 | 09/04/2024 | 10-Q |
| 04/30/2024 | 06/24/2024 | 10-K |
| 01/31/2024 | 03/11/2024 | 10-Q |
| 10/31/2023 | 12/11/2023 | 10-Q |
| 07/31/2023 | 09/11/2023 | 10-Q |
| 04/30/2023 | 06/23/2023 | 10-K |
| 01/31/2023 | 03/07/2023 | 10-Q |
| 10/31/2022 | 12/06/2022 | 10-Q |
| 07/31/2022 | 09/07/2022 | 10-Q |
| 04/30/2022 | 06/24/2022 | 10-K |
| 01/31/2022 | 03/08/2022 | 10-Q |
| 10/31/2021 | 12/07/2021 | 10-Q |
| 07/31/2021 | 09/08/2021 | 10-Q |
| 04/30/2021 | 06/25/2021 | 10-K |
| 01/31/2021 | 03/08/2021 | 10-Q |
| 10/31/2020 | 12/07/2020 | 10-Q |
| 07/31/2020 | 09/08/2020 | 10-Q |
| 04/30/2020 | 06/26/2020 | 10-K |
| 01/31/2020 | 03/09/2020 | 10-Q |
| 10/31/2019 | 12/09/2019 | 10-Q |
Recent Forward Guidance
Updated 9/9/2026Latest: Q1 2027 Earnings Reported 9/8/2026
| Forward Guidance | Guidance Change | |||||||
|---|---|---|---|---|---|---|---|---|
| Metric | Source | Low | Mid | High | % Chg | % Delta | Change | Prior |
| Q2 2027 Dividends Per Share | Reported | 0.65 | ||||||
| 2027 Inside Same-Store Sales Growth | Reported | 2.0% | 3.5% | 5.0% | 0.0% | Affirmed | Guidance: 3.5% for 2027 | |
| 2027 Inside Margin | Reported | 42.0% | 42.0% | 0.0% | Affirmed | Guidance: 42.0% for 2027 | ||
| 2027 Same-Store Fuel Gallons Sold Growth | Reported | -1.0% | 0.0% | 1.0% | 0.0% | Affirmed | Guidance: 0.0% for 2027 | |
| 2027 New Store Openings | Reported | 120 | 120 | |||||
| 2027 Depreciation and Amortization | Reported | 490.00 Mil | 0.0% | Affirmed | Guidance: 490.00 Mil for 2027 | |||
| 2027 Purchase of Property and Equipment | Reported | 800.00 Mil | 0.0% | Affirmed | Guidance: 800.00 Mil for 2027 | |||
| 2027 Operating Expenses Growth | Reported | 5.0% | 6.0% | 7.0% | 0.0% | Affirmed | Guidance: 6.0% for 2027 | |
| 2027 EBITDA Growth | Reported | 8.0% | 9.0% | 10.0% | 0.0% | Affirmed | Guidance: 9.0% for 2027 | |
| 2027 Net Interest Expense | Reported | 95.00 Mil | 0.0% | Affirmed | Guidance: 95.00 Mil for 2027 | |||
| 2027 Tax Rate | Reported | 24.0% | 25.0% | 26.0% | 0.0% | Affirmed | Guidance: 25.0% for 2027 | |
Prior: Q4 2026 Earnings Reported 6/9/2026
| Forward Guidance | Guidance Change | |||||||
|---|---|---|---|---|---|---|---|---|
| Metric | Source | Low | Mid | High | % Chg | % Delta | Change | Prior |
| 2027 Inside Same-Store Sales Growth | Reported | 2.0% | 3.5% | 5.0% | -0.5% | Lowered | Guidance: 4.0% for 2026 | |
| 2027 Inside Margin | Reported | 42.0% | 0.0% | Affirmed | Guidance: 42.0% for 2026 | |||
| 2027 Same-Store Fuel Gallons Sold Growth | Reported | -1.0% | 0.0% | 1.0% | 0.0% | Affirmed | Guidance: 0.0% for 2026 | |
| 2027 Depreciation and Amortization | Reported | 490.00 Mil | 8.9% | Raised | Guidance: 450.00 Mil for 2026 | |||
| 2027 Operating Expenses Growth | Reported | 5.0% | 6.0% | 7.0% | -4.0% | Lowered | Guidance: 10.0% for 2026 | |
| 2027 EBITDA Growth | Reported | 8.0% | 9.0% | 10.0% | -10.0% | Lowered | Guidance: 19.0% for 2026 | |
| 2027 Net Interest Expense | Reported | 95.00 Mil | -5.0% | Lowered | Guidance: 100.00 Mil for 2026 | |||
| 2027 Tax Rate | Reported | 24.0% | 25.0% | 26.0% | 1.0% | Raised | Guidance: 24.0% for 2026 | |
| 2027 Capital Expenditures | Reported | 800.00 Mil | 33.3% | Raised | Guidance: 600.00 Mil for 2026 | |||
Q3 2026 Earnings Reported 3/9/2026
| Forward Guidance | Guidance Change | |||||||
|---|---|---|---|---|---|---|---|---|
| Metric | Source | Low | Mid | High | % Chg | % Delta | Change | Prior |
| 2026 Inside Same-Store Sales Growth | Reported | 3.5% | 4.0% | 4.5% | 0.5% | Raised | Guidance: 3.5% for 2026 | |
| 2026 Inside Margin | Reported | 41.5% | 42.0% | 42.5% | 0.5% | Raised | Guidance: 41.5% for 2026 | |
| 2026 Same-Store Fuel Gallons Sold Growth | Reported | -1.0% | 0.0% | 1.0% | 0 | Affirmed | Guidance: 0.0% for 2026 | |
| 2026 Depreciation and Amortization | Reported | 450.00 Mil | 0 | Affirmed | Guidance: 450.00 Mil for 2026 | |||
| 2026 Operating Expenses Growth | Reported | 10.0% | 1.0% | Raised | Guidance: 9.0% for 2026 | |||
| 2026 EBITDA Growth | Reported | 18.0% | 19.0% | 20.0% | 3.0% | Raised | Guidance: 16.0% for 2026 | |
| 2026 Net Interest Expense | Reported | 100.00 Mil | -9.1% | Lowered | Guidance: 110.00 Mil for 2026 | |||
| 2026 Tax Rate | Reported | 23.5% | 24.0% | 24.5% | -0.5% | Lowered | Guidance: 24.5% for 2026 | |
| 2026 Capital Expenditures | Reported | 600.00 Mil | 0 | Affirmed | Guidance: 600.00 Mil for 2026 | |||
Q2 2026 Earnings Reported 12/9/2025
| Forward Guidance | Guidance Change | |||||||
|---|---|---|---|---|---|---|---|---|
| Metric | Source | Low | Mid | High | % Chg | % Delta | Change | Prior |
| 2026 Inside Same-Store Sales Growth | Reported | 3.0% | 3.5% | 4.0% | 0.0% | Affirmed | Guidance: 3.5% for 2026 | |
| 2026 Inside Margin | Reported | 41.0% | 41.5% | 42.0% | 0.5% | Raised | Guidance: 41.0% for 2026 | |
| 2026 Same-Store Fuel Gallons Sold Growth | Reported | -1.0% | 0.0% | 1.0% | 0.0% | Affirmed | Guidance: 0.0% for 2026 | |
| 2026 Depreciation and Amortization | Reported | 450.00 Mil | 0.0% | Affirmed | Guidance: 450.00 Mil for 2026 | |||
| 2026 Operating Expenses Growth | Reported | 8.0% | 9.0% | 10.0% | 0.0% | Affirmed | Guidance: 9.0% for 2026 | |
| 2026 EBITDA Growth | Reported | 15.0% | 16.0% | 17.0% | 5.0% | Raised | Guidance: 11.0% for 2026 | |
| 2026 Net Interest Expense | Reported | 110.00 Mil | 0.0% | Affirmed | Guidance: 110.00 Mil for 2026 | |||
| 2026 Tax Rate | Reported | 24.0% | 24.5% | 25.0% | -0.5% | Lowered | Guidance: 25.0% for 2026 | |
| 2026 Capital Expenditures | Reported | 600.00 Mil | 0.0% | Affirmed | Guidance: 600.00 Mil for 2026 | |||
Insider Activity
Updated 9/4/2026| # | Owner | Title | Holding | Action | Filing Date | Price | Shares | Transacted Value | Value of Held Shares | Form |
|---|---|---|---|---|---|---|---|---|---|---|
| 1 | Koschel, Williams Ena | Chief Operating Officer | Direct | Sell | 7102026 | 833.69 | 2,800 | 2,334,332 | 18,315,336 | Form |
| 2 | Wing, Allison M | Direct | Sell | 7102026 | 837.58 | 530 | 443,917 | 2,547,918 | Form | |
| 3 | Bramlage, Stephen P JR | Chief Financial Officer | Direct | Sell | 7102026 | 838.16 | 5,700 | 4,777,512 | 24,874,074 | Form |
| 4 | Rebelez, Darren M | President and CEO | Direct | Sell | 7082026 | 801.46 | 19,000 | 15,227,688 | 71,469,150 | Form |
| 5 | Koschel, Williams Ena | Chief Operating Officer | Direct | Sell | 7022026 | 785.20 | 3,000 | 2,355,600 | 19,448,619 | Form |
| # | Owner | Title | Holding | Action | Filing Date | Price | Shares | Transacted Value | Value of Held Shares | Form |
|---|---|---|---|---|---|---|---|---|---|---|
| 1 | Koschel, Williams Ena | Chief Operating Officer | Direct | Sell | 7102026 | 833.69 | 2,800 | 2,334,332 | 18,315,336 | Form |
| 2 | Wing, Allison M | Direct | Sell | 7102026 | 837.58 | 530 | 443,917 | 2,547,918 | Form | |
| 3 | Bramlage, Stephen P JR | Chief Financial Officer | Direct | Sell | 7102026 | 838.16 | 5,700 | 4,777,512 | 24,874,074 | Form |
| 4 | Rebelez, Darren M | President and CEO | Direct | Sell | 7082026 | 801.46 | 19,000 | 15,227,688 | 71,469,150 | Form |
| 5 | Koschel, Williams Ena | Chief Operating Officer | Direct | Sell | 7022026 | 785.20 | 3,000 | 2,355,600 | 19,448,619 | Form |
| 6 | Frazell, Chad Michael | Chief HR Officer | Direct | Sell | 7012026 | 787.49 | 3,013 | 2,372,711 | 7,735,525 | Form |
| 7 | Lindsey, Katrina S | Chief Legal Officer | Direct | Sell | 6302026 | 800.00 | 2,000 | 1,600,000 | 5,334,400 | Form |
| 8 | Spanos, Mike | Direct | Buy | 6292026 | 778.81 | 256 | 199,375 | 3,705,578 | Form | |
| 9 | Spanos, Mike | Direct | Buy | 3162026 | 665.43 | 300 | 199,629 | 2,993,770 | Form | |
| 10 | Lindsey, Katrina S | Chief Legal Officer | Direct | Sell | 3122026 | 683.04 | 200 | 136,608 | 2,758,799 | Form |
| 11 | Castanon, Moats Maria | Direct | Buy | 1062026 | 554.66 | 300 | 166,398 | 445,392 | Form | |
| 12 | Frazell, Chad Michael | Chief HR Officer | Direct | Sell | 9302025 | 555.40 | 3,487 | 1,936,680 | 4,439,312 | Form |
Investor Activity (13F)
Updated Sep 25, 2026Active managers (13F portfolio over $250M, at least 3 holdings) with a position over $5M that is either over 10% of their portfolio or held in a concentrated book of 50 or fewer total positions. Index/ETF, sovereign, bank, community-bank and charitable/donor-advised filers are excluded.
| Active Manager |
|---|
Casey's General Stores — Investor Video Playlist



Industry Resources
| Consumer Staples Resources |
| FoodNavigator |
| Consumer Goods Technology (CGT) |
| Beverage Digest |
| Food Retail Resources |
| Supermarket News |
| Progressive Grocer |
| Grocery Dive |
External Quote Links
| Y Finance | Barrons |
| TradingView | Morningstar |
| SeekingAlpha | ValueLine |
| Motley Fool | Robinhood |
| CNBC | Etrade |
| MarketWatch | Unusual Whales |
| YCharts | Perplexity Finance |
| FinViz |
Prefer one of these to Trefis? Tell us why.