
Steel Dynamics (STLD)
Market Price (9/20/2026): $235.26 | Market Cap: $33.9 BilInvestor Relations Sector: Materials | Industry: Steel
Steel Dynamics (STLD)
Market Price (9/20/2026): $235.26Market Cap: $33.9 BilSector: MaterialsIndustry: Steel
Investment Highlights Why It Matters Detailed financial logic regarding cash flow yields vs trend-riding momentum.
Attractive yieldTotal YieldTotal Yield = Earnings Yield + Dividend Yield, Earnings Yield = Net Income / Market Cap Dividend Yield = Total Dividends / Market Cap is 5.6% Stock buyback supportStock Buyback 3Y Total is 3.1 Bil Low stock price volatilityVol 12M is 36% Megatrend and thematic driversMegatrends include Circular Economy & Recycling, Sustainable Infrastructure, and Sustainable Resource Management. Themes include Advanced Recycling Technologies, Show more. | Weak revenue growthRev Chg 3Y AvgRevenue Change % averaged over trailing 3 years is 1.0% Key risksSTLD key risks include [1] profitability exposure to volatile scrap metal prices for its electric arc furnaces and [2] additional market risks and competition from its strategic diversification into aluminum operations. |
| Attractive yieldTotal YieldTotal Yield = Earnings Yield + Dividend Yield, Earnings Yield = Net Income / Market Cap Dividend Yield = Total Dividends / Market Cap is 5.6% |
| Stock buyback supportStock Buyback 3Y Total is 3.1 Bil |
| Low stock price volatilityVol 12M is 36% |
| Megatrend and thematic driversMegatrends include Circular Economy & Recycling, Sustainable Infrastructure, and Sustainable Resource Management. Themes include Advanced Recycling Technologies, Show more. |
| Weak revenue growthRev Chg 3Y AvgRevenue Change % averaged over trailing 3 years is 1.0% |
| Key risksSTLD key risks include [1] profitability exposure to volatile scrap metal prices for its electric arc furnaces and [2] additional market risks and competition from its strategic diversification into aluminum operations. |
Qualitative Assessment
AI Analysis | Feedback
Steel Dynamics (STLD) stock has lost about 10% since 5/31/2026 because of the following key factors:
1. Steel Dynamics incurred significant costs related to its new aluminum segment and an asset impairment during fiscal Q2 2026. The company reported a $33 million loss tied to startup costs for its new flat-rolled aluminum mill and a $16 million non-cash asset impairment charge due to the relocation of a planned second satellite aluminum recycled slab center from Arizona to Columbus, Mississippi.
2. US manufacturing activity showed signs of deceleration during the period. The ISM Manufacturing PMI, a key economic indicator for steel demand, eased from 54.0 in May to 53.3 in June 2026. After a rebound in July, it softened again in August 2026, falling to 54.6 from 55.6 in July, indicating a slower pace of expansion in the manufacturing sector.
Show more
Steel Dynamics (STLD) stock has lost about 10% since 5/31/2026 because of the following key factors:
1. Steel Dynamics incurred significant costs related to its new aluminum segment and an asset impairment during fiscal Q2 2026. The company reported a $33 million loss tied to startup costs for its new flat-rolled aluminum mill and a $16 million non-cash asset impairment charge due to the relocation of a planned second satellite aluminum recycled slab center from Arizona to Columbus, Mississippi.
2. US manufacturing activity showed signs of deceleration during the period. The ISM Manufacturing PMI, a key economic indicator for steel demand, eased from 54.0 in May to 53.3 in June 2026. After a rebound in July, it softened again in August 2026, falling to 54.6 from 55.6 in July, indicating a slower pace of expansion in the manufacturing sector.
3. The broader steel market outlook began to moderate, raising concerns about future pricing. Despite improved steel pricing in fiscal Q2 2026, the July 2026 market outlook noted a "moderate stabilization" of steel plate pricing following a "volatile Q2". Additionally, questions arose about the sustained longevity of demand from key drivers such as data center construction.
4. Analyst price targets were revised downwards by some firms. During fiscal Q2 2026, some analysts adjusted their price targets for Steel Dynamics. Notably, BofA Securities reduced its target from $280 to $260 on July 9, 2026, and Wells Fargo lowered its target from $293 to $291 on June 18, 2026.
Show less
Stock Movement Drivers
Fundamental Drivers
The -9.4% change in STLD stock from 5/31/2026 to 9/19/2026 was primarily driven by a -23.1% change in the company's P/E Multiple.| (LTM values as of) | 5312026 | 9192026 | Change |
|---|---|---|---|
| Stock Price ($) | 259.56 | 235.26 | -9.4% |
| Change Contribution By: | |||
| Total Revenues ($ Mil) | 19,012 | 20,539 | 8.0% |
| Net Income Margin (%) | 7.2% | 7.8% | 8.4% |
| P/E Multiple | 27.4 | 21.1 | -23.1% |
| Shares Outstanding (Mil) | 145 | 144 | 0.6% |
| Cumulative Contribution | -9.4% |
Market Drivers
5/31/2026 to 9/19/2026| Return | Correlation | |
|---|---|---|
| STLD | -9.4% | |
| Market (SPY) | 0.9% | 18.9% |
| Sector (XLB) | -2.3% | 47.9% |
Fundamental Drivers
The 22.5% change in STLD stock from 2/28/2026 to 9/19/2026 was primarily driven by a 20.0% change in the company's Net Income Margin (%).| (LTM values as of) | 2282026 | 9192026 | Change |
|---|---|---|---|
| Stock Price ($) | 192.10 | 235.26 | 22.5% |
| Change Contribution By: | |||
| Total Revenues ($ Mil) | 18,177 | 20,539 | 13.0% |
| Net Income Margin (%) | 6.5% | 7.8% | 20.0% |
| P/E Multiple | 23.6 | 21.1 | -10.7% |
| Shares Outstanding (Mil) | 146 | 144 | 1.1% |
| Cumulative Contribution | 22.5% |
Market Drivers
2/28/2026 to 9/19/2026| Return | Correlation | |
|---|---|---|
| STLD | 22.5% | |
| Market (SPY) | 11.6% | 39.1% |
| Sector (XLB) | -6.0% | 57.4% |
Fundamental Drivers
The 81.8% change in STLD stock from 8/31/2025 to 9/19/2026 was primarily driven by a 28.9% change in the company's Net Income Margin (%).| (LTM values as of) | 8312025 | 9192026 | Change |
|---|---|---|---|
| Stock Price ($) | 129.37 | 235.26 | 81.8% |
| Change Contribution By: | |||
| Total Revenues ($ Mil) | 17,148 | 20,539 | 19.8% |
| Net Income Margin (%) | 6.1% | 7.8% | 28.9% |
| P/E Multiple | 18.4 | 21.1 | 14.3% |
| Shares Outstanding (Mil) | 148 | 144 | 3.0% |
| Cumulative Contribution | 81.8% |
Market Drivers
8/31/2025 to 9/19/2026| Return | Correlation | |
|---|---|---|
| STLD | 81.8% | |
| Market (SPY) | 19.4% | 39.8% |
| Sector (XLB) | 9.9% | 54.3% |
Fundamental Drivers
The 130.1% change in STLD stock from 8/31/2023 to 9/19/2026 was primarily driven by a 268.0% change in the company's P/E Multiple.| (LTM values as of) | 8312023 | 9192026 | Change |
|---|---|---|---|
| Stock Price ($) | 102.22 | 235.26 | 130.1% |
| Change Contribution By: | |||
| Total Revenues ($ Mil) | 20,453 | 20,539 | 0.4% |
| Net Income Margin (%) | 14.7% | 7.8% | -46.6% |
| P/E Multiple | 5.7 | 21.1 | 268.0% |
| Shares Outstanding (Mil) | 168 | 144 | 16.7% |
| Cumulative Contribution | 130.1% |
Market Drivers
8/31/2023 to 9/19/2026| Return | Correlation | |
|---|---|---|
| STLD | 130.1% | |
| Market (SPY) | 75.6% | 49.3% |
| Sector (XLB) | 27.3% | 58.4% |
Price Returns Compared
| 2021 | 2022 | 2023 | 2024 | 2025 | 2026 | Total [1] | |
|---|---|---|---|---|---|---|---|
| Returns | |||||||
| STLD Return | 71% | 60% | 23% | -2% | 51% | 46% | 624% |
| Peers Return | 71% | 13% | 26% | -14% | 29% | 19% | 223% |
| S&P 500 Return | 27% | -19% | 24% | 23% | 16% | 12% | 103% |
Monthly Win Rates [3] | |||||||
| STLD Win Rate | 67% | 58% | 50% | 67% | 75% | 67% | |
| Peers Win Rate | 60% | 46% | 62% | 53% | 65% | 56% | |
| S&P 500 Win Rate | 75% | 42% | 67% | 75% | 67% | 44% | |
Max Drawdowns [4] | |||||||
| STLD Max Drawdown | -21% | -31% | -32% | -27% | -21% | -22% | |
| Peers Max Drawdown | -23% | -39% | -28% | -36% | -31% | -32% | |
| S&P 500 Max Drawdown | -5% | -25% | -10% | -8% | -19% | -9% | |
[1] Cumulative total returns since the beginning of 2021
[2] Peers: NUE, CLF, CMC, RS, WS. See STLD Returns vs. Peers.
[3] Win Rate = % of calendar months in which monthly returns were positive
[4] Max drawdown represents maximum peak-to-trough decline within a year
[5] 2026 data is for the year up to 9/18/2026 (YTD)
How Low Can It Go
| Event | STLD | S&P 500 |
|---|---|---|
| 2025 US Tariff Shock | ||
| % Loss | -19.8% | -18.8% |
| % Gain to Breakeven | 24.7% | 23.1% |
| Time to Breakeven | 38 days | 79 days |
| 2023 SVB Regional Banking Crisis | ||
| % Loss | -25.5% | -6.7% |
| % Gain to Breakeven | 34.1% | 7.1% |
| Time to Breakeven | 198 days | 31 days |
| 2022 Inflation Shock & Fed Tightening | ||
| % Loss | -14.9% | -24.5% |
| % Gain to Breakeven | 17.6% | 32.4% |
| Time to Breakeven | 19 days | 427 days |
| 2020 COVID-19 Crash | ||
| % Loss | -46.8% | -33.7% |
| % Gain to Breakeven | 87.9% | 50.9% |
| Time to Breakeven | 79 days | 140 days |
| Q4 2018 Fed Policy Error / Growth Scare | ||
| % Loss | -37.1% | -19.2% |
| % Gain to Breakeven | 59.0% | 23.8% |
| Time to Breakeven | 793 days | 105 days |
| 2015-2016 China Devaluation / Global Growth Scare | ||
| % Loss | -24.6% | -12.2% |
| % Gain to Breakeven | 32.6% | 13.9% |
| Time to Breakeven | 49 days | 62 days |
In The Past
Steel Dynamics's stock fell -19.8% during the 2025 US Tariff Shock. Such a loss loss requires a 24.7% gain to breakeven.
Preserve Wealth
Limiting losses and compounding gains is essential to preserving wealth.
Asset Allocation
Actively managed asset allocation strategies protect wealth. Learn more.
| Event | STLD | S&P 500 |
|---|---|---|
| 2023 SVB Regional Banking Crisis | ||
| % Loss | -25.5% | -6.7% |
| % Gain to Breakeven | 34.1% | 7.1% |
| Time to Breakeven | 198 days | 31 days |
| 2020 COVID-19 Crash | ||
| % Loss | -46.8% | -33.7% |
| % Gain to Breakeven | 87.9% | 50.9% |
| Time to Breakeven | 79 days | 140 days |
| Q4 2018 Fed Policy Error / Growth Scare | ||
| % Loss | -37.1% | -19.2% |
| % Gain to Breakeven | 59.0% | 23.8% |
| Time to Breakeven | 793 days | 105 days |
| 2015-2016 China Devaluation / Global Growth Scare | ||
| % Loss | -24.6% | -12.2% |
| % Gain to Breakeven | 32.6% | 13.9% |
| Time to Breakeven | 49 days | 62 days |
| 2014-2016 Oil Price Collapse | ||
| % Loss | -29.0% | -6.8% |
| % Gain to Breakeven | 40.8% | 7.3% |
| Time to Breakeven | 63 days | 15 days |
| 2011 US Debt Ceiling Crisis & European Contagion | ||
| % Loss | -43.0% | -17.9% |
| % Gain to Breakeven | 75.5% | 21.8% |
| Time to Breakeven | 123 days | 123 days |
| 2010 Eurozone Sovereign Debt Crisis / Flash Crash | ||
| % Loss | -21.7% | -15.4% |
| % Gain to Breakeven | 27.6% | 18.2% |
| Time to Breakeven | 157 days | 125 days |
| 2008-2009 Global Financial Crisis | ||
| % Loss | -82.5% | -53.4% |
| % Gain to Breakeven | 471.1% | 114.4% |
| Time to Breakeven | 2707 days | 1085 days |
| Summer 2007 Credit Crunch | ||
| % Loss | -24.2% | -8.6% |
| % Gain to Breakeven | 31.9% | 9.5% |
| Time to Breakeven | 47 days | 47 days |
In The Past
Steel Dynamics's stock fell -19.8% during the 2025 US Tariff Shock. Such a loss loss requires a 24.7% gain to breakeven.
Preserve Wealth
Limiting losses and compounding gains is essential to preserving wealth.
Asset Allocation
Actively managed asset allocation strategies protect wealth. Learn more.
About Steel Dynamics (STLD)
Steel Dynamics, Inc. (STLD) is a prominent U.S. steel producer and metal recycler, operating across three main segments: Steel Operations, Metals Recycling Operations, and Steel Fabrication Operations. The company integrates various stages of the steel production lifecycle, from processing scrap metal to manufacturing finished steel products and building components.
Through its Steel Operations, Steel Dynamics manufactures a comprehensive range of steel products, including hot-rolled, cold-rolled, and coated steel, along with structural beams, rail products, and various engineered bar-quality steels. The company also offers processing services such as cutting, punching, and heat treating. Its Metals Recycling segment is crucial for sustainability, purchasing, processing, and reselling both ferrous and nonferrous scrap metals, transforming them into reusable forms and grades for various industries.
Additionally, the Steel Fabrication Operations segment produces essential non-residential building components like steel joists, girders, and steel deck products. Steel Dynamics primarily serves a diverse array of end-users, steel fabricators, and service centers across major sectors, including construction, automotive, manufacturing, transportation, and heavy equipment markets.
AI Analysis | Feedback
Here are a few brief analogies for Steel Dynamics (STLD):
- Like the 'Vulcan Materials of steel', supplying essential raw materials for construction and manufacturing.
- They're like the 'Intel of heavy industry', providing the fundamental steel components that build everything from cars to skyscrapers.
AI Analysis | Feedback
- Flat Steel Products: Hot roll, cold roll, and coated steel sheets and coils.
- Structural Steel Products: Beams, channels, angles, flat bars, and reinforcing bars.
- Rail Products: Standard strength carbon, intermediate alloy hardness, and premium grade rails.
- Engineered Bar Products: Special-bar-quality (SBQ) and merchant-bar-quality (MBQ) round steel bars.
- Steel Processing Services: Turning, polishing, straightening, cutting, heat treating, welding, galvanizing, and coating of steel products.
- Ferrous and Nonferrous Scrap Metals: Processed heavy melting steel, busheling, shredded scrap, aluminum, copper, and other metals for recycling.
- Scrap Metal Recycling Services: Transportation logistics, marketing, brokerage, and scrap management.
- Steel Building Components: Steel joists, girders, trusses, and steel deck products for non-residential construction.
AI Analysis | Feedback
Steel Dynamics, Inc. (STLD) primarily sells its products and services to other companies (business-to-business). The provided company description does not list specific customer company names. However, based on the information, its major customers can be categorized as:
-
Steel Service Centers and Fabricators: These companies are direct purchasers of Steel Dynamics' various steel products, including hot roll, cold roll, coated steel, parallel flange beams, channels, flat bars, angles, reinforcing bars, and engineered bar products. They either process these materials further or incorporate them into larger structures and components for a wide range of industries.
-
Industrial End-Users: Direct purchasers of Steel Dynamics' steel products include manufacturers across diverse sectors. Key industries utilizing their steel as a primary input for their finished goods include construction, automotive, general manufacturing, transportation, heavy and agriculture equipment, and pipe and tube markets.
-
Non-Residential Construction Sector: This sector is a significant customer for both Steel Dynamics' primary steel products (such as reinforcing bars) and, more specifically, for its Steel Fabrication Operations segment, which produces non-residential steel building components like steel joists, girders, trusses, and steel deck products.
AI Analysis | Feedback
AI Analysis | Feedback
Mark D. Millett
Co-founder, Chairman, and Chief Executive Officer
Mark D. Millett co-founded Steel Dynamics in 1993, serving as CEO since January 2012 and Board Chair since May 2021. He previously held roles including President and Chief Operating Officer, Executive Vice President of Metals Recycling and Ferrous Resources, and Executive Vice President of Flat Roll Operations. Mr. Millett was responsible for the design, construction, and start-up of all Steel Dynamics' steel mills. Before co-founding Steel Dynamics, he worked for Nucor Corporation for 12 years, where he was involved in leading the design, construction, and operation of the melting and casting area at Nucor's electric arc furnace thin-slab flat roll steel mill in Crawfordsville, Indiana. He holds a bachelor's degree in metallurgy from the University of Surrey, England.
Theresa E. Wagler
Executive Vice President, Chief Financial Officer and Corporate Secretary
Theresa E. Wagler has served as Executive Vice President, Chief Financial Officer, and Corporate Secretary of Steel Dynamics since May 2007. She joined the company's corporate finance team in 1998, holding various finance and accounting positions, including Chief Accounting Officer and Vice President and Corporate Controller. Prior to joining Steel Dynamics, Ms. Wagler was a certified public accountant with Ernst & Young LLP. She also served as an Assistant Corporate Controller at Fort Wayne National Bank and an Auditor for National City Bank (Cleveland, Ohio). Ms. Wagler is also a director and chair of the audit committee of CF Industries Holdings, Inc., a public company. She graduated cum laude from Taylor University with a bachelor's degree in accounting and systems analysis.
Barry T. Schneider
President and Chief Operating Officer
Barry T. Schneider was appointed President and Chief Operating Officer in March 2023. He is responsible for the company's steel, steel fabrication, and metals recycling platforms, and oversees information technology and innovation. Mr. Schneider joined Steel Dynamics in 1995 as a mechanical engineer and has held various operational and leadership roles, including Senior Vice President, Flat Roll Steel Group. He was part of the team that constructed Steel Dynamics' first steel mill in Butler, Indiana. During the company's startup, there were "private equity behind us had expectations" to get the operations running. Before Steel Dynamics, he worked at LTV Steel. Mr. Schneider holds a Bachelor of Science in Mechanical Engineering and a Master of Science in Engineering Management from Rose-Hulman Institute of Technology.
Glenn A. Pushis
Senior Vice President, Special Projects
Glenn A. Pushis has been Steel Dynamics' Senior Vice President, Special Projects since February 2019. He joined Steel Dynamics in 1994 and has held various operational and leadership roles, including Senior Vice President, Long Products Steel Group. Mr. Pushis was part of the team that constructed the company's first steel mill in Butler, Indiana, in 1994. He was responsible for the successful design and construction of the company's Southwest-Sinton Flat Roll Division. Prior to Steel Dynamics, he worked in engineering at Nucor Corp. and LTV Steel. Mr. Pushis earned a bachelor's degree in mechanical engineering from Purdue University and an MBA from Indiana University.
Christopher A. Graham
Senior Vice President, Flat Roll Steel Group
Christopher A. Graham was appointed Senior Vice President, Flat Roll Steel Group in October 2023. He has been with Steel Dynamics since 1994, holding various operational and leadership roles within both steel fabrication and steel operations. Mr. Graham was part of the teams that constructed the Butler Flat Roll and Structural and Rail steel mills. His previous positions include Senior Vice President, Long Products Steel Group (since 2019) and Senior Vice President, Downstream Manufacturing and President of New Millennium Building Systems (2016-2019). He also served as President of New Millennium Building Systems at Steel Dynamics Inc. from May 2014 to February 2016. Mr. Graham holds a bachelor's degree in business management from Western Governors University and an MBA from the University of Saint Francis.
AI Analysis | Feedback
Key Risks to Steel Dynamics (STLD)
-
Cyclical Demand and Economic Downturns: Steel Dynamics' business is highly sensitive to the overall health of the economy and specific industrial sectors. Demand for its steel products, metal recycling services, and fabricated steel components is heavily dependent on activity in construction, automotive, manufacturing, transportation, heavy equipment, and agriculture markets. Economic slowdowns or downturns in these key sectors can lead to reduced demand, lower sales volumes, and pressure on pricing, significantly impacting the company's profitability and financial performance.
-
Volatility in Raw Material and Energy Costs: As a major steel producer utilizing electric arc furnaces and a metal recycler, Steel Dynamics is highly exposed to fluctuations in the prices of key inputs. The cost of ferrous and nonferrous scrap metals, which are primary raw materials for its Steel Operations and the core of its Metals Recycling Operations, can be volatile. Similarly, energy costs, particularly electricity and natural gas, represent a significant operating expense. Sharp increases in these input costs, which the company may not always be able to pass on to customers, can compress profit margins.
-
Global Trade Policies and Foreign Competition: The steel industry operates within a global market that is often influenced by international trade policies, including tariffs, quotas, and anti-dumping measures. Steel Dynamics faces competition from both domestic and foreign steel producers. Changes in global trade agreements, an influx of lower-priced imported steel, or adverse shifts in trade policies could negatively impact domestic steel pricing, market share, and the company's ability to compete effectively in its target markets.
AI Analysis | Feedback
Clear Emerging Threats for Steel Dynamics (STLD):
-
Mass Timber / Cross-Laminated Timber (CLT) in Construction: Mass timber and cross-laminated timber (CLT) products are emerging as significant structural alternatives to steel and concrete in non-residential construction, including multi-story and commercial buildings. This trend is driven by environmental considerations (carbon sequestration), construction efficiency, and aesthetic appeal. As a company with significant Steel Fabrication Operations producing steel joists, girders, trusses, and steel deck products, and Steel Operations supplying structural steel, the increasing adoption of mass timber directly threatens a portion of Steel Dynamics' core market share in the construction sector.
-
Advanced Lightweight Materials in Automotive and Heavy Equipment: There is a continuous and accelerating shift towards advanced lightweight materials such as high-strength aluminum alloys and carbon fiber composites in industries like automotive, transportation, and heavy and agriculture equipment. These are all key end-markets for Steel Dynamics' steel products, including hot roll, cold roll, coated steel, and various engineered bars. The drive for improved fuel efficiency, reduced emissions, and increased battery range in electric vehicles is pushing manufacturers to adopt these lighter alternatives, potentially eroding steel's traditional dominance and market share in critical components for these industries.
AI Analysis | Feedback
Steel Dynamics (STLD) operates in several addressable markets, including steel production, metals recycling, and steel fabrication. The estimated market sizes for their main products and services are as follows:
Steel Operations
- The global steel market was estimated at approximately USD 1.49 trillion in 2025 and is projected to reach USD 2.28 trillion by 2033. Another estimate places the global steel market size at USD 1.63 trillion in 2025, predicted to increase to approximately USD 2.60 trillion by 2034.
- The U.S. steel market size reached USD 141.9 billion in 2025 and is projected to reach USD 164.9 billion by 2034.
Metals Recycling Operations
- The global scrap metal recycling market size was valued at USD 435.50 billion in 2025 and is projected to grow to USD 614.00 billion by 2034.
- The U.S. scrap metal market is estimated to be USD 57.8 billion in 2026. Separately, the U.S. ferrous metal market size was USD 32.37 billion in 2024 and is predicted to reach around USD 45.98 billion by 2034.
- The global non-ferrous scrap recycling market is valued at approximately USD 623 billion.
Steel Fabrication Operations
- The North America structural steel fabrication market is expected to reach USD 47.32 billion in 2025 and grow to USD 55.77 billion by 2030. Another source indicates the North America structural steel fabrication market was valued at approximately USD 179.04 billion in 2025 and is projected to grow to USD 9% from 2025 to 2033.
- The U.S. structural steel market generated a revenue of USD 7,602.2 million in 2024 and is expected to reach USD 10,744.5 million by 2030. The non-residential segment was the largest revenue-generating application in 2024.
AI Analysis | Feedback
Steel Dynamics (STLD) is poised for revenue growth over the next two to three years, driven by the expansion of its aluminum operations, increased steel shipments coupled with a richer value-added product mix, sustained robust demand from non-residential construction, infrastructure, and onshoring initiatives, and continued growth and operational efficiencies within its metals recycling segment.
Drivers of Future Revenue Growth:
- Ramp-up and Market Penetration of Aluminum Operations: Steel Dynamics' new aluminum flat-rolled mill is a significant new revenue stream. The company began shipping commercial quality aluminum flat-rolled coils in June 2025, marking a key milestone. Management anticipates continued and improving EBITDA contributions throughout the first half of 2026, with expectations to reach approximately 90% capacity utilization by the end of 2026, an increase from previous estimates of 75%. Full optimization of these operations is projected by 2027. This expansion into the aluminum market, serving sectors like lightweight automotive and packaging, is a primary driver of new product-based revenue growth.
- Increased Steel Shipments and Enhanced Value-Added Product Mix: Steel Dynamics has consistently reported strong steel shipment volumes, achieving record annual steel shipments of 13.7 million tons in 2025. The ramp-up of four new value-added flat-rolled steel coating lines is expected to significantly contribute to earnings as they reach full utilization in the coming years, improving the company's product mix towards higher-margin offerings. The company's steel mills consistently operate at higher utilization rates than the domestic industry average, reflecting the strength of its diversified, value-added steel products and effective customer supply chain solutions.
- Robust Demand from Non-Residential Construction, Infrastructure, and Onshoring Initiatives: The steel fabrication segment continues to experience solid demand, with its joist and deck backlog extending into the first quarter of 2026, supported by strong pricing. Federal programs, along with growth in manufacturing and onshoring trends, are expected to fuel domestic fixed asset investment, thereby supporting sustained demand for both flat and long steel products, as well as steel joists, in the coming years. The Infrastructure Investment and Jobs Act (IIJA) specifically drives demand for structural steel in projects such as bridges and transit.
- Growth and Operational Efficiencies in Metals Recycling: The Metals Recycling Operations segment demonstrated strong performance in 2025, with record operating income that was almost 30% higher than in 2024. This growth was attributed to improved pricing, increased volume, and ongoing operating efficiencies. Steel Dynamics is actively expanding its scrap separation capabilities to support its growing steel and aluminum production capacities. This strategic initiative helps mitigate supply risks by enabling the use of a wider range of ferrous and non-ferrous scrap grades, often at a lower cost, thereby enhancing the segment's profitability and overall revenue contribution.
AI Analysis | Feedback
Share Repurchases
- Steel Dynamics authorized an additional $1.5 billion share repurchase program in February 2025, which was additive to a prior $1.5 billion program approved in November 2023 that had $194 million remaining as of December 31, 2024.
- Since 2017 through December 31, 2024, the company repurchased $6.7 billion of its common stock, representing 41% of its outstanding shares.
- In 2025, Steel Dynamics repurchased $901 million of its common stock, accounting for over four percent of its outstanding shares.
Share Issuance
- In March 2025, Steel Dynamics issued $1 billion of unsecured notes, consisting of $600 million of 5.250% Notes due 2035 and $400 million of 5.750% Notes due 2055, with net proceeds used for general corporate purposes, including the repayment of $400 million in 2.400% Senior Notes due June 2025.
- In November 2025, the company issued $800 million in unsecured notes, comprising $650 million of 4.000% notes due 2028 and $150 million of 5.250% notes due 2035, used to redeem $400 million of 5.000% Notes due 2026 and for other general corporate purposes.
Outbound Investments
- In December 2025, Steel Dynamics completed the acquisition of the remaining 55% ownership interest in New Process Steel, following an initial 45% acquisition in 2022, to strengthen its value-added manufacturing capabilities and commercial relationship with a major flat-rolled steel customer.
- Over the last five years (through December 31, 2024), Steel Dynamics invested $7.1 billion in capital investments and acquisitions.
- Steel Dynamics, in partnership with SGH Limited, submitted an $11 billion offer to acquire Australian steel manufacturer BlueScope Steel in February 2026, which was rejected, but future overtures remain possible, with STLD aiming for BlueScope's North American operations.
Capital Expenditures
- Capital expenditures in 2025 totaled $948 million.
- The company's capital expenditures were $1.7 billion in 2023 and are expected to be $2 billion in 2024, with $1.4 billion allocated to aluminum-related projects.
- Steel Dynamics is primarily focused on significant growth investments, including a $2.2 billion to $2.7 billion low-carbon, recycled aluminum flat rolled mill in Columbus, Mississippi, and related satellite recycled aluminum slab centers, with commercial production commencing in the first quarter of 2025. Other key projects include ramping up the flat-rolled steel mill in Sinton, Texas, and commissioning four new flat-rolled coating lines.
Peer Outperformance in Steel
| Industry | Names | 1Y med | 3Y med | 5Y med | Top 3 by 5Y |
|---|---|---|---|---|---|
| Copper | 7 | 75.0% | 88.9% | 324.2% | COPR 973% · TGB 402% · HBM 401% |
| Steel ← | 13 | 14.3% | 37.6% | 176.2% | HCC 341% · STLD 336% · NWPX 326% |
| Silver | 6 | 108.5% | 331.6% | 169.7% | AYA 306% · HL 254% · SVM 202% |
| Gold | 34 | 24.3% | 202.4% | 162.4% | IAG 813% · KGC 463% · CNL 440% |
| Aluminum | 3 | 41.5% | 121.9% | 63.4% | CENX 212% · KALU 63% · AA -4% |
| Construction Materials | 7 | -22.9% | 18.0% | 47.9% | USLM 381% · CRH 88% · SMID 66% |
| Diversified Metals & Mining | 23 | -19.9% | -1.6% | 31.2% | ATLX 207043% · USAR 51477% · TII 778% |
| Metal, Glass & Plastic Containers | 11 | -8.7% | 3.8% | 1.5% | KRT 200% · MYE 82% · GEF 59% |
| Paper & Plastic Packaging Products & Materials | 7 | 6.5% | 6.6% | -8.7% | PKG 93% · CCK 9% · SON -2% |
| Specialty Chemicals | 41 | 6.9% | -0.3% | -9.2% | ODC 482% · NEU 205% · CMT 103% |
| Commodity Chemicals | 12 | 9.9% | -13.2% | -25.4% | HWKN 282% · KOP 60% · MEOH 60% |
| Diversified Chemicals | 4 | -5.8% | -29.7% | -27.0% | CBT 77% · ASH -14% · CC -40% |
| Precious Metals & Minerals | 8 | 28.9% | 165.7% | -27.2% | ASM 698% · PPTA 391% · MTA 42% |
| Fertilizers & Agricultural Chemicals | 10 | -11.2% | -6.8% | -35.0% | CF 195% · CTVA 105% · NTR 49% |
| Paper Products | 3 | -24.0% | -51.9% | -95.7% | CLW -39% · ITP -96% · MERC -96% |
Latest Trefis Analyses
Research & Analysis
Invest in Strategies
Wealth Management
Peer Comparisons
| Peers to compare with: |
Financials
| Median | |
|---|---|
| Name | |
| Mkt Price | 149.88 |
| Mkt Cap | 13.5 |
| Rev LTM | 17,500 |
| Op Inc LTM | 965 |
| FCF LTM | 467 |
| FCF 3Y Avg | 529 |
| CFO LTM | 846 |
| CFO 3Y Avg | 1,056 |
Growth & Margins
| Median | |
|---|---|
| Name | |
| Rev Chg LTM | 13.4% |
| Rev Chg 3Y Avg | -0.8% |
| Rev Chg Q | 22.2% |
| QoQ Delta Rev Chg LTM | 5.2% |
| Op Inc Chg LTM | 44.5% |
| Op Inc Chg 3Y Avg | -10.1% |
| Op Mgn LTM | 8.1% |
| Op Mgn 3Y Avg | 8.5% |
| QoQ Delta Op Mgn LTM | 0.9% |
| CFO/Rev LTM | 6.7% |
| CFO/Rev 3Y Avg | 9.4% |
| FCF/Rev LTM | 3.9% |
| FCF/Rev 3Y Avg | 3.7% |
Valuation
| Median | |
|---|---|
| Name | |
| Mkt Cap | 13.5 |
| P/S | 1.1 |
| P/Op Inc | 14.4 |
| P/EBIT | 14.0 |
| P/E | 20.4 |
| P/CFO | 10.7 |
| Total Yield | 5.7% |
| Dividend Yield | 1.0% |
| FCF Yield 3Y Avg | 4.1% |
| D/E | 0.2 |
| Net D/E | 0.1 |
Returns
| Median | |
|---|---|
| Name | |
| 1M Rtn | 2.9% |
| 3M Rtn | -3.5% |
| 6M Rtn | 39.7% |
| 12M Rtn | 24.9% |
| 3Y Rtn | 56.2% |
| 1M Excs Rtn | -0.5% |
| 3M Excs Rtn | -5.5% |
| 6M Excs Rtn | 21.4% |
| 12M Excs Rtn | 8.5% |
| 3Y Excs Rtn | -14.3% |
Comparison Analyses
Segment Financials
Revenue by Segment| $ Mil | 2025 | 2024 | 2023 | 2022 | 2021 |
|---|---|---|---|---|---|
| Steel Operations | 13,413 | 12,527 | 13,068 | 15,101 | 14,023 |
| Metals Recycling Operations | 4,346 | 4,137 | 4,159 | 4,200 | 4,590 |
| Steel Fabrication Operations | 1,419 | 1,772 | 2,807 | 4,257 | 1,765 |
| Other | 1,335 | 1,452 | 1,172 | 1,288 | 1,267 |
| Aluminum Operations | 474 | 319 | 286 | 292 | 0 |
| Eliminations | -2,810 | -2,666 | -2,695 | -2,878 | -3,236 |
| Total | 18,177 | 17,540 | 18,795 | 22,261 | 18,409 |
| $ Mil | 2025 | 2024 | 2023 | 2022 | 2021 |
|---|---|---|---|---|---|
| Steel Operations | 1,428 | 1,582 | 1,882 | 3,093 | 4,358 |
| Steel Fabrication Operations | 407 | 667 | 1,593 | 2,425 | 365 |
| Metals Recycling Operations | 97 | 77 | 48 | 99 | 182 |
| Eliminations | -1 | 7 | 6 | 54 | -55 |
| Aluminum Operations | -173 | -72 | 17 | 15 | 0 |
| Other | -282 | -317 | -395 | -594 | -550 |
| Total | 1,476 | 1,943 | 3,151 | 5,092 | 4,301 |
| $ Mil | 2025 | 2024 | 2023 | 2022 | 2021 |
|---|---|---|---|---|---|
| Steel Operations | 9,234 | 8,776 | 8,650 | 8,607 | 8,686 |
| Other | 4,584 | 3,320 | 3,249 | 3,008 | 1,524 |
| Aluminum Operations | 3,906 | 2,803 | 1,320 | ||
| Metals Recycling Operations | 1,463 | 1,301 | 1,458 | 1,320 | 1,267 |
| Steel Fabrication Operations | 667 | 666 | 790 | 1,349 | 1,195 |
| Eliminations | -3,434 | -1,931 | -560 | -125 | -141 |
| Total | 16,420 | 14,935 | 14,908 | 14,160 | 12,531 |
Price Behavior
| Market Price | $235.26 | |
| Market Cap ($ Bil) | 33.9 | |
| First Trading Date | 11/22/1996 | |
| Distance from 52W High | -16.6% | |
| 50 Days | 200 Days | |
| DMA Price | $243.80 | $213.22 |
| DMA Trend | up | down |
| Distance from DMA | -3.5% | 10.3% |
| 3M | 1YR | |
| Volatility | 39.2% | 36.3% |
| Downside Capture | 166.17 | 88.80 |
| Upside Capture | 118.15 | 136.69 |
| Correlation (SPY) | 16.4% | 41.4% |
| 1M | 2M | 3M | 6M | 1Y | 3Y | |
|---|---|---|---|---|---|---|
| Beta | 2.03 | 1.00 | 0.52 | 1.11 | 1.15 | 1.13 |
| Up Beta | 2.08 | 0.44 | -0.89 | 0.69 | 1.04 | 1.22 |
| Down Beta | 6.50 | 1.11 | 1.01 | 1.42 | 1.53 | 1.19 |
| Up Capture | 60% | 125% | 50% | 130% | 149% | 124% |
| Bmk +ve Days | 10 | 21 | 32 | 68 | 138 | 427 |
| Stock +ve Days | 10 | 23 | 33 | 70 | 141 | 388 |
| Down Capture | 299% | 110% | 111% | 107% | 82% | 99% |
| Bmk -ve Days | 11 | 21 | 32 | 59 | 113 | 324 |
| Stock -ve Days | 11 | 19 | 31 | 57 | 110 | 362 |
[1] Upside and downside betas calculated using positive and negative benchmark daily returns respectively
Based On 1-Year Data
| Annualized Return | Annualized Volatility | Sharpe Ratio | Correlation with STLD | |
|---|---|---|---|---|
| STLD | 74.4% | 36.2% | 1.59 | - |
| Sector ETF (XLB) | 11.7% | 17.9% | 0.46 | 55.2% |
| Equity (SPY) | 16.9% | 12.9% | 0.94 | 41.2% |
| Gold (GLD) | 19.1% | 29.3% | 0.60 | 13.1% |
| Commodities (DBC) | 46.3% | 20.6% | 1.73 | -6.4% |
| Real Estate (VNQ) | 4.9% | 13.6% | 0.10 | 19.1% |
| Bitcoin (BTCUSD) | -30.6% | 44.3% | -0.70 | 9.3% |
Smart multi-asset allocation framework can stack odds in your favor. Learn How
Based On 5-Year Data
| Annualized Return | Annualized Volatility | Sharpe Ratio | Correlation with STLD | |
|---|---|---|---|---|
| STLD | 31.0% | 38.1% | 0.80 | - |
| Sector ETF (XLB) | 5.5% | 19.1% | 0.18 | 63.0% |
| Equity (SPY) | 12.9% | 17.2% | 0.57 | 50.6% |
| Gold (GLD) | 19.1% | 18.8% | 0.83 | 7.7% |
| Commodities (DBC) | 11.2% | 19.5% | 0.45 | 18.1% |
| Real Estate (VNQ) | 1.1% | 18.8% | -0.05 | 34.1% |
| Bitcoin (BTCUSD) | 12.5% | 52.5% | 0.42 | 19.1% |
Smart multi-asset allocation framework can stack odds in your favor. Learn How
Based On 10-Year Data
| Annualized Return | Annualized Volatility | Sharpe Ratio | Correlation with STLD | |
|---|---|---|---|---|
| STLD | 27.7% | 39.6% | 0.74 | - |
| Sector ETF (XLB) | 9.6% | 20.7% | 0.41 | 66.7% |
| Equity (SPY) | 15.1% | 18.0% | 0.72 | 55.7% |
| Gold (GLD) | 12.1% | 16.4% | 0.61 | 4.2% |
| Commodities (DBC) | 8.3% | 18.1% | 0.37 | 27.7% |
| Real Estate (VNQ) | 4.4% | 20.7% | 0.18 | 40.3% |
| Bitcoin (BTCUSD) | 62.6% | 66.2% | 1.02 | 16.5% |
Smart multi-asset allocation framework can stack odds in your favor. Learn How
Returns Analyses
Earnings Returns History
Updated 8/21/2026| Forward Returns | |||
|---|---|---|---|
| Earnings Date | 1D Returns | 5D Returns | 21D Returns |
| 7/21/2026 | 1.3% | 8.6% | 8.4% |
| 4/21/2026 | 3.3% | 3.1% | 3.7% |
| 1/27/2026 | -0.7% | 9.8% | 9.6% |
| 10/21/2025 | 5.2% | 8.0% | 5.7% |
| 7/22/2025 | -1.7% | -3.2% | -4.7% |
| 4/23/2025 | 4.0% | 5.9% | 6.0% |
| 1/23/2025 | -0.4% | 5.1% | 6.4% |
| 10/17/2024 | 4.0% | -0.9% | 6.1% |
| ... | |||
| SUMMARY STATS | |||
| # Positive | 13 | 15 | 19 |
| # Negative | 11 | 9 | 5 |
| Median Positive | 3.3% | 6.9% | 9.0% |
| Median Negative | -0.7% | -2.0% | -9.2% |
| Max Positive | 10.0% | 13.8% | 29.9% |
| Max Negative | -3.1% | -6.4% | -12.9% |
| Forward Returns | |||
|---|---|---|---|
| Earnings Date | 1D Returns | 5D Returns | 21D Returns |
| 7/21/2026 | 1.3% | 8.6% | 8.4% |
| 4/21/2026 | 3.3% | 3.1% | 3.7% |
| 1/27/2026 | -0.7% | 9.8% | 9.6% |
| 10/21/2025 | 5.2% | 8.0% | 5.7% |
| 7/22/2025 | -1.7% | -3.2% | -4.7% |
| 4/23/2025 | 4.0% | 5.9% | 6.0% |
| 1/23/2025 | -0.4% | 5.1% | 6.4% |
| 10/17/2024 | 4.0% | -0.9% | 6.1% |
| 7/18/2024 | -0.7% | -5.2% | -9.2% |
| 4/24/2024 | 2.4% | -0.2% | 2.8% |
| 1/24/2024 | -0.5% | 3.6% | 9.0% |
| 10/19/2023 | -0.3% | 3.2% | 11.8% |
| 7/20/2023 | -3.0% | -1.5% | 0.1% |
| 4/21/2023 | -1.3% | -6.4% | -12.9% |
| 1/26/2023 | 10.0% | 13.5% | 7.3% |
| 10/20/2022 | 8.5% | 13.8% | 17.5% |
| 7/21/2022 | 3.9% | 6.9% | 24.0% |
| 4/22/2022 | -0.3% | -4.3% | -12.8% |
| 1/26/2022 | 2.3% | 11.4% | 29.9% |
| 10/21/2021 | -3.1% | -0.8% | -2.2% |
| 7/21/2021 | 0.6% | 3.3% | 17.1% |
| 4/20/2021 | 2.1% | 9.8% | 24.1% |
| 1/28/2021 | -0.3% | 4.5% | 17.9% |
| 10/21/2020 | 3.1% | -2.0% | 14.9% |
| SUMMARY STATS | |||
| # Positive | 13 | 15 | 19 |
| # Negative | 11 | 9 | 5 |
| Median Positive | 3.3% | 6.9% | 9.0% |
| Median Negative | -0.7% | -2.0% | -9.2% |
| Max Positive | 10.0% | 13.8% | 29.9% |
| Max Negative | -3.1% | -6.4% | -12.9% |
SEC Filings
Expand for More| Report Date | Filing Date | Filing |
|---|---|---|
| 06/30/2026 | 07/28/2026 | 10-Q |
| 03/31/2026 | 04/27/2026 | 10-Q |
| 12/31/2025 | 02/27/2026 | 10-K |
| 09/30/2025 | 10/24/2025 | 10-Q |
| 06/30/2025 | 08/11/2025 | 10-Q |
| 03/31/2025 | 05/12/2025 | 10-Q |
| 12/31/2024 | 02/28/2025 | 10-K |
| 09/30/2024 | 11/08/2024 | 10-Q |
| 06/30/2024 | 08/08/2024 | 10-Q |
| 03/31/2024 | 05/10/2024 | 10-Q |
| 12/31/2023 | 02/29/2024 | 10-K |
| 09/30/2023 | 11/09/2023 | 10-Q |
| 06/30/2023 | 08/08/2023 | 10-Q |
| 03/31/2023 | 05/05/2023 | 10-Q |
| 12/31/2022 | 02/28/2023 | 10-K |
| 09/30/2022 | 10/26/2022 | 10-Q |
| Report Date | Filing Date | Filing |
|---|---|---|
| 06/30/2026 | 07/28/2026 | 10-Q |
| 03/31/2026 | 04/27/2026 | 10-Q |
| 12/31/2025 | 02/27/2026 | 10-K |
| 09/30/2025 | 10/24/2025 | 10-Q |
| 06/30/2025 | 08/11/2025 | 10-Q |
| 03/31/2025 | 05/12/2025 | 10-Q |
| 12/31/2024 | 02/28/2025 | 10-K |
| 09/30/2024 | 11/08/2024 | 10-Q |
| 06/30/2024 | 08/08/2024 | 10-Q |
| 03/31/2024 | 05/10/2024 | 10-Q |
| 12/31/2023 | 02/29/2024 | 10-K |
| 09/30/2023 | 11/09/2023 | 10-Q |
| 06/30/2023 | 08/08/2023 | 10-Q |
| 03/31/2023 | 05/05/2023 | 10-Q |
| 12/31/2022 | 02/28/2023 | 10-K |
| 09/30/2022 | 10/26/2022 | 10-Q |
| 06/30/2022 | 08/02/2022 | 10-Q |
| 03/31/2022 | 04/29/2022 | 10-Q |
| 12/31/2021 | 02/28/2022 | 10-K |
| 09/30/2021 | 11/02/2021 | 10-Q |
| 06/30/2021 | 07/26/2021 | 10-Q |
| 03/31/2021 | 04/29/2021 | 10-Q |
| 12/31/2020 | 03/01/2021 | 10-K |
| 09/30/2020 | 11/09/2020 | 10-Q |
| 06/30/2020 | 08/10/2020 | 10-Q |
| 03/31/2020 | 05/11/2020 | 10-Q |
| 12/31/2019 | 02/27/2020 | 10-K |
| 09/30/2019 | 10/31/2019 | 10-Q |
Insider Activity
Updated 8/14/2026| # | Owner | Title | Holding | Action | Filing Date | Price | Shares | Transacted Value | Value of Held Shares | Form |
|---|---|---|---|---|---|---|---|---|---|---|
| 1 | Anderson, James Stanley | Senior Vice President | Direct | Sell | 6082026 | 268.70 | 10,000 | 2,687,030 | 27,632,611 | Form |
| 2 | Graham, Christopher A | Senior Vice President | Direct | Sell | 5152026 | 236.81 | 9,000 | 2,131,290 | 16,279,980 | Form |
| 3 | Poinsatte, Richard A | Senior Vice President | Direct | Sell | 5142026 | 234.11 | 2,300 | 538,453 | 6,699,760 | Form |
| 4 | Alvarez, Miguel | Senior Vice President | Direct | Sell | 4242026 | 225.58 | 4,825 | 1,088,428 | 27,578,842 | Form |
| 5 | Cornew, Kenneth W | Direct | Sell | 4242026 | 224.87 | 5,000 | 1,124,358 | 7,038,256 | Form |
| # | Owner | Title | Holding | Action | Filing Date | Price | Shares | Transacted Value | Value of Held Shares | Form |
|---|---|---|---|---|---|---|---|---|---|---|
| 1 | Anderson, James Stanley | Senior Vice President | Direct | Sell | 6082026 | 268.70 | 10,000 | 2,687,030 | 27,632,611 | Form |
| 2 | Graham, Christopher A | Senior Vice President | Direct | Sell | 5152026 | 236.81 | 9,000 | 2,131,290 | 16,279,980 | Form |
| 3 | Poinsatte, Richard A | Senior Vice President | Direct | Sell | 5142026 | 234.11 | 2,300 | 538,453 | 6,699,760 | Form |
| 4 | Alvarez, Miguel | Senior Vice President | Direct | Sell | 4242026 | 225.58 | 4,825 | 1,088,428 | 27,578,842 | Form |
| 5 | Cornew, Kenneth W | Direct | Sell | 4242026 | 224.87 | 5,000 | 1,124,358 | 7,038,256 | Form | |
| 6 | Alvarez, Miguel | Senior Vice President | Direct | Sell | 10302025 | 162.79 | 8,251 | 1,343,180 | 19,057,500 | Form |
| 7 | Graham, Christopher A | Senior Vice President | Direct | Sell | 7312025 | 126.71 | 12,000 | 1,520,460 | 8,456,040 | Form |
Investor Activity (13F)
Updated Sep 20, 2026Active managers (13F portfolio over $250M, at least 3 holdings) with a position over $5M that is either over 10% of their portfolio or held in a concentrated book of 50 or fewer total positions. Index/ETF, sovereign, bank, community-bank and charitable/donor-advised filers are excluded.
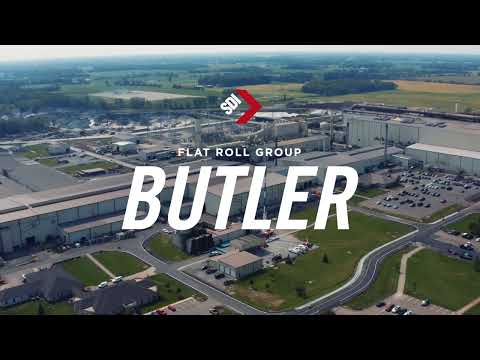
Steel Dynamics — Investor Video Playlist




Industry Resources
| Materials Resources |
| Chemical & Engineering News (C&EN) |
| Mining.com |
| Plastics News |
| Steel Resources |
| SteelOrbis |
| World Steel Association |
| Kallanish Commodities |
External Quote Links
| Y Finance | Barrons |
| TradingView | Morningstar |
| SeekingAlpha | ValueLine |
| Motley Fool | Robinhood |
| CNBC | Etrade |
| MarketWatch | Unusual Whales |
| YCharts | Perplexity Finance |
| FinViz |
Prefer one of these to Trefis? Tell us why.