
Lamb Weston (LW)
Market Price (10/6/2026): $48.51 | Market Cap: $6.7 BilSector: Consumer Staples | Industry: Packaged Foods & Meats
Lamb Weston (LW)
Market Price (10/6/2026): $48.51Market Cap: $6.7 BilSector: Consumer StaplesIndustry: Packaged Foods & Meats
Investment Highlights Why It Matters Detailed financial logic regarding cash flow yields vs trend-riding momentum.
Attractive yieldTotal YieldTotal Yield = Earnings Yield + Dividend Yield, Earnings Yield = Net Income / Market Cap Dividend Yield = Total Dividends / Market Cap is 8.1%, Dividend Yield is 3.4%, ERPEquity Risk Premium (ERP) = Total Yield - Risk Free Rate, Reflects the premium above risk free assets offered by the investment. is 4.2%, FCF Yield is 8.8% Attractive cash flow generationCFO/Rev LTMCash Flow from Operations / Revenue (Sales), Last Twelve Months (LTM) is 14% Low stock price volatilityVol 12M is 41% Megatrend and thematic driversMegatrends include Vegan & Alternative Foods, and Automation & Robotics. Themes include Vegan Products, Sustainable Packaging, Show more. | Weak multi-year price returns2Y Excs Rtn is -62%, 3Y Excs Rtn is -129% | Debt is significantNet D/ENet Debt/Equity. Debt net of cash. Negative indicates net cash. Equity is taken as the Market Capitalization is 63% Key risksLW key risks include [1] significant customer concentration in its foodservice segment, Show more. |
| Attractive yieldTotal YieldTotal Yield = Earnings Yield + Dividend Yield, Earnings Yield = Net Income / Market Cap Dividend Yield = Total Dividends / Market Cap is 8.1%, Dividend Yield is 3.4%, ERPEquity Risk Premium (ERP) = Total Yield - Risk Free Rate, Reflects the premium above risk free assets offered by the investment. is 4.2%, FCF Yield is 8.8% |
| Attractive cash flow generationCFO/Rev LTMCash Flow from Operations / Revenue (Sales), Last Twelve Months (LTM) is 14% |
| Low stock price volatilityVol 12M is 41% |
| Megatrend and thematic driversMegatrends include Vegan & Alternative Foods, and Automation & Robotics. Themes include Vegan Products, Sustainable Packaging, Show more. |
| Weak multi-year price returns2Y Excs Rtn is -62%, 3Y Excs Rtn is -129% |
| Debt is significantNet D/ENet Debt/Equity. Debt net of cash. Negative indicates net cash. Equity is taken as the Market Capitalization is 63% |
| Key risksLW key risks include [1] significant customer concentration in its foodservice segment, Show more. |
Qualitative Assessment
AI Analysis | Feedback
Lamb Weston (LW) stock has gained about 5% since 6/30/2026 because of the following key factors:
1. Strong fiscal Q4 2026 earnings were tempered by a conservative fiscal 2027 outlook.
Lamb Weston reported adjusted earnings per share of $0.87 for its fiscal fourth quarter ended May 31, 2026, exceeding the consensus estimate of $0.63, while quarterly revenue rose 5.6% year-over-year to $1.77 billion, also above analysts' expectations of $1.70 billion. This positive performance was counteracted by the company's fiscal 2027 guidance, which projected sales growth of 0%-1% against its 52-week adjusted fiscal 2026 comparison, suggesting a modest to flat revenue outlook. Additionally, the company returned $116.0 million to shareholders in Q4 fiscal 2026 through dividends and share repurchases.
2. Deteriorating European potato crop conditions introduced uncertainty regarding international segment profitability.
Concerns over the 2026 European potato crop significantly impacted the stock outlook. Analysts, including Stephens, lowered price targets in late September 2026 (e.g., to $50 from $55), citing a material worsening of the crop due to extreme heat, resulting in lower acreage, weaker yields, and smaller potato sizing. This agricultural challenge is expected to increase procurement costs for fiscal year 2027 and slow the recovery of the European market, dampening investor enthusiasm for the company's international segment.
Show more
Lamb Weston (LW) stock has gained about 5% since 6/30/2026 because of the following key factors:
1. Strong fiscal Q4 2026 earnings were tempered by a conservative fiscal 2027 outlook.
Lamb Weston reported adjusted earnings per share of $0.87 for its fiscal fourth quarter ended May 31, 2026, exceeding the consensus estimate of $0.63, while quarterly revenue rose 5.6% year-over-year to $1.77 billion, also above analysts' expectations of $1.70 billion. This positive performance was counteracted by the company's fiscal 2027 guidance, which projected sales growth of 0%-1% against its 52-week adjusted fiscal 2026 comparison, suggesting a modest to flat revenue outlook. Additionally, the company returned $116.0 million to shareholders in Q4 fiscal 2026 through dividends and share repurchases.
2. Deteriorating European potato crop conditions introduced uncertainty regarding international segment profitability.
Concerns over the 2026 European potato crop significantly impacted the stock outlook. Analysts, including Stephens, lowered price targets in late September 2026 (e.g., to $50 from $55), citing a material worsening of the crop due to extreme heat, resulting in lower acreage, weaker yields, and smaller potato sizing. This agricultural challenge is expected to increase procurement costs for fiscal year 2027 and slow the recovery of the European market, dampening investor enthusiasm for the company's international segment.
3. Shifting and mixed analyst sentiment contributed to a balanced "Hold" consensus.
Following the strong fiscal Q4 2026 results in July, some analysts reacted positively, with Barclays raising its price objective to $56 from $50 and Stifel Nicolaus increasing its target to $52 from $45. However, by September and October 2026, concerns related to the European potato crop and broader market conditions led other firms, such as JPMorgan and Stephens, to reduce their price targets (to $46 from $52 and to $50 from $55, respectively). This created a balanced, rather than decisively bullish or bearish, outlook, resulting in a "Hold" consensus rating from 13 Wall Street analysts with an average price target of $52.73.
Show less
Stock Movement Drivers
Fundamental Drivers
The 4.0% change in LW stock from 6/30/2026 to 10/5/2026 was primarily driven by a 6.7% change in the company's P/E Multiple.| (LTM values as of) | 6302026 | 10052026 | Change |
|---|---|---|---|
| Stock Price ($) | 42.86 | 44.57 | 4.0% |
| Change Contribution By: | |||
| Total Revenues ($ Mil) | 6,518 | 6,612 | 1.4% |
| Net Income Margin (%) | 4.6% | 4.4% | -4.8% |
| P/E Multiple | 19.8 | 21.2 | 6.7% |
| Shares Outstanding (Mil) | 139 | 138 | 0.9% |
| Cumulative Contribution | 4.0% |
Market Drivers
6/30/2026 to 10/5/2026| Return | Correlation | |
|---|---|---|
| LW | 4.0% | |
| Market (SPY) | 3.8% | 10.1% |
| Sector (XLP) | -2.4% | 48.0% |
Fundamental Drivers
The 7.2% change in LW stock from 3/31/2026 to 10/5/2026 was primarily driven by a 43.2% change in the company's P/E Multiple.| (LTM values as of) | 3312026 | 10052026 | Change |
|---|---|---|---|
| Stock Price ($) | 41.58 | 44.57 | 7.2% |
| Change Contribution By: | |||
| Total Revenues ($ Mil) | 6,474 | 6,612 | 2.1% |
| Net Income Margin (%) | 6.1% | 4.4% | -27.6% |
| P/E Multiple | 14.8 | 21.2 | 43.2% |
| Shares Outstanding (Mil) | 139 | 138 | 1.2% |
| Cumulative Contribution | 7.2% |
Market Drivers
3/31/2026 to 10/5/2026| Return | Correlation | |
|---|---|---|
| LW | 7.2% | |
| Market (SPY) | 19.4% | 8.3% |
| Sector (XLP) | -0.5% | 43.3% |
Fundamental Drivers
The -20.9% change in LW stock from 9/30/2025 to 10/5/2026 was primarily driven by a -20.8% change in the company's P/E Multiple.| (LTM values as of) | 9302025 | 10052026 | Change |
|---|---|---|---|
| Stock Price ($) | 56.34 | 44.57 | -20.9% |
| Change Contribution By: | |||
| Total Revenues ($ Mil) | 6,456 | 6,612 | 2.4% |
| Net Income Margin (%) | 4.6% | 4.4% | -3.7% |
| P/E Multiple | 26.7 | 21.2 | -20.8% |
| Shares Outstanding (Mil) | 140 | 138 | 1.3% |
| Cumulative Contribution | -20.9% |
Market Drivers
9/30/2025 to 10/5/2026| Return | Correlation | |
|---|---|---|
| LW | -20.9% | |
| Market (SPY) | 17.3% | 8.0% |
| Sector (XLP) | 5.6% | 35.3% |
Fundamental Drivers
The -48.2% change in LW stock from 9/30/2023 to 10/5/2026 was primarily driven by a -76.7% change in the company's Net Income Margin (%).| (LTM values as of) | 9302023 | 10052026 | Change |
|---|---|---|---|
| Stock Price ($) | 86.05 | 44.57 | -48.2% |
| Change Contribution By: | |||
| Total Revenues ($ Mil) | 5,351 | 6,612 | 23.6% |
| Net Income Margin (%) | 18.9% | 4.4% | -76.7% |
| P/E Multiple | 12.5 | 21.2 | 70.0% |
| Shares Outstanding (Mil) | 146 | 138 | 6.0% |
| Cumulative Contribution | -48.2% |
Market Drivers
9/30/2023 to 10/5/2026| Return | Correlation | |
|---|---|---|
| LW | -48.2% | |
| Market (SPY) | 87.5% | 21.4% |
| Sector (XLP) | 26.9% | 30.1% |
Price Returns Compared
| 2021 | 2022 | 2023 | 2024 | 2025 | 2026 | Total [1] | |
|---|---|---|---|---|---|---|---|
| Returns | |||||||
| LW Return | -18% | 43% | 22% | -37% | -36% | 7% | -38% |
| Peers Return | 10% | 1% | -12% | -10% | -25% | -20% | -47% |
| S&P 500 Return | 27% | -19% | 24% | 23% | 16% | 13% | 106% |
Monthly Win Rates [3] | |||||||
| LW Win Rate | 33% | 83% | 58% | 50% | 50% | 70% | |
| Peers Win Rate | 50% | 54% | 44% | 48% | 40% | 42% | |
| S&P 500 Win Rate | 75% | 42% | 67% | 75% | 67% | 50% | |
Max Drawdowns [4] | |||||||
| LW Max Drawdown | -41% | -29% | -28% | -51% | -37% | -26% | |
| Peers Max Drawdown | -21% | -29% | -36% | -25% | -34% | -34% | |
| S&P 500 Max Drawdown | -5% | -25% | -10% | -8% | -19% | -9% | |
[1] Cumulative total returns since the beginning of 2021
[2] Peers: CAG, KHC, GIS, BGS. See LW Returns vs. Peers.
[3] Win Rate = % of calendar months in which monthly returns were positive
[4] Max drawdown represents maximum peak-to-trough decline within a year
[5] 2026 data is for the year up to 10/5/2026 (YTD)
How Low Can It Go
| Event | LW | S&P 500 |
|---|---|---|
| 2025 US Tariff Shock | ||
| % Loss | -14.9% | -18.8% |
| % Gain to Breakeven | 17.5% | 23.1% |
| Time to Breakeven | 21 days | 79 days |
| 2024 Yen Carry Trade Unwind | ||
| % Loss | -32.0% | -7.8% |
| % Gain to Breakeven | 47.1% | 8.5% |
| Time to Breakeven | 85 days | 18 days |
| Summer-Fall 2023 Five Percent Yield Shock | ||
| % Loss | -20.6% | -9.5% |
| % Gain to Breakeven | 25.9% | 10.5% |
| Time to Breakeven | 61 days | 24 days |
| 2022 Inflation Shock & Fed Tightening | ||
| % Loss | -21.5% | -24.5% |
| % Gain to Breakeven | 27.5% | 32.4% |
| Time to Breakeven | 24 days | 427 days |
| 2020 COVID-19 Crash | ||
| % Loss | -52.3% | -33.7% |
| % Gain to Breakeven | 109.6% | 50.9% |
| Time to Breakeven | 1023 days | 140 days |
| 2016-2017 Trump Reflation Bond Selloff | ||
| % Loss | -12.1% | -3.7% |
| % Gain to Breakeven | 13.8% | 3.9% |
| Time to Breakeven | 26 days | 6 days |
In The Past
Lamb Weston's stock fell -14.9% during the 2025 US Tariff Shock. Such a loss loss requires a 17.5% gain to breakeven.
Preserve Wealth
Limiting losses and compounding gains is essential to preserving wealth.
Asset Allocation
Actively managed asset allocation strategies protect wealth. Learn more.
| Event | LW | S&P 500 |
|---|---|---|
| 2024 Yen Carry Trade Unwind | ||
| % Loss | -32.0% | -7.8% |
| % Gain to Breakeven | 47.1% | 8.5% |
| Time to Breakeven | 85 days | 18 days |
| Summer-Fall 2023 Five Percent Yield Shock | ||
| % Loss | -20.6% | -9.5% |
| % Gain to Breakeven | 25.9% | 10.5% |
| Time to Breakeven | 61 days | 24 days |
| 2022 Inflation Shock & Fed Tightening | ||
| % Loss | -21.5% | -24.5% |
| % Gain to Breakeven | 27.5% | 32.4% |
| Time to Breakeven | 24 days | 427 days |
| 2020 COVID-19 Crash | ||
| % Loss | -52.3% | -33.7% |
| % Gain to Breakeven | 109.6% | 50.9% |
| Time to Breakeven | 1023 days | 140 days |
In The Past
Lamb Weston's stock fell -14.9% during the 2025 US Tariff Shock. Such a loss loss requires a 17.5% gain to breakeven.
Preserve Wealth
Limiting losses and compounding gains is essential to preserving wealth.
Asset Allocation
Actively managed asset allocation strategies protect wealth. Learn more.
About Lamb Weston (LW)
Lamb Weston Holdings, Inc. (LW) is a global leader in the production, distribution, and marketing of value-added frozen potato products. While primarily known for its potato offerings, the company also has operations in the vegetable and dairy sectors. It leverages its extensive supply chain to serve a diverse client base worldwide.
The core of Lamb Weston's business revolves around its wide array of frozen potato products, which include everything from classic fries and hash browns to specialized commercial ingredients and appetizers. These products are sold under its flagship "Lamb Weston" brand, as well as popular consumer brands like "Grown in Idaho" and "Alexia." The company also produces products for other licensed brands and retailers' private labels.
Lamb Weston serves a broad spectrum of customers across its Global, Foodservice, and Retail segments. In the retail sector, its products can be found in grocery stores, mass merchandisers, club stores, and specialty retailers. For its foodservice clients, Lamb Weston supplies businesses, independent and regional chain restaurants, convenience stores, and institutional clients such as educational facilities.
AI Analysis | Feedback
Here are 1-2 brief analogies for Lamb Weston:
They're like the Tyson Foods for potatoes, processing the commodity into various products for both restaurants and grocery stores.
Think of them as the Frito-Lay for frozen potato products, with popular brands like Grown in Idaho and Alexia found in freezers worldwide.
AI Analysis | Feedback
- Frozen Potato Products: The company's core business involves producing, distributing, and marketing various value-added frozen potato products.
- Commercial Food Ingredients: Lamb Weston offers commercial ingredients, likely potato-based, to other businesses and food manufacturers.
- Frozen Appetizers: The company produces and markets a range of frozen appetizers under its own brands and for customer labels.
- Vegetable Products: Lamb Weston is also involved in the business of various vegetable-based products.
- Dairy Products: The company engages in the dairy business, providing dairy-related offerings.
AI Analysis | Feedback
Lamb Weston Holdings, Inc. (symbol: LW) primarily sells its products to other companies (B2B).
The provided background information does not explicitly name specific major customer companies. However, it broadly categorizes Lamb Weston's customers into the following segments:
- Retail Customers: This category includes various types of retailers such as grocery, mass, club, and specialty retailers. These customers purchase Lamb Weston's owned or licensed brands (e.g., Grown in Idaho, Alexia) and products for sale under their own private labels.
- Foodservice Customers: This category encompasses a wide range of businesses and institutions. It includes independent restaurants, regional chain restaurants, convenience stores, and educational institutions. These customers utilize Lamb Weston's frozen potato products, commercial ingredients, and appetizers in their operations.
AI Analysis | Feedback
AI Analysis | Feedback
Michael J. Smith, President and Chief Executive Officer
Michael J. Smith was appointed President and Chief Executive Officer of Lamb Weston in January 2025. He joined Lamb Weston in 2007 and has held increasingly senior leadership roles, including Chief Operating Officer from May 2023 to January 2025. Prior to his COO role, he served as Senior Vice President, Foodservice, Retail, Innovation and Marketing, and Senior Vice President, Growth and Strategy. Before joining Conagra Brands, Inc. in 2007 (Lamb Weston's former parent company), he held various brand management positions at Dean Foods Company. Mr. Smith holds a bachelor's degree in marketing from Brigham Young University and an MBA from the Cox School of Business at Southern Methodist University.
James D. Gray, Chief Financial Officer
James D. Gray will join Lamb Weston as Chief Financial Officer on April 2, 2026, succeeding Bernadette Madarieta, who will transition to an interim advisory role. Mr. Gray most recently served for 12 years as Executive Vice President and CFO at Ingredion, a global ingredients solutions company. Earlier in his career, he held finance leadership roles at PepsiCo for over a decade and began his career at Bain & Company.
Jan Craps, Executive Chair
Jan Craps joined Lamb Weston in February 2026 as Executive Chair, a newly created position. In this role, he focuses on board leadership, mergers and acquisitions, governance, oversight, international market execution, and long-term strategy. Prior to Lamb Weston, he spent more than 20 years with Anheuser-Busch InBev, most recently as the CEO and Co-Chair of Budweiser Brewing Company APAC, and CEO, APAC. He has experience leading large-scale transformations and managing multibillion-dollar consumer businesses across Europe, Canada, Australia, and Asia. Mr. Craps began his career at McKinsey & Company.
Mike Crowley, President, North America
Mike Crowley was appointed President, North America in January 2025. He is responsible for all Lamb Weston commercial channels in North America, including Foodservice, Retail, and Multi-National Chains. Previously, he served as Senior Vice President & General Manager, Multinational-Chains, where he oversaw strategic global customer partnerships.
Marc Schroeder, President, International
Marc Schroeder serves as the President, International for Lamb Weston.
AI Analysis | Feedback
The key risks to Lamb Weston's business include volatility in its supply chain and input costs, intense competition and pricing pressure within a softening demand environment, and operational execution challenges, particularly related to its ERP system implementation.
- Supply Chain and Input Cost Volatility: Lamb Weston faces significant risks from disruptions and volatility in its supply chain, particularly concerning the availability and cost of key raw materials like potatoes and edible oils. Poor potato harvests, influenced by adverse weather conditions such as extreme heat, can lead to lower quality and yields, increasing the cost per pound of finished product. The company also grapples with inflation in other critical inputs, including labor, energy, and transportation, which directly elevate manufacturing costs and can negatively impact profitability. Climate change is also recognized as a potential risk to agricultural productivity and the pricing of raw materials.
- Intense Competition and Pricing Pressure in a Softening Demand Environment: The frozen potato products industry is highly competitive, leading to ongoing pricing pressure and unfavorable price/mix dynamics for Lamb Weston. This competitive landscape is exacerbated by a global softening in demand for frozen fries, driven by factors such as reduced restaurant traffic and menu price inflation. Large customers, which constitute a significant portion of Lamb Weston's sales (e.g., McDonald's representing a mid-teen volume percentage), can leverage their power in low-demand situations, further intensifying pricing pressure and affecting margins.
- Operational Execution Challenges, Including ERP System Disruptions: Lamb Weston has encountered persistent difficulties with operational execution, both commercially and within its supply chain. A notable challenge has been the implementation of a new Enterprise Resource Planning (ERP) system, which has caused temporary operational disruptions, led to higher-than-anticipated costs, and contributed to the loss of some customers. These execution difficulties hinder the company's ability to meet financial targets and growth expectations.
AI Analysis | Feedback
AI Analysis | Feedback
Lamb Weston Holdings, Inc. operates in significant addressable markets for its main products, primarily frozen potato products and appetizers.
The global frozen potatoes market was valued at approximately USD 65.4 billion in 2024 and is projected to reach USD 112 billion by 2034, growing at a Compound Annual Growth Rate (CAGR) of 5.6%. Another estimate places the global frozen potatoes market at USD 65.56 billion in 2024, with a projected growth to USD 99.85 billion by 2032, expanding at a CAGR of 5.4%.
In North America, a key region for Lamb Weston, the frozen potato market was valued at around USD 23.73 billion in 2023 and is expected to reach USD 35.02 billion by 2031, demonstrating a CAGR of 5.0%. The U.S. market alone for frozen potatoes was worth over USD 11.5 billion in 2024. Lamb Weston is North America's largest producer of frozen potato products, holding more than a 40% share in this market.
The European frozen potato market was valued at approximately USD 20.01 billion in 2023 and is anticipated to reach USD 28.44 billion by 2031, with a CAGR of 4.5%. Another source indicates the European frozen potatoes market size was worth USD 18.18 billion in 2025 and is projected to grow to USD 24.73 billion by 2034.
For appetizers, which fall under the broader category of frozen snacks, the global frozen snacks market reached USD 102.1 billion in 2022 and is projected to reach USD 140.8 billion by 2030, growing at a CAGR of 4.1% during 2024-2031. Another projection estimates the global frozen snacks market at USD 153.91 billion in 2025, with an anticipated increase to approximately USD 262.90 billion by 2035, reflecting a CAGR of 5.5%. Potato-based snacks, a significant component of Lamb Weston's offerings, held a 32.62% share of the frozen snacks market in 2025.
AI Analysis | Feedback
Lamb Weston Holdings, Inc. (LW) is expected to drive future revenue growth over the next 2-3 years through several key strategies:
- Volume Growth, particularly in North America and Asia: The company has reported significant volume increases, especially in North America and Asia, and has restarted previously curtailed North American production lines to meet higher demand. North America volumes are expected to continue growing at or above first-half rates.
- Customer Contract Wins and Share Gains: Lamb Weston's "Focus to Win" strategy and recent customer contract wins, along with share gains and retention, are noted as direct contributors to volume growth and sales across its segments.
- Strategic Market Positioning and Expanded Global Footprint: The company leverages its leading market positions, being #1 in North America and #2 globally, along with an advantaged global manufacturing footprint, to support customer growth across all regions and channels.
- Innovation Leadership: Lamb Weston emphasizes its innovation leadership in the frozen potato category as a strategy that creates opportunities to drive growth.
AI Analysis | Feedback
Share Repurchases
- Lamb Weston's Board of Directors authorized an increase in the share repurchase program from $500 million to $750 million in December 2024.
- The company repurchased $282.0 million of its common stock, totaling 4,867,449 shares, during fiscal 2025.
- In the first half of fiscal 2026 (ending November 2025), Lamb Weston repurchased over $50 million in stock. Approximately $308 million remained authorized under the program as of November 2025.
Share Issuance
- Shares outstanding have generally shown a decline over the last 3-5 years, with 2025 shares outstanding being 0.143 billion, a 1.99% decrease from 2024.
Outbound Investments
- In February 2023, Lamb Weston completed the acquisition of the remaining equity interests in its European joint venture with Meijer Frozen Foods B.V.
- In July 2022, the company purchased an additional 40% stake in Lamb Weston Alimentos Modernos S.A. (LWAMSA), its joint venture in Argentina, increasing its total ownership to 90%.
Capital Expenditures
- Capital expenditures amounted to $736 million during fiscal 2023, primarily for construction costs related to expanding processing capacity, including breaking ground on a 250 million-pound capacity expansion for the South American market and progressing on projects in China and the Netherlands.
- In fiscal 2025, capital expenditures were $650.7 million, with a primary focus on completing strategic capacity expansion projects in China, the U.S., and the Netherlands, and a project in Argentina expected to begin production in August 2025.
- For fiscal 2026, capital expenditures are expected to be below the $500 million target, as major growth investments were completed in fiscal 2025 and early fiscal 2026, and the company is focusing on disciplined investment for sustaining performance.
Peer Outperformance in Packaged Foods & Meats
| Ticker | Name | Rev Growth 3Y Avg | P/E | 1Y | 3Y | 5Y | 5Y Gap |
|---|---|---|---|---|---|---|---|
| LW | Lamb Weston | 7.7% | 21.2x | -26.9% | -48.8% | -21.2% | — |
| CALM | Cal-Maine Foods | 4.4% | 51.7x | -27.7% | 63.1% | 135.9% | +157pp |
| MDLZ | Mondelez International | 5.2% | 64.1x | -3.4% | 1.0% | 11.2% | +32pp |
| POST | Post | 8.5% | 11.2x | -32.3% | -11.6% | 2.8% | +24pp |
| HSY | Hershey | 3.9% | 21.9x | -15.0% | -10.3% | 1.7% | +23pp |
| Industry | Names | 1Y med | 3Y med | 5Y med | Top 3 by 5Y |
|---|---|---|---|---|---|
| Consumer Staples Merchandise Retail | 12 | 3.8% | 37.2% | 61.8% | NGVC 220% · VLGEA 150% · WMT 144% |
| Food Retail | 6 | -9.3% | 53.1% | 29.6% | CASY 236% · SFM 192% · KR 66% |
| Tobacco | 6 | -41.2% | 7.3% | 18.7% | PM 147% · MO 115% · TPB 24% |
| Food Distributors | 9 | -4.3% | 32.8% | 7.6% | CHEF 236% · USFD 162% · ANDE 131% |
| Soft Drinks & Non-alcoholic Beverages | 12 | -8.0% | -12.6% | -0.6% | COKE 408% · CCHGY 112% · BRFH 110% |
| Brewers | 3 | -17.7% | -31.3% | -8.9% | BUD 46% · TAP -9% · SAM -68% |
| Agricultural Products & Services | 11 | -10.7% | -1.7% | -16.7% | ADM 52% · BG 46% · ALCO 20% |
| Household Products | 19 | -1.6% | -7.0% | -19.2% | ACU 107% · IPAR 63% · CL 29% |
| Personal Care Products | 4 | -1.3% | -1.7% | -24.6% | ELF 248% · PG 18% · COTY -67% |
| Packaged Foods & Meats ← | 48 | -32.3% | -37.8% | -43.1% | MAMA 460% · LWAY 289% · SENEA 246% |
| Distillers & Vintners | 5 | -45.8% | -57.3% | -80.2% | STZ -41% · BF-B -56% · MGPI -80% |
| Drug Retail | 3 | -49.6% | -86.5% | -94.4% | HITI -52% · PETS -94% · SCNX -100% |
Latest Trefis Analyses
Research & Analysis
Invest in Strategies
Wealth Management
Peer Comparisons
| Peers to compare with: |
Financials
| Median | |
|---|---|
| Name | |
| Mkt Price | 21.88 |
| Mkt Cap | 6.4 |
| Rev LTM | 11,245 |
| Op Inc LTM | 1,222 |
| FCF LTM | 877 |
| FCF 3Y Avg | 1,160 |
| CFO LTM | 1,277 |
| CFO 3Y Avg | 1,554 |
Growth & Margins
| Median | |
|---|---|
| Name | |
| Rev Chg LTM | -1.8% |
| Rev Chg 3Y Avg | -2.9% |
| Rev Chg Q | -1.4% |
| QoQ Delta Rev Chg LTM | -0.4% |
| Op Inc Chg LTM | -10.6% |
| Op Inc Chg 3Y Avg | -5.5% |
| Op Mgn LTM | 10.9% |
| Op Mgn 3Y Avg | 12.9% |
| QoQ Delta Op Mgn LTM | -0.3% |
| CFO/Rev LTM | 11.4% |
| CFO/Rev 3Y Avg | 13.4% |
| FCF/Rev LTM | 8.2% |
| FCF/Rev 3Y Avg | 10.0% |
Valuation
| Median | |
|---|---|
| Name | |
| Mkt Cap | 6.4 |
| P/S | 0.9 |
| P/Op Inc | 6.1 |
| P/EBIT | 3.1 |
| P/E | -3.3 |
| P/CFO | 5.6 |
| Total Yield | -4.8% |
| Dividend Yield | 7.7% |
| FCF Yield 3Y Avg | 10.8% |
| D/E | 0.8 |
| Net D/E | 0.8 |
Returns
| Median | |
|---|---|
| Name | |
| 1M Rtn | -14.9% |
| 3M Rtn | -10.4% |
| 6M Rtn | -12.6% |
| 12M Rtn | -25.6% |
| 3Y Rtn | -42.1% |
| 1M Excs Rtn | -16.0% |
| 3M Excs Rtn | -15.7% |
| 6M Excs Rtn | -30.3% |
| 12M Excs Rtn | -41.6% |
| 3Y Excs Rtn | -124.2% |
Comparison Analyses
Segment Financials
Revenue by Segment| $ Mil | 2025 | 2024 | 2023 | 2022 |
|---|---|---|---|---|
| Single Segment | 6,451 | 6,468 | 5,351 | |
| Foodservice | 1,318 | |||
| Global | 2,064 | |||
| Other | 122 | |||
| Retail | 595 | |||
| Total | 6,451 | 6,468 | 5,351 | 4,099 |
| $ Mil | 2023 | 2021 | 2020 | 2019 |
|---|---|---|---|---|
| Global | 596 | 306 | 374 | 446 |
| Foodservice | 551 | 340 | 356 | 402 |
| Retail | 280 | 120 | 118 | 99 |
| Advertising and promotion expenses | 34 | 18 | ||
| Other | -29 | 48 | 24 | 24 |
| Selling, general and administrative expenses | -550 | -357 | -315 | -303 |
| Total | 882 | 475 | 557 | 668 |
Price Behavior
| Market Price | $44.57 | |
| Market Cap ($ Bil) | 6.1 | |
| First Trading Date | 11/01/2016 | |
| Distance from 52W High | -31.0% | |
| 50 Days | 200 Days | |
| DMA Price | $50.12 | $45.29 |
| DMA Trend | down | up |
| Distance from DMA | -11.1% | -1.6% |
| 3M | 1YR | |
| Volatility | 32.8% | 41.1% |
| Downside Capture | 117.60 | 39.12 |
| Upside Capture | 84.86 | -4.16 |
| Correlation (SPY) | 10.4% | 7.4% |
| 1M | 2M | 3M | 6M | 1Y | 3Y | |
|---|---|---|---|---|---|---|
| Beta | 0.44 | 0.66 | 0.14 | 0.17 | 0.23 | 0.60 |
| Up Beta | 0.83 | -0.61 | -1.47 | 0.01 | 0.26 | 0.60 |
| Down Beta | 1.35 | 1.15 | 0.25 | -0.04 | 0.26 | 0.52 |
| Up Capture | -99% | 22% | 52% | 20% | 1% | 15% |
| Bmk +ve Days | 6 | 16 | 27 | 66 | 132 | 424 |
| Stock +ve Days | 6 | 18 | 31 | 67 | 130 | 384 |
| Down Capture | 316% | 237% | 79% | 40% | 46% | 96% |
| Bmk -ve Days | 16 | 26 | 37 | 60 | 120 | 328 |
| Stock -ve Days | 16 | 24 | 33 | 59 | 121 | 362 |
[1] Upside and downside betas calculated using positive and negative benchmark daily returns respectively
Based On 1-Year Data
| Annualized Return | Annualized Volatility | Sharpe Ratio | Correlation with LW | |
|---|---|---|---|---|
| LW | -26.1% | 41.0% | -0.62 | - |
| Sector ETF (XLP) | 6.2% | 14.5% | 0.18 | 36.0% |
| Equity (SPY) | 16.8% | 13.0% | 0.92 | 7.7% |
| Gold (GLD) | 7.0% | 29.6% | 0.23 | 10.1% |
| Commodities (DBC) | 45.9% | 20.9% | 1.71 | -14.5% |
| Real Estate (VNQ) | 1.6% | 13.6% | -0.14 | 26.3% |
| Bitcoin (BTCUSD) | -30.1% | 44.3% | -0.68 | 1.6% |
Smart multi-asset allocation framework can stack odds in your favor. Learn How
Based On 5-Year Data
| Annualized Return | Annualized Volatility | Sharpe Ratio | Correlation with LW | |
|---|---|---|---|---|
| LW | -4.4% | 37.8% | -0.02 | - |
| Sector ETF (XLP) | 5.5% | 13.7% | 0.18 | 34.7% |
| Equity (SPY) | 13.3% | 17.2% | 0.59 | 27.8% |
| Gold (GLD) | 18.3% | 18.9% | 0.78 | 1.1% |
| Commodities (DBC) | 10.0% | 19.6% | 0.39 | -4.9% |
| Real Estate (VNQ) | 0.9% | 18.8% | -0.06 | 29.3% |
| Bitcoin (BTCUSD) | 14.9% | 52.2% | 0.45 | 10.1% |
Smart multi-asset allocation framework can stack odds in your favor. Learn How
Based On 10-Year Data
| Annualized Return | Annualized Volatility | Sharpe Ratio | Correlation with LW | |
|---|---|---|---|---|
| LW | 4.4% | 35.8% | 0.23 | - |
| Sector ETF (XLP) | 7.0% | 14.9% | 0.34 | 38.8% |
| Equity (SPY) | 15.4% | 17.9% | 0.73 | 38.8% |
| Gold (GLD) | 11.5% | 16.4% | 0.57 | 3.2% |
| Commodities (DBC) | 8.4% | 18.1% | 0.38 | 10.6% |
| Real Estate (VNQ) | 4.1% | 20.7% | 0.16 | 42.1% |
| Bitcoin (BTCUSD) | 64.0% | 66.2% | 1.04 | 10.6% |
Smart multi-asset allocation framework can stack odds in your favor. Learn How
Earnings Returns History
Updated 10/6/2026| Forward Returns | |||
|---|---|---|---|
| Earnings Date | 1D Returns | 5D Returns | 21D Returns |
| 7/24/2026 | 0.8% | 8.9% | 10.0% |
| 4/1/2026 | -8.9% | -1.6% | 3.1% |
| 12/19/2025 | -25.9% | -29.0% | -25.3% |
| 9/30/2025 | 4.3% | 13.9% | 17.8% |
| 7/23/2025 | 16.3% | 20.9% | 13.0% |
| 4/3/2025 | 10.0% | 2.0% | -4.2% |
| 12/19/2024 | -20.1% | -16.5% | -22.2% |
| 10/2/2024 | 2.6% | 6.6% | 16.7% |
| ... | |||
| SUMMARY STATS | |||
| # Positive | 14 | 15 | 13 |
| # Negative | 10 | 9 | 11 |
| Median Positive | 4.3% | 6.6% | 9.3% |
| Median Negative | -11.2% | -11.5% | -12.1% |
| Max Positive | 16.3% | 20.9% | 17.8% |
| Max Negative | -28.2% | -29.0% | -25.3% |
| Forward Returns | |||
|---|---|---|---|
| Earnings Date | 1D Returns | 5D Returns | 21D Returns |
| 7/24/2026 | 0.8% | 8.9% | 10.0% |
| 4/1/2026 | -8.9% | -1.6% | 3.1% |
| 12/19/2025 | -25.9% | -29.0% | -25.3% |
| 9/30/2025 | 4.3% | 13.9% | 17.8% |
| 7/23/2025 | 16.3% | 20.9% | 13.0% |
| 4/3/2025 | 10.0% | 2.0% | -4.2% |
| 12/19/2024 | -20.1% | -16.5% | -22.2% |
| 10/2/2024 | 2.6% | 6.6% | 16.7% |
| 7/24/2024 | -28.2% | -24.3% | -20.4% |
| 4/4/2024 | -19.4% | -21.0% | -16.1% |
| 1/4/2024 | 0.3% | 2.1% | 1.5% |
| 10/5/2023 | 8.0% | 1.5% | 3.9% |
| 7/25/2023 | -6.8% | -8.0% | -14.3% |
| 4/6/2023 | 2.6% | 5.1% | 7.9% |
| 1/5/2023 | 9.8% | 11.2% | 12.5% |
| 10/5/2022 | 4.2% | 3.2% | 9.3% |
| 7/27/2022 | 2.6% | 8.3% | 10.0% |
| 4/7/2022 | 8.0% | 11.4% | 4.9% |
| 1/6/2022 | 7.4% | 9.0% | -0.2% |
| 10/7/2021 | -6.6% | -10.2% | -9.6% |
| 7/27/2021 | -13.5% | -11.5% | -12.1% |
| 4/7/2021 | -3.6% | -4.0% | -2.8% |
| 1/7/2021 | -1.2% | 0.1% | 4.1% |
| 10/7/2020 | 2.9% | 2.6% | -4.2% |
| SUMMARY STATS | |||
| # Positive | 14 | 15 | 13 |
| # Negative | 10 | 9 | 11 |
| Median Positive | 4.3% | 6.6% | 9.3% |
| Median Negative | -11.2% | -11.5% | -12.1% |
| Max Positive | 16.3% | 20.9% | 17.8% |
| Max Negative | -28.2% | -29.0% | -25.3% |
SEC Filings
Expand for More| Report Date | Filing Date | Filing |
|---|---|---|
| 05/31/2026 | 07/24/2026 | 10-K |
| 02/28/2026 | 04/01/2026 | 10-Q |
| 11/30/2025 | 12/19/2025 | 10-Q |
| 08/31/2025 | 09/30/2025 | 10-Q |
| 05/31/2025 | 07/23/2025 | 10-K |
| 02/28/2025 | 04/03/2025 | 10-Q |
| 11/30/2024 | 12/20/2024 | 10-Q |
| 08/31/2024 | 10/02/2024 | 10-Q |
| 05/31/2024 | 07/24/2024 | 10-K |
| 02/29/2024 | 04/04/2024 | 10-Q |
| 11/30/2023 | 01/04/2024 | 10-Q |
| 08/31/2023 | 10/05/2023 | 10-Q |
| 05/31/2023 | 07/25/2023 | 10-K |
| 02/28/2023 | 04/06/2023 | 10-Q |
| 11/30/2022 | 01/05/2023 | 10-Q |
| 08/31/2022 | 10/05/2022 | 10-Q |
| Report Date | Filing Date | Filing |
|---|---|---|
| 05/31/2026 | 07/24/2026 | 10-K |
| 02/28/2026 | 04/01/2026 | 10-Q |
| 11/30/2025 | 12/19/2025 | 10-Q |
| 08/31/2025 | 09/30/2025 | 10-Q |
| 05/31/2025 | 07/23/2025 | 10-K |
| 02/28/2025 | 04/03/2025 | 10-Q |
| 11/30/2024 | 12/20/2024 | 10-Q |
| 08/31/2024 | 10/02/2024 | 10-Q |
| 05/31/2024 | 07/24/2024 | 10-K |
| 02/29/2024 | 04/04/2024 | 10-Q |
| 11/30/2023 | 01/04/2024 | 10-Q |
| 08/31/2023 | 10/05/2023 | 10-Q |
| 05/31/2023 | 07/25/2023 | 10-K |
| 02/28/2023 | 04/06/2023 | 10-Q |
| 11/30/2022 | 01/05/2023 | 10-Q |
| 08/31/2022 | 10/05/2022 | 10-Q |
| 05/31/2022 | 07/27/2022 | 10-K |
| 02/28/2022 | 04/07/2022 | 10-Q |
| 11/30/2021 | 01/06/2022 | 10-Q |
| 08/31/2021 | 10/07/2021 | 10-Q |
| 05/31/2021 | 07/27/2021 | 10-K |
| 02/28/2021 | 04/07/2021 | 10-Q |
| 11/30/2020 | 01/07/2021 | 10-Q |
| 08/31/2020 | 10/07/2020 | 10-Q |
| 05/31/2020 | 07/28/2020 | 10-K |
| 02/29/2020 | 04/01/2020 | 10-Q |
| 11/30/2019 | 01/03/2020 | 10-Q |
| 08/31/2019 | 10/02/2019 | 10-Q |
Recent Forward Guidance
Updated 10/6/2026Latest: Q1 2027 Earnings Reported 10/6/2026
| Forward Guidance | Guidance Change | |||||||
|---|---|---|---|---|---|---|---|---|
| Metric | Source | Low | Mid | High | % Chg | % Delta | Change | Prior |
| Q2 2027 Quarterly Dividend | Reported | 0.38 | ||||||
| 2027 Adjusted Income from Operations | Reported | 730.00 Mil | 770.00 Mil | 810.00 Mil | 1.3% | Raised | Guidance: 760.00 Mil for 2027 | |
| 2027 Depreciation and amortization expense | Reported | 410.00 Mil | 0.0% | Affirmed | Guidance: 410.00 Mil for 2027 | |||
| 2027 Diluted outstanding common shares | Reported | 137.50 Mil | 138.25 Mil | 139.00 Mil | 0.0% | Affirmed | Guidance: 138.25 Mil for 2027 | |
| 2027 Net cash provided by operating activities | Reported | 750.00 Mil | 775.00 Mil | 800.00 Mil | 0.0% | Affirmed | Guidance: 775.00 Mil for 2027 | |
| 2027 Adjusted EBITDA | Reported | 1.12 Bil | 1.17 Bil | 1.22 Bil | 1.7% | Raised | Guidance: 1.15 Bil for 2027 | |
| 2027 Interest expense, net | Reported | 185.00 Mil | 187.50 Mil | 190.00 Mil | -1.3% | Lowered | Guidance: 190.00 Mil for 2027 | |
| 2027 Adjusted effective tax rate | Reported | 25.0% | 26.0% | 27.0% | -0.5% | Lowered | Guidance: 26.5% for 2027 | |
| 2027 Adjusted Diluted EPS | Reported | 3.05 | 3.2 | 3.35 | 3.2% | Raised | Guidance: 3.1 for 2027 | |
| 2027 Capital expenditures (cash outflows) | Reported | 380.00 Mil | 395.00 Mil | 410.00 Mil | 0.0% | Affirmed | Guidance: 395.00 Mil for 2027 | |
| 2027 Capital expenditures (accrual basis) | Reported | 330.00 Mil | 340.00 Mil | 350.00 Mil | ||||
Prior: Q4 2026 Earnings Reported 7/24/2026
| Forward Guidance | Guidance Change | |||||||
|---|---|---|---|---|---|---|---|---|
| Metric | Source | Low | Mid | High | % Chg | % Delta | Change | Prior |
| 2027 Adjusted Income from Operations | Reported | 720.00 Mil | 760.00 Mil | 800.00 Mil | ||||
| 2027 Depreciation and Amortization | Reported | 410.00 Mil | ||||||
| 2027 Diluted Outstanding Common Shares | Reported | 137.50 Mil | 138.25 Mil | 139.00 Mil | ||||
| 2027 Net Cash Provided by Operating Activities | Reported | 750.00 Mil | 775.00 Mil | 800.00 Mil | ||||
| 2027 Net Sales Growth | Reported | 0.0% | 0.5% | 1.0% | ||||
| 2027 Adjusted EBITDA | Reported | 1.10 Bil | 1.15 Bil | 1.20 Bil | 3.6% | Higher New | Guidance: 1.11 Bil for 2026 | |
| 2027 Interest Expense, net | Reported | 190.00 Mil | ||||||
| 2027 Adjusted Effective Tax Rate | Reported | 25.5% | 26.5% | 27.5% | ||||
| 2027 Adjusted Diluted EPS | Reported | 2.95 | 3.1 | 3.25 | ||||
| 2027 Capital Expenditures | Reported | 380.00 Mil | 395.00 Mil | 410.00 Mil | -1.2% | Lower New | Guidance: 400.00 Mil for 2026 | |
Q3 2026 Earnings Reported 4/1/2026
| Forward Guidance | Guidance Change | |||||||
|---|---|---|---|---|---|---|---|---|
| Metric | Source | Low | Mid | High | % Chg | % Delta | Change | Prior |
| 2026 Net Sales | Reported | 6.45 Bil | 6.50 Bil | 6.55 Bil | 0.8% | Raised | Guidance: 6.45 Bil for 2026 | |
| 2026 Adjusted EBITDA | Reported | 1.08 Bil | 1.11 Bil | 1.14 Bil | 0.9% | Raised | Guidance: 1.10 Bil for 2026 | |
| 2026 Cash Used for Capital Expenditures | Reported | 400.00 Mil | -20.0% | Lowered | Guidance: 500.00 Mil for 2026 | |||
Q2 2026 Earnings Reported 12/19/2025
| Forward Guidance | Guidance Change | |||||||
|---|---|---|---|---|---|---|---|---|
| Metric | Source | Low | Mid | High | % Chg | % Delta | Change | Prior |
| 2026 Net Sales | Reported | 6.35 Bil | 6.45 Bil | 6.55 Bil | 0 | Affirmed | Guidance: 6.45 Bil for 2026 | |
| 2026 Adjusted EBITDA | Reported | 1.00 Bil | 1.10 Bil | 1.20 Bil | 0 | Affirmed | Guidance: 1.10 Bil for 2026 | |
| 2026 Cash Used for Capital Expenditures | Reported | 500.00 Mil | 0 | Affirmed | Guidance: 500.00 Mil for 2026 | |||
Insider Activity
Updated 8/5/2026| # | Owner | Title | Holding | Action | Filing Date | Price | Shares | Transacted Value | Value of Held Shares | Form |
|---|---|---|---|---|---|---|---|---|---|---|
| 1 | Gray, James D | Chief Financial Officer | Direct | Buy | 5112026 | 40.92 | 10,000 | 409,225 | 2,853,976 | Form |
| 2 | Gray, James D | Chief Financial Officer | Direct | Buy | 4282026 | 43.85 | 4,556 | 199,781 | 2,619,643 | Form |
| 3 | Jana, Partners Management, LP | See footnote | Buy | 4152026 | 43.19 | 50,000 | 2,159,500 | 233,181,946 | Form | |
| 4 | Jana, Partners Management, LP | See footnote | Buy | 4152026 | 42.12 | 100,000 | 4,212,000 | 225,299,038 | Form | |
| 5 | Jana, Partners Management, LP | See footnote | Buy | 4092026 | 41.41 | 100,000 | 4,141,000 | 217,360,262 | Form |
| # | Owner | Title | Holding | Action | Filing Date | Price | Shares | Transacted Value | Value of Held Shares | Form |
|---|---|---|---|---|---|---|---|---|---|---|
| 1 | Gray, James D | Chief Financial Officer | Direct | Buy | 5112026 | 40.92 | 10,000 | 409,225 | 2,853,976 | Form |
| 2 | Gray, James D | Chief Financial Officer | Direct | Buy | 4282026 | 43.85 | 4,556 | 199,781 | 2,619,643 | Form |
| 3 | Jana, Partners Management, LP | See footnote | Buy | 4152026 | 43.19 | 50,000 | 2,159,500 | 233,181,946 | Form | |
| 4 | Jana, Partners Management, LP | See footnote | Buy | 4152026 | 42.12 | 100,000 | 4,212,000 | 225,299,038 | Form | |
| 5 | Jana, Partners Management, LP | See footnote | Buy | 4092026 | 41.41 | 100,000 | 4,141,000 | 217,360,262 | Form | |
| 6 | Jana, Partners Management, LP | See footnote | Buy | 4092026 | 40.89 | 136,000 | 5,561,040 | 210,541,792 | Form | |
| 7 | Bensen, Peter J | Revocable Trust | Buy | 4072026 | 39.45 | 5,000 | 197,225 | 678,612 | Form | |
| 8 | Craps, Jan Eli B | Executive Chair | Direct | Buy | 2062026 | 48.65 | 50,000 | 2,432,330 | 14,593,980 | Form |
| 9 | Jones, Gregory W | VP AND CONTROLLER | Direct | Sell | 10032025 | 62.48 | 1,600 | 99,973 | 592,028 | Form |
Investor Activity (13F)
Updated Oct 6, 2026Active managers (13F portfolio over $250M, at least 3 holdings) with a position over $5M that is either over 10% of their portfolio or held in a concentrated book of 50 or fewer total positions. Index/ETF, sovereign, bank, community-bank and charitable/donor-advised filers are excluded.
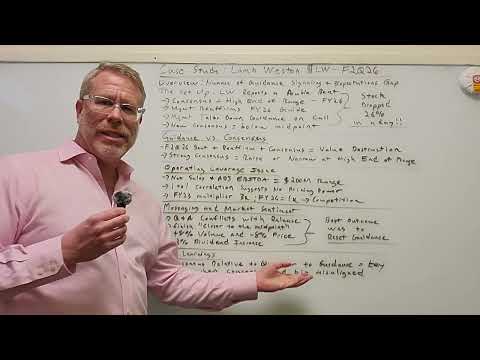
Lamb Weston — Investor Video Playlist


Industry Resources
| Consumer Staples Resources |
| FoodNavigator |
| Consumer Goods Technology (CGT) |
| Beverage Digest |
| Packaged Foods & Meats Resources |
| USDA Data |
| Food Processing |
| Meat+Poultry |
| Just Food |
External Quote Links
| Y Finance | Barrons |
| TradingView | Morningstar |
| SeekingAlpha | ValueLine |
| Motley Fool | Robinhood |
| CNBC | Etrade |
| MarketWatch | Unusual Whales |
| YCharts | Perplexity Finance |
| FinViz |
Prefer one of these to Trefis? Tell us why.