
NAPCO Security Technologies (NSSC)
Market Price (11/3/2026): $31.92 | Market Cap: $1.1 BilSector: Information Technology | Industry: Electronic Equipment & Instruments
NAPCO Security Technologies (NSSC)
Market Price (11/3/2026): $31.92Market Cap: $1.1 BilSector: Information TechnologyIndustry: Electronic Equipment & Instruments
Investment Highlights Why It Matters Detailed financial logic regarding cash flow yields vs trend-riding momentum.
Attractive operating marginsOp Mgn LTMOperating Margin = Operating Income / Revenue Reflects profitability before taxes and before impact of capital structure (interest payments). is 30% Attractive cash flow generationCFO/Rev LTMCash Flow from Operations / Revenue (Sales), Last Twelve Months (LTM) is 30%, FCF/Rev LTMFree Cash Flow / Revenue (Sales), Last Twelve Months (LTM) is 29% Low stock price volatilityVol 12M is 40% Megatrend and thematic driversMegatrends include Smart Buildings & Proptech, Cloud Computing, and Cybersecurity. Themes include IoT for Buildings, Show more. | Weak multi-year price returns2Y Excs Rtn is -28% | Key risksNSSC key risks include [1] an ongoing securities class action lawsuit and investigation stemming from financial misstatements and weak internal controls, Show more. |
| Attractive operating marginsOp Mgn LTMOperating Margin = Operating Income / Revenue Reflects profitability before taxes and before impact of capital structure (interest payments). is 30% |
| Attractive cash flow generationCFO/Rev LTMCash Flow from Operations / Revenue (Sales), Last Twelve Months (LTM) is 30%, FCF/Rev LTMFree Cash Flow / Revenue (Sales), Last Twelve Months (LTM) is 29% |
| Low stock price volatilityVol 12M is 40% |
| Megatrend and thematic driversMegatrends include Smart Buildings & Proptech, Cloud Computing, and Cybersecurity. Themes include IoT for Buildings, Show more. |
| Weak multi-year price returns2Y Excs Rtn is -28% |
| Key risksNSSC key risks include [1] an ongoing securities class action lawsuit and investigation stemming from financial misstatements and weak internal controls, Show more. |
Qualitative Assessment
AI Analysis | Feedback
NAPCO Security Technologies (NSSC) stock has lost about 15% since 7/31/2026 because of the following key factors:
1. Missed Fiscal Q1 2027 Earnings and Revenue Estimates.
NAPCO Security Technologies reported diluted earnings per share (EPS) of $0.36 for fiscal Q1 2027 (ended September 30, 2026), falling short of analyst consensus estimates ranging from $0.37 to $0.3783 per share. Additionally, net revenue of $50.0 million, while a record for a first quarter, missed Wall Street expectations of $52.07 million. This combined earnings and revenue miss led to a significant stock price decline of 17.3% on the day of the announcement.
2. Decline in Equipment Revenue.
In fiscal Q1 2027, equipment revenue experienced a year-over-year decrease of 7.3%, totaling $23.9 million. This contraction in hardware sales raised investor concerns regarding potential demand headwinds, particularly because equipment sales are a critical driver for future recurring service revenue. Management indicated that this decline was primarily due to the timing of purchases by two locking distributors rather than a fundamental weakening of end-customer demand.
Show more
NAPCO Security Technologies (NSSC) stock has lost about 15% since 7/31/2026 because of the following key factors:
1. Missed Fiscal Q1 2027 Earnings and Revenue Estimates.
NAPCO Security Technologies reported diluted earnings per share (EPS) of $0.36 for fiscal Q1 2027 (ended September 30, 2026), falling short of analyst consensus estimates ranging from $0.37 to $0.3783 per share. Additionally, net revenue of $50.0 million, while a record for a first quarter, missed Wall Street expectations of $52.07 million. This combined earnings and revenue miss led to a significant stock price decline of 17.3% on the day of the announcement.
2. Decline in Equipment Revenue.
In fiscal Q1 2027, equipment revenue experienced a year-over-year decrease of 7.3%, totaling $23.9 million. This contraction in hardware sales raised investor concerns regarding potential demand headwinds, particularly because equipment sales are a critical driver for future recurring service revenue. Management indicated that this decline was primarily due to the timing of purchases by two locking distributors rather than a fundamental weakening of end-customer demand.
3. Significant Decrease in Free Cash Flow.
NAPCO's free cash flow in fiscal Q1 2027 dramatically decreased by 79.8% to $2.3 million. This substantial reduction was largely a result of a one-time payment of a $15 million litigation settlement during the quarter. While the company maintains a robust balance sheet with $134.6 million in cash and no debt, this significant cash outflow impacted the quarterly cash generation and likely contributed to investor apprehension.
4. Lower Equipment Gross Margins.
The equipment gross margin for fiscal Q1 2027 declined to 24.3%, down from 26% in the comparable prior-year period. This decrease was attributed to a less favorable product mix within the locking segment, higher Section 301 tariff costs, and increased technical-services costs. Although management anticipates full-year equipment margins to recover to the 26%-27% range, the immediate quarterly margin pressure added to investor concerns.
Show less
Stock Movement Drivers
Fundamental Drivers
The -13.0% change in NSSC stock from 7/31/2026 to 11/2/2026 was primarily driven by a -25.4% change in the company's P/E Multiple.| (LTM values as of) | 7312026 | 11022026 | Change |
|---|---|---|---|
| Stock Price ($) | 36.90 | 32.10 | -13.0% |
| Change Contribution By: | |||
| Total Revenues ($ Mil) | 197 | 202 | 2.6% |
| Net Income Margin (%) | 18.7% | 21.3% | 13.7% |
| P/E Multiple | 35.7 | 26.6 | -25.4% |
| Shares Outstanding (Mil) | 36 | 36 | 0.0% |
| Cumulative Contribution | -13.0% |
Market Drivers
7/31/2026 to 11/2/2026| Return | Correlation | |
|---|---|---|
| NSSC | -13.0% | |
| Market (SPY) | 0.7% | 32.0% |
| Sector (XLK) | -0.6% | 38.1% |
Fundamental Drivers
The -30.7% change in NSSC stock from 4/30/2026 to 11/2/2026 was primarily driven by a -23.6% change in the company's P/E Multiple.| (LTM values as of) | 4302026 | 11022026 | Change |
|---|---|---|---|
| Stock Price ($) | 46.33 | 32.10 | -30.7% |
| Change Contribution By: | |||
| Total Revenues ($ Mil) | 192 | 202 | 5.4% |
| Net Income Margin (%) | 24.7% | 21.3% | -13.9% |
| P/E Multiple | 34.8 | 26.6 | -23.6% |
| Shares Outstanding (Mil) | 36 | 36 | -0.1% |
| Cumulative Contribution | -30.7% |
Market Drivers
4/30/2026 to 11/2/2026| Return | Correlation | |
|---|---|---|
| NSSC | -30.7% | |
| Market (SPY) | 4.9% | 30.4% |
| Sector (XLK) | 9.4% | 25.8% |
Fundamental Drivers
The -26.1% change in NSSC stock from 10/31/2025 to 11/2/2026 was primarily driven by a -25.4% change in the company's P/E Multiple.| (LTM values as of) | 10312025 | 11022026 | Change |
|---|---|---|---|
| Stock Price ($) | 43.46 | 32.10 | -26.1% |
| Change Contribution By: | |||
| Total Revenues ($ Mil) | 182 | 202 | 11.4% |
| Net Income Margin (%) | 23.9% | 21.3% | -11.0% |
| P/E Multiple | 35.7 | 26.6 | -25.4% |
| Shares Outstanding (Mil) | 36 | 36 | -0.1% |
| Cumulative Contribution | -26.1% |
Market Drivers
10/31/2025 to 11/2/2026| Return | Correlation | |
|---|---|---|
| NSSC | -26.1% | |
| Market (SPY) | 11.2% | 35.7% |
| Sector (XLK) | 16.3% | 29.6% |
Fundamental Drivers
The 82.4% change in NSSC stock from 10/31/2023 to 11/2/2026 was primarily driven by a 33.3% change in the company's Net Income Margin (%).| (LTM values as of) | 10312023 | 11022026 | Change |
|---|---|---|---|
| Stock Price ($) | 17.60 | 32.10 | 82.4% |
| Change Contribution By: | |||
| Total Revenues ($ Mil) | 170 | 202 | 19.0% |
| Net Income Margin (%) | 16.0% | 21.3% | 33.3% |
| P/E Multiple | 23.9 | 26.6 | 11.6% |
| Shares Outstanding (Mil) | 37 | 36 | 3.0% |
| Cumulative Contribution | 82.4% |
Market Drivers
10/31/2023 to 11/2/2026| Return | Correlation | |
|---|---|---|
| NSSC | 82.4% | |
| Market (SPY) | 86.0% | 40.3% |
| Sector (XLK) | 116.2% | 37.9% |
Price Returns Compared
| 2021 | 2022 | 2023 | 2024 | 2025 | 2026 | Total [1] | |
|---|---|---|---|---|---|---|---|
| Returns | |||||||
| NSSC Return | 91% | 10% | 26% | 5% | 19% | -22% | 157% |
| Peers Return | 6% | -18% | 13% | 5% | 16% | 10% | 30% |
| S&P 500 Return | 27% | -19% | 24% | 23% | 16% | 10% | 101% |
Monthly Win Rates [3] | |||||||
| NSSC Win Rate | 58% | 50% | 58% | 58% | 67% | 36% | |
| Peers Win Rate | 52% | 40% | 47% | 43% | 53% | 51% | |
| S&P 500 Win Rate | 75% | 42% | 67% | 75% | 67% | 36% | |
Max Drawdowns [4] | |||||||
| NSSC Max Drawdown | -14% | -37% | -54% | -41% | -46% | -31% | |
| Peers Max Drawdown | -25% | -35% | -28% | -20% | -22% | -31% | |
| S&P 500 Max Drawdown | -5% | -25% | -10% | -8% | -19% | -9% | |
[1] Cumulative total returns since the beginning of 2021
[2] Peers: ALLE, ALRM, ADT, REZI, MSA. See NSSC Returns vs. Peers.
[3] Win Rate = % of calendar months in which monthly returns were positive
[4] Max drawdown represents maximum peak-to-trough decline within a year
[5] 2026 data is for the year up to 11/2/2026 (YTD)
How Low Can It Go
| Event | NSSC | S&P 500 |
|---|---|---|
| 2025 US Tariff Shock | ||
| % Loss | -22.7% | -18.8% |
| % Gain to Breakeven | 29.3% | 23.1% |
| Time to Breakeven | 30 days | 79 days |
| Summer-Fall 2023 Five Percent Yield Shock | ||
| % Loss | -49.4% | -9.5% |
| % Gain to Breakeven | 97.5% | 10.5% |
| Time to Breakeven | 97 days | 24 days |
| 2023 SVB Regional Banking Crisis | ||
| % Loss | -19.9% | -6.7% |
| % Gain to Breakeven | 24.8% | 7.1% |
| Time to Breakeven | 4 days | 31 days |
| 2022 Inflation Shock & Fed Tightening | ||
| % Loss | -35.3% | -24.5% |
| % Gain to Breakeven | 54.7% | 32.4% |
| Time to Breakeven | 69 days | 427 days |
| 2020 COVID-19 Crash | ||
| % Loss | -38.2% | -33.7% |
| % Gain to Breakeven | 61.8% | 50.9% |
| Time to Breakeven | 31 days | 140 days |
| Q4 2018 Fed Policy Error / Growth Scare | ||
| % Loss | -11.1% | -19.2% |
| % Gain to Breakeven | 12.5% | 23.8% |
| Time to Breakeven | 21 days | 105 days |
In The Past
NAPCO Security Technologies's stock fell -22.7% during the 2025 US Tariff Shock. Such a loss loss requires a 29.3% gain to breakeven.
Preserve Wealth
Limiting losses and compounding gains is essential to preserving wealth.
Asset Allocation
Actively managed asset allocation strategies protect wealth. Learn more.
| Event | NSSC | S&P 500 |
|---|---|---|
| 2025 US Tariff Shock | ||
| % Loss | -22.7% | -18.8% |
| % Gain to Breakeven | 29.3% | 23.1% |
| Time to Breakeven | 30 days | 79 days |
| Summer-Fall 2023 Five Percent Yield Shock | ||
| % Loss | -49.4% | -9.5% |
| % Gain to Breakeven | 97.5% | 10.5% |
| Time to Breakeven | 97 days | 24 days |
| 2022 Inflation Shock & Fed Tightening | ||
| % Loss | -35.3% | -24.5% |
| % Gain to Breakeven | 54.7% | 32.4% |
| Time to Breakeven | 69 days | 427 days |
| 2020 COVID-19 Crash | ||
| % Loss | -38.2% | -33.7% |
| % Gain to Breakeven | 61.8% | 50.9% |
| Time to Breakeven | 31 days | 140 days |
| 2011 US Debt Ceiling Crisis & European Contagion | ||
| % Loss | -22.9% | -17.9% |
| % Gain to Breakeven | 29.7% | 21.8% |
| Time to Breakeven | 87 days | 123 days |
| 2010 Eurozone Sovereign Debt Crisis / Flash Crash | ||
| % Loss | -32.5% | -15.4% |
| % Gain to Breakeven | 48.2% | 18.2% |
| Time to Breakeven | 324 days | 125 days |
| 2008-2009 Global Financial Crisis | ||
| % Loss | -87.0% | -53.4% |
| % Gain to Breakeven | 667.7% | 114.4% |
| Time to Breakeven | 1723 days | 1085 days |
In The Past
NAPCO Security Technologies's stock fell -22.7% during the 2025 US Tariff Shock. Such a loss loss requires a 29.3% gain to breakeven.
Preserve Wealth
Limiting losses and compounding gains is essential to preserving wealth.
Asset Allocation
Actively managed asset allocation strategies protect wealth. Learn more.
About NAPCO Security Technologies (NSSC)
Napco Security Technologies, Inc. (NSSC) is a developer, manufacturer, and seller of electronic security products, providing comprehensive security solutions tailored for a wide range of applications. The company focuses on enhancing safety and control through advanced technology for various environments.
NSSC's product portfolio is diverse, encompassing four core categories: access control systems, sophisticated door-locking products, intrusion and fire alarm systems, and video surveillance systems. Access control solutions include identification readers, control panels, and electronic door locks, some with biometric capabilities. Its alarm systems feature automatic communicators, cellular devices, and fire alarm control panels, while video surveillance includes cameras and monitoring systems. The company also resells complementary security equipment from other manufacturers and offers specialized school security products.
Napco Security Technologies serves a broad spectrum of markets, including commercial, residential, institutional, industrial, and governmental sectors. Its products are primarily distributed and installed by independent distributors, dealers, and installers of security equipment, making NSSC a key supplier in the professional security installation industry.
AI Analysis | Feedback
Here are 1-3 brief analogies to describe NAPCO Security Technologies (NSSC):
- Like a focused "Honeywell for electronic security systems."
- Essentially, a pure-play version of Bosch Security Systems.
AI Analysis | Feedback
- Access Control Systems: Comprehensive solutions including identification readers, control panels, and electronic door-locking devices.
- Door-Locking Products: A range of locks from microprocessor-based electronic door locks with biometric or card reader operation to mechanical deadbolts and door alarms.
- Intrusion and Fire Alarm Systems: Systems featuring control panels, digital communicators, cellular communication devices, and area detectors for detecting unauthorized entry or fire.
- Video Surveillance Systems: Comprised of video cameras, control panels, monitors, and associated equipment for visual security monitoring.
- School Security Products: Specialized security solutions designed to enhance safety and security within educational environments.
- Resold Security Equipment: Various identification readers, video cameras, and peripheral equipment manufactured by other companies, which NAPCO buys and resells.
AI Analysis | Feedback
NAPCO Security Technologies (NSSC) sells its products primarily to other businesses rather than directly to individuals. Based on the provided company description, its major customers fall into the following categories:
- Independent distributors of security equipment
- Dealers of security equipment
- Installers of security equipment
The company's description does not list the specific names of these customer companies or their public symbols.
AI Analysis | Feedback
AI Analysis | Feedback
Richard L. Soloway, Chairman of the Board, Chief Executive Officer and Secretary
Richard L. Soloway founded NAPCO Security Technologies, Inc. in 1972 as a public company. He has over 30 years of experience in the international security industry and holds numerous electronic design and manufacturing patents in the security industry. Soloway began his career designing and manufacturing electronic sound and light equipment for rock bands in the late 1960s. He has received awards such as 'Champion for Safety Through Education' and 'Entrepreneur of the Year'.
Andrew J. Vuono, Senior Vice President, Finance, Chief Financial Officer and Chief Accounting Officer
Andrew J. Vuono has over 30 years of public accounting experience, including more than 20 years as a partner at a top 10 Public Accounting Firm.
Kevin S. Buchel, President, Chief Operating Officer and Treasurer
Kevin S. Buchel has been with NAPCO Security Technologies since 1995, holding various finance and operations roles, including Chief Financial Officer from April 1995 to May 2025. He was promoted to President & Chief Operating Officer in May 2024.
Michael Carrieri, Executive Vice President, Engineering and Chief Technology Officer
Michael Carrieri was promoted to Executive Vice President of Engineering & Chief Technology Officer in May 2024, after serving as Senior Vice President of Engineering Development for 24 years.
Judy Jones, Vice President of Marketing
Judy Jones has served as Vice President of Marketing at NAPCO Security Technologies, Inc. since April 1988. Before this role, she was Marketing Manager at Temtron Electronics/OEM CCTV from January 1986 to April 1988. She holds an MBA in Business Administration and Management from Dowling College and a Bachelor's degree from Stony Brook University.
AI Analysis | Feedback
Key Risks to NAPCO Security Technologies (NSSC)
- Intense Competition and Market Consolidation: NAPCO Security Technologies operates in a highly competitive market for electronic security products, characterized by the presence of larger global players such as Johnson Controls, Honeywell, and Bosch Security Systems. These larger competitors possess significant research and development (R&D) capabilities, potentially allowing them to out-innovate smaller firms. Additionally, the increasing availability and adoption of cost-effective, do-it-yourself (DIY) security solutions from brands like Ring and SimpliSafe are disrupting the residential market, creating price pressures and making customer acquisition more challenging for traditional security equipment dealers and installers, who are NAPCO's primary customers.
- Product Concentration Risk and Sales Volatility: A significant portion of NAPCO's high-margin recurring service revenue is heavily dependent on its StarLink cellular communicators. This concentration creates a risk that a shift in technology or market adoption could negatively impact performance if demand for StarLink products declines. Furthermore, NAPCO has experienced sales volatility, with equipment sales being negatively impacted by key distributors actively reducing their inventory levels. This destocking by distributors has led to a significant drop in equipment sales in recent fiscal periods.
- Tariff and Supply Chain Disruptions: The company faces risks related to tariffs, with management having cited the anticipation of a new 10% universal baseline tariff on imports as a challenge that could impact product margins and supply chain operations. These tariff pressures and increased costs have already weighed on margins. As a manufacturer reliant on various components and global sourcing for its electronic security products, NAPCO is susceptible to broader supply chain disruptions, which can lead to increased operational costs and potential delays in product availability.
AI Analysis | Feedback
The clear emerging threat for NAPCO Security Technologies is the proliferation of consumer-friendly, do-it-yourself (DIY), app-controlled security systems and integrated smart home platforms. These solutions, often sold direct-to-consumer or through mass retail channels, offer easier installation and management, often with subscription-based monitoring, bypassing the traditional independent distributors, dealers, and installers that NAPCO primarily serves. This trend directly threatens NAPCO's market share, particularly in the residential and small commercial segments, by offering alternative products that disrupt the established distribution and service model.
AI Analysis | Feedback
NAPCO Security Technologies operates in several significant addressable markets for its electronic security products. The company's main product categories, including access control systems, door-locking products, intrusion and fire alarm systems, video surveillance systems, and school security products, each represent multi-billion dollar opportunities.
Here are the addressable market sizes for NAPCO Security Technologies' main products and services:
- Access Control Systems: The global electronic access control systems market was valued at approximately USD 53.92 billion in 2025 and is projected to reach USD 143.71 billion by 2035. The U.S. electronic access control systems market is projected to grow from USD 17.25 billion in 2025 to USD 45.99 billion by 2035. North America held over 38% of the global market share in 2025.
- Door-Locking Products: The global door locks market was recorded at USD 10.634 billion by the end of 2025 and is expected to reach USD 16.6129 billion by 2033. The global smart door lock market was valued at USD 7.4 billion in 2024 and is projected to grow to USD 33.1 billion by 2032. The global digital door lock systems market was valued at USD 2.7 billion in 2024 and is poised to grow to USD 10.43 billion by 2033. North America's smart door lock market held a dominant position with a market size of USD 1.51 billion in 2025.
- Intrusion Alarm Systems: The global intruder alarm system market size was USD 2.68 billion in 2025 and is expected to reach USD 4.1 billion by 2030. The global intrusion alarm system market is expected to reach USD 4.4 billion by 2035, up from USD 2.5 billion in 2024. North America is the largest market for intruder alarm systems, holding approximately 40% of the global market share.
- Fire Alarm Systems: The global fire alarm system market was valued at USD 38.19 billion in 2024 and is predicted to reach USD 82.63 billion by 2034. The global fire alarm and detection market size was valued at USD 49.60 billion in 2024 and is projected to grow to USD 71.21 billion by 2033. North America dominated the global fire alarm and detection market in 2024.
- Video Surveillance Systems: The global video surveillance market generated a revenue of USD 73.75 billion in 2024 and is expected to reach USD 147.66 billion by 2030. North America accounted for 32.1% of the global video surveillance market in 2024.
- School Security Products: The global school and campus security market size reached USD 3.0 billion in 2024 and is expected to reach USD 9.2 billion by 2033. Another estimate indicates the global market size was USD 5.09 billion in 2026 and is projected to reach USD 27.38 billion by 2035. North America is analyzed to hold a significant share in the education security market.
AI Analysis | Feedback
NAPCO Security Technologies (NSSC) is expected to drive future revenue growth over the next 2-3 years through several key initiatives and market trends:
- Expansion of High-Margin Recurring Revenue: A primary driver for NAPCO is the continued growth in its high-margin recurring monthly revenue (RMR), largely fueled by the strong adoption and deployment of its StarLink cellular communicators. This growth is significantly bolstered by regulatory tailwinds, particularly the ongoing "copper sunset" which mandates the transition from older copper lines to cellular communication for alarm systems. The company's new MVP cloud-based access control platform is also anticipated to become a significant contributor to recurring revenue as its adoption scales.
- New Product Development and Innovation: NAPCO is consistently investing in research and development and launching new products and services. Beyond the MVP platform, the company's focus on innovation, including expanded 5G multi-carrier communicators and enhancements to cloud access platforms, aims to accelerate dealer adoption and introduce new revenue streams, many with recurring service components.
- Strategic Pricing Actions and Operational Efficiency: The company has implemented strategic price increases to offset costs, such as tariffs, and improve overall margins. Coupled with ongoing operational efficiencies and a favorable product mix, these actions are contributing to both revenue growth and enhanced profitability.
- Persistent Demand in the Global Security Market: The overall global electronic security products and services market continues to expand, driven by factors such as crime prevention, mass surveillance, and increasing regulatory compliance requirements. Specific segments, like school security, also demonstrate steady demand. This broad market growth provides a foundational tailwind for NAPCO's diverse product portfolio.
AI Analysis | Feedback
Share Repurchases
- NAPCO Security Technologies authorized a new stock repurchase program for up to 500,000 shares in December 2018.
- As of March 2020, approximately 435,000 shares remained available for repurchase under the 2018 program.
- The company announced a new share repurchase program to buy back up to 1,000,000 shares on November 4, 2024.
- During fiscal 2025, NAPCO repurchased $36.8 million in common stock.
Share Issuance
- The number of shares outstanding for NSSC decreased by 3.03% in one year.
Capital Expenditures
- In the last 12 months, capital expenditures for NAPCO Security Technologies were -$1.08 million.
- This contributed to a free cash flow of $53.66 million over the same period, with operating cash flow at $54.74 million.
Peer Outperformance in Electronic Equipment & Instruments
| Ticker | Name | Rev Growth 3Y Avg | P/E | 1Y | 3Y | 5Y | 5Y Gap |
|---|---|---|---|---|---|---|---|
| NSSC | NAPCO Security Technologies | 6.2% | 26.6x | -26.1% | 78.2% | 43.4% | — |
| PI | Impinj | 7.4% | -599.5x | -8.0% | 170.8% | 138.8% | +95pp |
| CXT | Crane NXT | 10.2% | 24.8x | -2.7% | 16.1% | 66.7% | +23pp |
| Industry | Names | 1Y med | 3Y med | 5Y med | Top 3 by 5Y |
|---|---|---|---|---|---|
| Electronic Manufacturing Services | 10 | 18.4% | 110.0% | 198.4% | FLEX 551% · TTMI 451% · JBL 333% |
| Technology Distributors | 9 | 43.9% | 68.0% | 73.2% | AVT 146% · SNX 117% · CNXN 94% |
| Semiconductor Materials & Equipment | 28 | 37.3% | 61.0% | 45.7% | AXTI 464% · LRCX 317% · KLAC 313% |
| Electronic Components | 26 | -0.6% | 66.1% | 34.6% | CLS 2294% · BELFA 1195% · APH 329% |
| Communications Equipment | 36 | 2.5% | 73.5% | 32.6% | AAOI 695% · LITE 689% · ANET 434% |
| Semiconductors | 55 | 0.0% | 44.4% | 7.7% | MU 1107% · NVDA 669% · AVGO 555% |
| Electronic Equipment & Instruments ← | 27 | -4.1% | 24.7% | 3.5% | PI 139% · OSIS 114% · MIR 70% |
| Internet Services & Infrastructure | 6 | 1.5% | 45.7% | -10.1% | GDDY 73% · VRSN 39% · DOCN -3% |
| Technology Hardware, Storage & Peripherals | 21 | -3.4% | 85.5% | -12.0% | WDC 727% · SMCI 721% · DELL 693% |
| IT Consulting & Other Services | 30 | -24.8% | -3.5% | -25.0% | APLD 269% · IBM 152% · ADEA 142% |
| Application Software | 125 | -15.8% | -9.8% | -54.8% | PLTR 588% · FROG 159% · AGYS 148% |
| Systems Software | 70 | -12.3% | 22.2% | -56.2% | CRWD 261% · ZETA 243% · CVLT 145% |
Latest Trefis Analyses
Research & Analysis
Invest in Strategies
Wealth Management
Peer Comparisons
| Peers to compare with: |
Financials
| Median | |
|---|---|
| Name | |
| Mkt Price | 49.19 |
| Mkt Cap | 5.2 |
| Rev LTM | 3,169 |
| Op Inc LTM | 533 |
| FCF LTM | 270 |
| FCF 3Y Avg | 243 |
| CFO LTM | 302 |
| CFO 3Y Avg | 278 |
Growth & Margins
| Median | |
|---|---|
| Name | |
| Rev Chg LTM | 7.6% |
| Rev Chg 3Y Avg | 6.7% |
| Rev Chg Q | 7.7% |
| QoQ Delta Rev Chg LTM | 1.9% |
| Op Inc Chg LTM | 9.2% |
| Op Inc Chg 3Y Avg | 9.1% |
| Op Mgn LTM | 21.7% |
| Op Mgn 3Y Avg | 21.3% |
| QoQ Delta Op Mgn LTM | 0.3% |
| CFO/Rev LTM | 20.0% |
| CFO/Rev 3Y Avg | 19.4% |
| FCF/Rev LTM | 17.9% |
| FCF/Rev 3Y Avg | 17.2% |
Valuation
| Median | |
|---|---|
| Name | |
| Mkt Cap | 5.2 |
| P/S | 3.4 |
| P/Op Inc | 16.9 |
| P/EBIT | 16.6 |
| P/E | 23.0 |
| P/CFO | 16.9 |
| Total Yield | 5.5% |
| Dividend Yield | 1.1% |
| FCF Yield 3Y Avg | 4.7% |
| D/E | 0.1 |
| Net D/E | 0.1 |
Returns
| Median | |
|---|---|
| Name | |
| 1M Rtn | 13.1% |
| 3M Rtn | 7.2% |
| 6M Rtn | 25.7% |
| 12M Rtn | 16.2% |
| 3Y Rtn | 51.2% |
| 1M Excs Rtn | 15.4% |
| 3M Excs Rtn | 8.3% |
| 6M Excs Rtn | 21.0% |
| 12M Excs Rtn | 6.4% |
| 3Y Excs Rtn | -30.1% |
Comparison Analyses
Price Behavior
| Market Price | $32.10 | |
| Market Cap ($ Bil) | 1.1 | |
| First Trading Date | 03/26/1990 | |
| Distance from 52W High | -31.2% | |
| 50 Days | 200 Days | |
| DMA Price | $36.35 | $38.84 |
| DMA Trend | down | down |
| Distance from DMA | -11.7% | -17.3% |
| 3M | 1YR | |
| Volatility | 45.3% | 44.3% |
| Downside Capture | 213.62 | 180.54 |
| Upside Capture | 102.00 | 123.83 |
| Correlation (S&P 500) | 24.3% | 36.5% |
| 1M | 2M | 3M | 6M | 1Y | 3Y | |
|---|---|---|---|---|---|---|
| Beta | 1.00 | 0.98 | 1.08 | 1.02 | 1.18 | 1.24 |
| Up Beta | -1.66 | -1.10 | 1.89 | 1.02 | 0.99 | 1.04 |
| Down Beta | 0.09 | 0.54 | 0.46 | 0.39 | 0.88 | 0.87 |
| Up Capture | 265% | 188% | 118% | 96% | 132% | 493% |
| Bmk +ve Days | 12 | 18 | 28 | 62 | 130 | 427 |
| Stock +ve Days | 14 | 25 | 34 | 59 | 121 | 394 |
| Down Capture | 74% | 92% | 87% | 142% | 129% | 110% |
| Bmk -ve Days | 10 | 25 | 36 | 64 | 121 | 325 |
| Stock -ve Days | 8 | 18 | 30 | 64 | 126 | 350 |
[1] Upside and downside betas calculated using positive and negative benchmark daily returns respectively
Based On 1-Year Data
| Annualized Return | Annualized Volatility | Sharpe Ratio | Correlation with NSSC | |
|---|---|---|---|---|
| NSSC | -25.6% | 44.3% | -0.54 | - |
| Sector ETF (XLK) | 16.5% | 27.2% | 0.53 | 29.6% |
| Equity (SPY) | 11.6% | 12.8% | 0.57 | 35.8% |
| Gold (GLD) | -2.3% | 28.6% | -0.09 | 16.9% |
| Commodities (DBC) | 43.1% | 20.9% | 1.60 | -15.0% |
| Real Estate (VNQ) | 11.0% | 13.7% | 0.50 | 16.7% |
| Bitcoin (BTCUSD) | -28.8% | 43.6% | -0.66 | 12.9% |
Smart multi-asset allocation framework can stack odds in your favor. Learn How
Based On 5-Year Data
| Annualized Return | Annualized Volatility | Sharpe Ratio | Correlation with NSSC | |
|---|---|---|---|---|
| NSSC | 7.7% | 51.1% | 0.35 | - |
| Sector ETF (XLK) | 17.9% | 26.1% | 0.61 | 35.3% |
| Equity (SPY) | 12.0% | 17.1% | 0.52 | 37.3% |
| Gold (GLD) | 16.5% | 19.0% | 0.69 | 4.3% |
| Commodities (DBC) | 8.4% | 19.6% | 0.31 | 2.5% |
| Real Estate (VNQ) | 1.1% | 18.9% | -0.05 | 23.7% |
| Bitcoin (BTCUSD) | 4.1% | 51.6% | 0.26 | 16.3% |
Smart multi-asset allocation framework can stack odds in your favor. Learn How
Based On 10-Year Data
| Annualized Return | Annualized Volatility | Sharpe Ratio | Correlation with NSSC | |
|---|---|---|---|---|
| NSSC | 25.0% | 50.0% | 0.65 | - |
| Sector ETF (XLK) | 23.3% | 25.2% | 0.84 | 33.9% |
| Equity (SPY) | 15.2% | 17.9% | 0.72 | 35.9% |
| Gold (GLD) | 11.6% | 16.5% | 0.57 | 3.2% |
| Commodities (DBC) | 7.8% | 18.1% | 0.34 | 8.5% |
| Real Estate (VNQ) | 5.4% | 20.7% | 0.22 | 26.5% |
| Bitcoin (BTCUSD) | 61.7% | 66.3% | 1.01 | 10.4% |
Smart multi-asset allocation framework can stack odds in your favor. Learn How
Returns Analyses
Earnings Returns History
Updated 11/2/2026| Forward Returns | |||
|---|---|---|---|
| Earnings Date | 1D Returns | 5D Returns | 21D Returns |
| 8/24/2026 | -1.3% | -7.2% | -5.3% |
| 5/4/2026 | 5.6% | 1.5% | -9.1% |
| 2/2/2026 | 6.6% | 4.9% | 6.2% |
| 11/3/2025 | 1.4% | 3.9% | 0.4% |
| 8/25/2025 | 11.2% | 14.4% | 29.5% |
| 5/5/2025 | 0.3% | 11.2% | 15.9% |
| 2/3/2025 | -1.9% | -3.3% | -9.6% |
| 11/4/2024 | 4.1% | 12.3% | 18.2% |
| ... | |||
| SUMMARY STATS | |||
| # Positive | 16 | 15 | 15 |
| # Negative | 7 | 8 | 8 |
| Median Positive | 2.6% | 4.3% | 12.9% |
| Median Negative | -2.1% | -2.4% | -8.2% |
| Max Positive | 11.2% | 14.4% | 39.8% |
| Max Negative | -6.0% | -8.5% | -12.2% |
| Forward Returns | |||
|---|---|---|---|
| Earnings Date | 1D Returns | 5D Returns | 21D Returns |
| 8/24/2026 | -1.3% | -7.2% | -5.3% |
| 5/4/2026 | 5.6% | 1.5% | -9.1% |
| 2/2/2026 | 6.6% | 4.9% | 6.2% |
| 11/3/2025 | 1.4% | 3.9% | 0.4% |
| 8/25/2025 | 11.2% | 14.4% | 29.5% |
| 5/5/2025 | 0.3% | 11.2% | 15.9% |
| 2/3/2025 | -1.9% | -3.3% | -9.6% |
| 11/4/2024 | 4.1% | 12.3% | 18.2% |
| 8/26/2024 | -2.1% | -8.5% | -12.2% |
| 5/6/2024 | 1.0% | -1.9% | 14.6% |
| 2/5/2024 | 2.1% | 8.4% | -3.1% |
| 11/6/2023 | 9.5% | 14.3% | 39.8% |
| 8/29/2023 | 1.2% | -1.6% | -8.4% |
| 5/8/2023 | -2.2% | 2.2% | 12.8% |
| 2/6/2023 | 3.5% | -2.8% | -1.5% |
| 11/7/2022 | -4.6% | -1.4% | -8.1% |
| 8/29/2022 | 4.0% | 1.8% | 4.9% |
| 5/9/2022 | -1.2% | 3.5% | 23.2% |
| 2/7/2022 | 2.3% | 1.0% | 5.2% |
| 11/8/2021 | -6.0% | -1.0% | 2.4% |
| 9/15/2021 | 2.4% | 6.3% | 9.6% |
| 2/10/2021 | 2.6% | 2.4% | 12.9% |
| 11/5/2020 | 2.5% | 4.3% | 13.5% |
| SUMMARY STATS | |||
| # Positive | 16 | 15 | 15 |
| # Negative | 7 | 8 | 8 |
| Median Positive | 2.6% | 4.3% | 12.9% |
| Median Negative | -2.1% | -2.4% | -8.2% |
| Max Positive | 11.2% | 14.4% | 39.8% |
| Max Negative | -6.0% | -8.5% | -12.2% |
SEC Filings
Expand for More| Report Date | Filing Date | Filing |
|---|---|---|
| 06/30/2026 | 08/24/2026 | 10-K |
| 03/31/2026 | 05/05/2026 | 10-Q |
| 12/31/2025 | 02/02/2026 | 10-Q |
| 09/30/2025 | 11/03/2025 | 10-Q |
| 06/30/2025 | 08/25/2025 | 10-K |
| 03/31/2025 | 05/05/2025 | 10-Q |
| 12/31/2024 | 02/03/2025 | 10-Q |
| 09/30/2024 | 11/04/2024 | 10-Q |
| 06/30/2024 | 08/29/2024 | 10-K |
| 03/31/2024 | 05/06/2024 | 10-Q |
| 12/31/2023 | 02/05/2024 | 10-Q |
| 09/30/2023 | 11/09/2023 | 10-Q |
| 06/30/2023 | 09/08/2023 | 10-K |
| 03/31/2023 | 05/08/2023 | 10-Q |
| 12/31/2022 | 02/06/2023 | 10-Q |
| 09/30/2022 | 11/07/2022 | 10-Q |
| Report Date | Filing Date | Filing |
|---|---|---|
| 06/30/2026 | 08/24/2026 | 10-K |
| 03/31/2026 | 05/05/2026 | 10-Q |
| 12/31/2025 | 02/02/2026 | 10-Q |
| 09/30/2025 | 11/03/2025 | 10-Q |
| 06/30/2025 | 08/25/2025 | 10-K |
| 03/31/2025 | 05/05/2025 | 10-Q |
| 12/31/2024 | 02/03/2025 | 10-Q |
| 09/30/2024 | 11/04/2024 | 10-Q |
| 06/30/2024 | 08/29/2024 | 10-K |
| 03/31/2024 | 05/06/2024 | 10-Q |
| 12/31/2023 | 02/05/2024 | 10-Q |
| 09/30/2023 | 11/09/2023 | 10-Q |
| 06/30/2023 | 09/08/2023 | 10-K |
| 03/31/2023 | 05/08/2023 | 10-Q |
| 12/31/2022 | 02/06/2023 | 10-Q |
| 09/30/2022 | 11/07/2022 | 10-Q |
| 06/30/2022 | 08/29/2022 | 10-K |
| 03/31/2022 | 05/17/2022 | 10-Q |
| 12/31/2021 | 02/09/2022 | 10-Q |
| 09/30/2021 | 11/08/2021 | 10-Q |
| 06/30/2021 | 09/13/2021 | 10-K |
| 03/31/2021 | 05/10/2021 | 10-Q |
| 12/31/2020 | 02/09/2021 | 10-Q |
| 09/30/2020 | 11/05/2020 | 10-Q |
| 06/30/2020 | 09/15/2020 | 10-K |
| 03/31/2020 | 05/07/2020 | 10-Q |
| 12/31/2019 | 02/03/2020 | 10-Q |
| 09/30/2019 | 11/08/2019 | 10-Q |
Recent Forward Guidance
Updated 11/2/2026Latest: Q1 2027 Earnings Reported 11/2/2026
| Forward Guidance | Guidance Change | |||||||
|---|---|---|---|---|---|---|---|---|
| Metric | Source | Low | Mid | High | % Chg | % Delta | Change | Prior |
| Q2 2027 Quarterly Dividend | Reported | 0.17 | ||||||
| 2027 RSR Prospective Annual Run Rate | Reported | 106.00 Mil | 2.9% | Raised | Guidance: 103.00 Mil for 2027 | |||
Prior: Q4 2026 Earnings Reported 8/24/2026
| Forward Guidance | Guidance Change | |||||||
|---|---|---|---|---|---|---|---|---|
| Metric | Source | Low | Mid | High | % Chg | % Delta | Change | Prior |
| 2027 Recurring Service Revenue Annual Run Rate | Reported | 103.00 Mil | 2.0% | Higher New | Actual: 101.00 Mil for 2026 | |||
Q3 2026 Earnings Reported 5/4/2026
| Forward Guidance | Guidance Change | |||||||
|---|---|---|---|---|---|---|---|---|
| Metric | Source | Low | Mid | High | % Chg | % Delta | Change | Prior |
| Q3 2026 Dividends | Reported | 0.15 | 0.0% | Affirmed | Guidance: 0.15 for Q3 2026 | |||
| 2026 Recurring Service Revenue Annual Run Rate | Reported | 101.00 Mil | ||||||
Q2 2026 Earnings Reported 2/2/2026
| Forward Guidance | Guidance Change | |||||||
|---|---|---|---|---|---|---|---|---|
| Metric | Source | Low | Mid | High | % Chg | % Delta | Change | Prior |
| Q3 2026 Dividends | Reported | 0.15 | 7.0% | 1.0% | Raised | |||
Insider Activity
Updated 10/1/2026| # | Owner | Title | Holding | Action | Filing Date | Price | Shares | Transacted Value | Value of Held Shares | Form |
|---|---|---|---|---|---|---|---|---|---|---|
| 1 | Soloway, Donna Anne | Direct | Sell | 8282026 | 34.62 | 20,962 | Form | |||
| 2 | Soloway, Donna Anne | Direct | Sell | 8282026 | 35.98 | 28,000 | 1,007,440 | 754,213 | Form | |
| 3 | Soloway, Richard | CEO, Chairman of Board, Secy | Direct | Sell | 3042026 | 43.22 | 55,318 | 2,390,844 | 47,410,525 | Form |
| 4 | Soloway, Richard | CEO, Chairman of Board, Secy | Direct | Sell | 3042026 | 44.99 | 129,682 | 5,834,393 | 51,840,897 | Form |
| 5 | Soloway, Richard | CEO, Chairman of Board, Secy | Direct | Sell | 2062026 | 42.74 | 150,000 | 6,411,000 | 53,681,867 | Form |
| # | Owner | Title | Holding | Action | Filing Date | Price | Shares | Transacted Value | Value of Held Shares | Form |
|---|---|---|---|---|---|---|---|---|---|---|
| 1 | Soloway, Donna Anne | Direct | Sell | 8282026 | 34.62 | 20,962 | Form | |||
| 2 | Soloway, Donna Anne | Direct | Sell | 8282026 | 35.98 | 28,000 | 1,007,440 | 754,213 | Form | |
| 3 | Soloway, Richard | CEO, Chairman of Board, Secy | Direct | Sell | 3042026 | 43.22 | 55,318 | 2,390,844 | 47,410,525 | Form |
| 4 | Soloway, Richard | CEO, Chairman of Board, Secy | Direct | Sell | 3042026 | 44.99 | 129,682 | 5,834,393 | 51,840,897 | Form |
| 5 | Soloway, Richard | CEO, Chairman of Board, Secy | Direct | Sell | 2062026 | 42.74 | 150,000 | 6,411,000 | 53,681,867 | Form |
| 6 | Spinelli, Stephen M | Senior Vice president of Sales | Direct | Sell | 11182025 | 40.25 | 19,000 | 764,750 | 37,352 | Form |
Investor Activity (13F)
Updated Nov 3, 2026Active managers (13F portfolio over $250M, at least 3 holdings) with a position over $5M that is either over 10% of their portfolio or held in a concentrated book of 50 or fewer total positions. Index/ETF, sovereign, bank, community-bank and charitable/donor-advised filers are excluded.
| Active Manager |
|---|
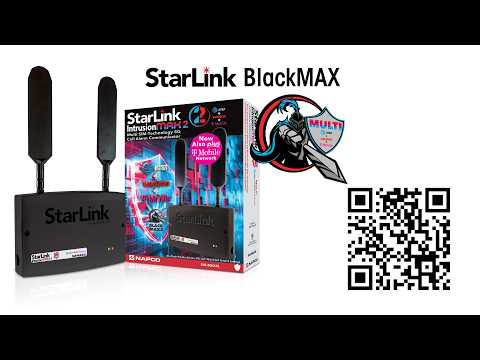
NAPCO Security Technologies — Investor Video Playlist



Industry Resources
| Information Technology Resources |
| TechCrunch |
| Wired |
| CIO |
| MIT Technology Review |
| Gartner Insights |
| Ars Technica |
| Electronic Equipment & Instruments Resources |
| EDN |
| Electronic Design |
| EE Journal |
External Quote Links
| Y Finance | Barrons |
| TradingView | Morningstar |
| SeekingAlpha | ValueLine |
| Motley Fool | Robinhood |
| CNBC | Etrade |
| MarketWatch | Unusual Whales |
| YCharts | Perplexity Finance |
| FinViz |
Prefer one of these to Trefis? Tell us why.