
Kimberly-Clark (KMB)
Market Price (11/8/2026): $108.65 | Market Cap: $66.7 BilInvestor Relations Sector: Consumer Staples | Industry: Household Products
Kimberly-Clark (KMB)
Market Price (11/8/2026): $108.65Market Cap: $66.7 BilSector: Consumer StaplesIndustry: Household Products
Investment Highlights Why It Matters Detailed financial logic regarding cash flow yields vs trend-riding momentum.
Attractive yieldTotal YieldTotal Yield = Earnings Yield + Dividend Yield, Earnings Yield = Net Income / Market Cap Dividend Yield = Total Dividends / Market Cap is 14%, Dividend Yield is 4.7%, ERPEquity Risk Premium (ERP) = Total Yield - Risk Free Rate, Reflects the premium above risk free assets offered by the investment. is 8.4%, FCF Yield is 5.4% Attractive cash flow generationCFO/Rev LTMCash Flow from Operations / Revenue (Sales), Last Twelve Months (LTM) is 20%, FCF/Rev LTMFree Cash Flow / Revenue (Sales), Last Twelve Months (LTM) is 12%, CFO LTM is 3.4 Bil Stock buyback supportStock Buyback 3Y Total is 1.3 Bil Low stock price volatilityVol 12M is 25% Megatrend and thematic driversMegatrends include Aging Population & Chronic Disease, Sustainable Consumption, and E-commerce & DTC Adoption. Themes include Geriatric Care, Show more. | Trading close to highsDist 52W High is -4.4% Weak multi-year price returns2Y Excs Rtn is -41%, 3Y Excs Rtn is -71% Meaningful short interestShort Interest Days-to-CoverDTC = (Short Interest Share Quantity) / (Average Daily Trading Volume). Reflects how many days it would take to cover (close out) the short interest based on average volumes. High DTC can signify an increased risk of a short squeeze. is 10.17, Short Interest % of Basic SharesShort Interest % of Basic Shares = (Short Interest Quantity) / (Basic Shares Outstanding). A high fraction of short interest can indicate potential risk of a short squeeze. is 15% | Weak revenue growthRev Chg 3Y AvgRevenue Change % averaged over trailing 3 years is -5.6%, Rev Chg QQuarterly Revenue Change % is -0.4% Key risksKMB key risks include substantial execution and integration challenges from its strategic transformation and planned Kenvue acquisition, Show more. |
| Attractive yieldTotal YieldTotal Yield = Earnings Yield + Dividend Yield, Earnings Yield = Net Income / Market Cap Dividend Yield = Total Dividends / Market Cap is 14%, Dividend Yield is 4.7%, ERPEquity Risk Premium (ERP) = Total Yield - Risk Free Rate, Reflects the premium above risk free assets offered by the investment. is 8.4%, FCF Yield is 5.4% |
| Attractive cash flow generationCFO/Rev LTMCash Flow from Operations / Revenue (Sales), Last Twelve Months (LTM) is 20%, FCF/Rev LTMFree Cash Flow / Revenue (Sales), Last Twelve Months (LTM) is 12%, CFO LTM is 3.4 Bil |
| Stock buyback supportStock Buyback 3Y Total is 1.3 Bil |
| Low stock price volatilityVol 12M is 25% |
| Megatrend and thematic driversMegatrends include Aging Population & Chronic Disease, Sustainable Consumption, and E-commerce & DTC Adoption. Themes include Geriatric Care, Show more. |
| Trading close to highsDist 52W High is -4.4% |
| Weak multi-year price returns2Y Excs Rtn is -41%, 3Y Excs Rtn is -71% |
| Meaningful short interestShort Interest Days-to-CoverDTC = (Short Interest Share Quantity) / (Average Daily Trading Volume). Reflects how many days it would take to cover (close out) the short interest based on average volumes. High DTC can signify an increased risk of a short squeeze. is 10.17, Short Interest % of Basic SharesShort Interest % of Basic Shares = (Short Interest Quantity) / (Basic Shares Outstanding). A high fraction of short interest can indicate potential risk of a short squeeze. is 15% |
| Weak revenue growthRev Chg 3Y AvgRevenue Change % averaged over trailing 3 years is -5.6%, Rev Chg QQuarterly Revenue Change % is -0.4% |
| Key risksKMB key risks include substantial execution and integration challenges from its strategic transformation and planned Kenvue acquisition, Show more. |
Qualitative Assessment
AI Analysis | Feedback
Kimberly-Clark (KMB) stock has remained largely at the same level since 7/31/2026 because of the following key factors:
1. Mixed Fiscal Q3 2026 Earnings Performance.
Kimberly-Clark reported adjusted diluted earnings per share (EPS) from continuing operations of $1.70 for fiscal Q3 2026, which beat analyst estimates of $1.64 to $1.66. This represented a 17.2% increase year-over-year, largely driven by lower net interest expense and a reduced adjusted effective tax rate. However, net sales declined 0.4% year-over-year to $4.13 billion, missing consensus estimates of $4.147 billion. Additionally, adjusted operating profit fell 0.9% to $677 million, falling short of analyst expectations of $690.7 million. This combination of an EPS beat but a sales and operating profit miss created a balanced scenario for investors, preventing a significant upward or downward movement in the stock price.
2. Persistent China Market Disruptions and North American Retailer Inventory Movements.
Organic sales for Kimberly-Clark declined 1.3% in fiscal Q3 2026, a deeper drop than the projected 0.56%. This underperformance was significantly impacted by ongoing social media disruptions in China, which imposed an approximate 270 basis points headwind on organic sales and a 530 basis points headwind on adjusted operating profit in the quarter. Furthermore, retailer inventory adjustments in North America also pressured sales performance. These company-specific operational challenges in key markets directly affected the top-line growth and profitability, contributing to the stock's stagnant trend.
Show more
Kimberly-Clark (KMB) stock has remained largely at the same level since 7/31/2026 because of the following key factors:
1. Mixed Fiscal Q3 2026 Earnings Performance.
Kimberly-Clark reported adjusted diluted earnings per share (EPS) from continuing operations of $1.70 for fiscal Q3 2026, which beat analyst estimates of $1.64 to $1.66. This represented a 17.2% increase year-over-year, largely driven by lower net interest expense and a reduced adjusted effective tax rate. However, net sales declined 0.4% year-over-year to $4.13 billion, missing consensus estimates of $4.147 billion. Additionally, adjusted operating profit fell 0.9% to $677 million, falling short of analyst expectations of $690.7 million. This combination of an EPS beat but a sales and operating profit miss created a balanced scenario for investors, preventing a significant upward or downward movement in the stock price.
2. Persistent China Market Disruptions and North American Retailer Inventory Movements.
Organic sales for Kimberly-Clark declined 1.3% in fiscal Q3 2026, a deeper drop than the projected 0.56%. This underperformance was significantly impacted by ongoing social media disruptions in China, which imposed an approximate 270 basis points headwind on organic sales and a 530 basis points headwind on adjusted operating profit in the quarter. Furthermore, retailer inventory adjustments in North America also pressured sales performance. These company-specific operational challenges in key markets directly affected the top-line growth and profitability, contributing to the stock's stagnant trend.
3. Reaffirmed Cautious Full-Year Outlook and Kenvue Acquisition Integration.
Kimberly-Clark reaffirmed its 2026 standalone outlook, projecting mid-single-digit growth in adjusted operating profit and high-single-digit growth in adjusted EPS from continuing operations on a constant-currency basis. While adjusted EPS growth was expected, the outlook also noted that 2026 organic sales growth is anticipated to be approximately 100 basis points below the company's weighted average category growth of 1.7%, primarily due to the China disruptions. Concurrently, the company completed its acquisition of Kenvue on November 2, 2026. Although the acquisition is expected to improve scale and productivity in the long term, the market appears to be in a "wait and see" mode regarding its full integration benefits and how it will offset ongoing operational headwinds, contributing to a stable stock price rather than a significant rally.
4. Broader Consumer Staples Sector Underperformance.
The overall consumer staples sector experienced a decline of approximately 3% in fiscal Q3 2026. This sector-wide weakness was influenced by macroeconomic factors such as surging oil prices, hotter inflation data, and a market rotation towards growth-oriented technology and AI stocks, which reduced hopes for interest rate cuts. Despite several consumer staples companies beating EPS estimates, investor confidence in the sector remained generally low. This broader market sentiment acted as an external headwind, limiting Kimberly-Clark's stock appreciation even as it navigated company-specific challenges and opportunities.
Show less
Stock Movement Drivers
Fundamental Drivers
The 0.4% change in KMB stock from 7/31/2026 to 11/7/2026 was primarily driven by a 55.7% change in the company's Net Income Margin (%).| (LTM values as of) | 7312026 | 11072026 | Change |
|---|---|---|---|
| Stock Price ($) | 108.01 | 108.43 | 0.4% |
| Change Contribution By: | |||
| Total Revenues ($ Mil) | 16,556 | 16,566 | 0.1% |
| Net Income Margin (%) | 12.8% | 19.9% | 55.7% |
| P/E Multiple | 16.9 | 10.9 | -35.4% |
| Shares Outstanding (Mil) | 332 | 333 | -0.2% |
| Cumulative Contribution | 0.4% |
Market Drivers
7/31/2026 to 11/7/2026| Return | Correlation | |
|---|---|---|
| KMB | 0.4% | |
| Market (SPY) | -1.6% | 7.6% |
| Sector (XLP) | 5.9% | 71.3% |
Fundamental Drivers
The 13.0% change in KMB stock from 4/30/2026 to 11/7/2026 was primarily driven by a 55.7% change in the company's Net Income Margin (%).| (LTM values as of) | 4302026 | 11072026 | Change |
|---|---|---|---|
| Stock Price ($) | 95.94 | 108.43 | 13.0% |
| Change Contribution By: | |||
| Total Revenues ($ Mil) | 16,556 | 16,566 | 0.1% |
| Net Income Margin (%) | 12.8% | 19.9% | 55.7% |
| P/E Multiple | 15.0 | 10.9 | -27.3% |
| Shares Outstanding (Mil) | 332 | 333 | -0.2% |
| Cumulative Contribution | 13.0% |
Market Drivers
4/30/2026 to 11/7/2026| Return | Correlation | |
|---|---|---|
| KMB | 13.0% | |
| Market (SPY) | 2.6% | -4.7% |
| Sector (XLP) | 7.6% | 70.9% |
Fundamental Drivers
The -4.8% change in KMB stock from 10/31/2025 to 11/7/2026 was primarily driven by a -43.1% change in the company's P/E Multiple.| (LTM values as of) | 10312025 | 11072026 | Change |
|---|---|---|---|
| Stock Price ($) | 113.88 | 108.43 | -4.8% |
| Change Contribution By: | |||
| Total Revenues ($ Mil) | 16,471 | 16,566 | 0.6% |
| Net Income Margin (%) | 12.0% | 19.9% | 66.7% |
| P/E Multiple | 19.2 | 10.9 | -43.1% |
| Shares Outstanding (Mil) | 332 | 333 | -0.2% |
| Cumulative Contribution | -4.8% |
Market Drivers
10/31/2025 to 11/7/2026| Return | Correlation | |
|---|---|---|
| KMB | -4.8% | |
| Market (SPY) | 8.7% | 0.8% |
| Sector (XLP) | 20.5% | 60.2% |
Fundamental Drivers
The 2.6% change in KMB stock from 10/31/2023 to 11/7/2026 was primarily driven by a 131.1% change in the company's Net Income Margin (%).| (LTM values as of) | 10312023 | 11072026 | Change |
|---|---|---|---|
| Stock Price ($) | 105.73 | 108.43 | 2.6% |
| Change Contribution By: | |||
| Total Revenues ($ Mil) | 20,425 | 16,566 | -18.9% |
| Net Income Margin (%) | 8.6% | 19.9% | 131.1% |
| P/E Multiple | 20.3 | 10.9 | -46.2% |
| Shares Outstanding (Mil) | 338 | 333 | 1.7% |
| Cumulative Contribution | 2.6% |
Market Drivers
10/31/2023 to 11/7/2026| Return | Correlation | |
|---|---|---|
| KMB | 2.6% | |
| Market (SPY) | 81.9% | 4.8% |
| Sector (XLP) | 43.0% | 62.4% |
Price Returns Compared
| 2021 | 2022 | 2023 | 2024 | 2025 | 2026 | Total [1] | |
|---|---|---|---|---|---|---|---|
| Returns | |||||||
| KMB Return | 10% | -2% | -7% | 12% | -20% | 12% | 0% |
| Peers Return | 13% | -12% | 5% | 11% | -25% | 29% | 12% |
| S&P 500 Return | 27% | -19% | 24% | 23% | 16% | 12% | 105% |
Monthly Win Rates [3] | |||||||
| KMB Win Rate | 50% | 42% | 33% | 50% | 33% | 45% | |
| Peers Win Rate | 48% | 45% | 50% | 63% | 23% | 69% | |
| S&P 500 Win Rate | 75% | 42% | 67% | 75% | 67% | 45% | |
Max Drawdowns [4] | |||||||
| KMB Max Drawdown | -9% | -22% | -19% | -11% | -31% | -17% | |
| Peers Max Drawdown | -18% | -29% | -20% | -14% | -32% | -23% | |
| S&P 500 Max Drawdown | -5% | -25% | -10% | -8% | -19% | -9% | |
[1] Cumulative total returns since the beginning of 2021
[2] Peers: PG, CL, CLX, CHD, EPC. See KMB Returns vs. Peers.
[3] Win Rate = % of calendar months in which monthly returns were positive
[4] Max drawdown represents maximum peak-to-trough decline within a year
[5] 2026 data is for the year up to 11/6/2026 (YTD)
How Low Can It Go
| Event | KMB | S&P 500 |
|---|---|---|
| Summer-Fall 2023 Five Percent Yield Shock | ||
| % Loss | -11.3% | -9.5% |
| % Gain to Breakeven | 12.7% | 10.5% |
| Time to Breakeven | 153 days | 24 days |
| 2022 Inflation Shock & Fed Tightening | ||
| % Loss | -20.9% | -24.5% |
| % Gain to Breakeven | 26.5% | 32.4% |
| Time to Breakeven | 66 days | 427 days |
| 2020 COVID-19 Crash | ||
| % Loss | -21.3% | -33.7% |
| % Gain to Breakeven | 27.1% | 50.9% |
| Time to Breakeven | 30 days | 140 days |
| 2016-2017 Trump Reflation Bond Selloff | ||
| % Loss | -11.3% | -3.7% |
| % Gain to Breakeven | 12.8% | 3.9% |
| Time to Breakeven | 98 days | 6 days |
| 2015-2016 China Devaluation / Global Growth Scare | ||
| % Loss | -11.1% | -12.2% |
| % Gain to Breakeven | 12.5% | 13.9% |
| Time to Breakeven | 48 days | 62 days |
| 2008-2009 Global Financial Crisis | ||
| % Loss | -34.8% | -53.4% |
| % Gain to Breakeven | 53.5% | 114.4% |
| Time to Breakeven | 253 days | 1085 days |
In The Past
Kimberly-Clark's stock fell -5.0% during the 2025 US Tariff Shock. Such a loss loss requires a 5.3% gain to breakeven.
Preserve Wealth
Limiting losses and compounding gains is essential to preserving wealth.
Asset Allocation
Actively managed asset allocation strategies protect wealth. Learn more.
| Event | KMB | S&P 500 |
|---|---|---|
| 2022 Inflation Shock & Fed Tightening | ||
| % Loss | -20.9% | -24.5% |
| % Gain to Breakeven | 26.5% | 32.4% |
| Time to Breakeven | 66 days | 427 days |
| 2020 COVID-19 Crash | ||
| % Loss | -21.3% | -33.7% |
| % Gain to Breakeven | 27.1% | 50.9% |
| Time to Breakeven | 30 days | 140 days |
| 2008-2009 Global Financial Crisis | ||
| % Loss | -34.8% | -53.4% |
| % Gain to Breakeven | 53.5% | 114.4% |
| Time to Breakeven | 253 days | 1085 days |
In The Past
Kimberly-Clark's stock fell -5.0% during the 2025 US Tariff Shock. Such a loss loss requires a 5.3% gain to breakeven.
Preserve Wealth
Limiting losses and compounding gains is essential to preserving wealth.
Asset Allocation
Actively managed asset allocation strategies protect wealth. Learn more.
About Kimberly-Clark (KMB)
Kimberly-Clark Corporation (KMB) is a global consumer goods company that manufactures and markets a wide array of personal care and consumer tissue products. With a history dating back to 1872, the company focuses on providing everyday essentials that enhance hygiene and well-being for individuals and organizations across the world.
The company's product portfolio is broadly categorized into three segments. The Personal Care segment includes disposable diapers (Huggies, Pull-Ups), baby wipes, and feminine and incontinence care products (Kotex, Depend). Its Consumer Tissue segment provides household staples like facial and bathroom tissues, paper towels, and napkins, under well-known brands such as Kleenex, Scott, and Cottonelle. The K-C Professional segment offers specialized wipers, tissues, towels, apparel, soaps, and sanitizers for away-from-home use in commercial and industrial settings, featuring brands like WypAll and Kimtech.
Kimberly-Clark serves a broad global market. For its household-use products, the company distributes through major retail channels including supermarkets, mass merchandisers, drugstores, and warehouse clubs, alongside growing e-commerce platforms. The K-C Professional segment targets businesses and institutions, supplying products directly to manufacturing, lodging, office building, food service, and public facilities, also leveraging distributors and e-commerce to reach its diverse clientele.
AI Analysis | Feedback
Here are a few brief analogies for Kimberly-Clark:
- Like Procter & Gamble, but primarily focused on personal hygiene products (diapers, feminine care) and consumer tissues (toilet paper, facial tissue, paper towels).
- Think of them as the Procter & Gamble of the baby and bathroom aisles.
AI Analysis | Feedback
- Personal Care Products: This segment includes disposable diapers, training pants, baby wipes, and feminine and incontinence care products sold under brands like Huggies, Kotex, and Depend.
- Consumer Tissue Products: This segment offers facial and bathroom tissues, paper towels, and napkins for household use, featuring brands such as Kleenex, Scott, and Cottonelle.
- K-C Professional Products: This segment provides wipers, tissues, towels, apparel, soaps, and sanitizers for away-from-home facilities, including brands like WypAll and Kimtech.
AI Analysis | Feedback
Kimberly-Clark Corporation primarily sells its products to other companies, which then distribute or sell these products to end-users (individuals or institutions). Its major customers are large retail chains, wholesale clubs, drugstores, distributors, and e-commerce platforms. For its K-C Professional segment, it also sells directly or through distributors to various commercial and institutional entities.
Major customer companies for Kimberly-Clark include, but are not limited to:
- Walmart Inc. (WMT)
- Target Corporation (TGT)
- Costco Wholesale Corporation (COST)
- The Kroger Co. (KR)
- CVS Health Corporation (CVS)
- Walgreens Boots Alliance, Inc. (WBA)
- Amazon.com, Inc. (AMZN)
Additionally, Kimberly-Clark sells to numerous other supermarkets, mass merchandisers, drugstores, warehouse clubs, variety and department stores, and other retail outlets globally, as well as various distributors for both household and away-from-home use products.
AI Analysis | Feedback
AI Analysis | Feedback
Michael Hsu, Chairman and Chief Executive Officer
Michael Hsu became Chairman of Kimberly-Clark in January 2020 and Chief Executive Officer in January 2019. He joined Kimberly-Clark in 2012, initially serving as Group President of the North American Consumer Products business, and later as President and Chief Operating Officer. Before joining Kimberly-Clark, Mr. Hsu held senior and executive leadership roles at Kraft Foods and H.J. Heinz Company. He began his career in the consumer products industry as a consultant with Booz Allen & Hamilton, where he advanced to partner in the firm's consumer practice. Mr. Hsu also serves on the board of directors of McDonald's.
Nelson Urdaneta, Chief Financial Officer & Senior Vice President
Nelson Urdaneta was appointed Chief Financial Officer of Kimberly-Clark, effective April 22, 2022. Prior to joining Kimberly-Clark, Mr. Urdaneta spent nearly 17 years at Mondelēz International. During his tenure at Mondelēz, he held various positions of increasing responsibility across multiple geographies, including Treasurer, Corporate Controller and Chief Accounting Officer, Chief Financial Officer of Asia Pacific, Supply Chain Finance leader for North America, and General Manager of Venezuela. Before Mondelēz, he held financial planning and analysis and supply chain pricing positions at Ryder System, Inc. He also served as a board member of Mondelēz's publicly traded joint ventures, JDE Peet's N.V. and Keurig Dr. Pepper Inc.
Russ Torres, President and Chief Operating Officer
Russ Torres was promoted to President and Chief Operating Officer of Kimberly-Clark in May 2025. In this role, he is responsible for the day-to-day operations of Kimberly-Clark's business segments, as well as the Global Supply Chain, Research & Development, Global Growth, and Digital Technology Solutions organizations. Mr. Torres joined Kimberly-Clark in 2020 as president of Kimberly-Clark's Professional business. Before his current appointment, he served as President of Kimberly-Clark's North America business.
Patricia Corsi, Chief Growth Officer
Patricia Corsi joined Kimberly-Clark as Chief Growth Officer, effective July 1, 2024. In this role, she oversees growth-centric brand and commercial capabilities, including global marketing, innovation, creative storytelling, design, insights & analytics, and revenue growth management. Prior to Kimberly-Clark, Ms. Corsi served as Chief Marketing, IT and Digital Officer at Bayer Consumer Health. She has also held leadership positions at Unilever and Heineken. Ms. Corsi is also a non-executive director at Tate & Lyle PLC.
Stacey Valy Panayiotou, Chief Human Resources Officer
Stacey Valy Panayiotou was appointed Chief Human Resources Officer of Kimberly-Clark, effective September 10, 2025. She is responsible for the global human resources function, including talent recruiting, development and performance management, labor relations, compensation, and employee benefits. Ms. Panayiotou joined Kimberly-Clark from Ball Corporation, where she most recently served as Chief Human Resources Officer, leading the end-to-end global function. Prior to Ball Corporation, she held several senior human resources leadership roles with global responsibility, including EVP and Chief Human Resources Officer at Graphic Packaging International and Global Vice President and Head of Talent and Development at The Coca-Cola Company.
AI Analysis | Feedback
Key Risks to Kimberly-Clark (KMB)
- Commodity Cost Volatility and Supply Chain Disruptions: Kimberly-Clark faces significant exposure to fluctuating raw material costs, such as wood pulp and polymer resins, as well as energy and logistics inflation. These cost volatilities can pressure margins and impact pricing power. The company's global operations also make it susceptible to supply chain disruptions, which can lead to increased costs and impede product delivery.
- Intense Competition and Shifting Consumer Preferences: The company operates in a highly competitive global market across its Personal Care, Consumer Tissue, and K-C Professional segments. Key rivals include Procter & Gamble, Unicharm, and Essity. Kimberly-Clark also faces increasing pressure from the growth of private-label alternatives and sustainable startups that can erode branded margins. Furthermore, changing consumer preferences, particularly a shift towards lower-priced options during inflationary periods and increased online shopping, can impact demand and market share.
- Softening Consumer Demand and Economic Headwinds: Kimberly-Clark is susceptible to a softening of consumer demand in various markets, particularly in international regions, influenced by economic pressures and inflation. There is evidence of a "bifurcated" consumer market where some consumers trade down to more affordable products. Additionally, declining birth rates in key markets such as China, South Korea, and the United States put pressure on the volume growth rates of its childcare products within the Personal Care segment.
AI Analysis | Feedback
- The growing consumer preference for reusable and sustainable alternatives across personal care and consumer tissue categories. This includes increased adoption of modern cloth diapers, menstrual cups, reusable period underwear, and reusable household cleaning products, directly threatening demand for Kimberly-Clark's core disposable product lines.
- The increasing market share captured by agile direct-to-consumer (DTC) brands and enhanced private labels, which often emphasize eco-friendliness, niche product features, and subscription models. These brands circumvent traditional retail channels and appeal to specific consumer segments, posing a challenge to Kimberly-Clark's established brand loyalty and distribution networks.
AI Analysis | Feedback
Kimberly-Clark Corporation (KMB) operates in several large addressable markets for its personal care, consumer tissue, and professional products. The market sizes for their main products and services are as follows:
- Baby Diapers: The global baby diapers market was estimated at USD 83.31 billion in 2025 and is projected to reach USD 141.80 billion by 2033. Another estimate places the global diaper market size at USD 80.90 billion in 2025, growing to USD 108.17 billion by 2034. The disposable baby diaper market alone was valued at USD 40.89 billion in 2026 and is expected to reach USD 47.92 billion by 2035 globally.
- Baby Wipes: The global baby wipes market size was estimated at USD 5.91 billion in 2024 and is projected to reach USD 7.99 billion by 2030. Another report estimates the global baby wipes market to be USD 6.2 billion in 2025, projected to reach USD 9.1 billion by 2035.
- Feminine Hygiene Products: The global feminine hygiene products market size was valued at USD 48.96 billion in 2025 and is predicted to increase to approximately USD 101.80 billion by 2035. Another source indicates the global feminine hygiene products market size was USD 45.56 billion in 2025 and is anticipated to grow to USD 85.81 billion by 2036.
- Adult Incontinence Products: The global adult incontinence products market size was estimated at USD 16.4 billion in 2024 and is expected to grow to USD 27.4 billion by 2034. Another estimate values the global adult incontinence products market at USD 17 billion in 2025, projected to grow to USD 27 billion by 2034. The disposable incontinence products market was estimated at USD 15.46 billion in 2025 and is predicted to increase to approximately USD 30.81 billion by 2035.
- Facial Tissue: The global facial tissues market size was estimated at USD 8.04 billion in 2024 and is projected to reach USD 10.28 billion by 2030. Other data suggests the global facial tissue market size was valued at USD 13.2 billion in 2023 and is expected to reach USD 27.8 billion by 2032. Another report indicates the global facial tissue paper market size was valued at USD 5.87 billion in 2024, projected to reach USD 7.35 billion by 2034.
- Bathroom Tissue (Toilet Paper): The global toilet paper market size was estimated at USD 56.36 billion in 2024 and is projected to grow to USD 79.53 billion by 2033. Another report states the global bath & toilet tissue market size was valued at USD 33.56 billion in 2025 and is projected to reach USD 61.04 billion by 2034.
- Paper Towels: The global paper towels market size was estimated at USD 15.2 billion in 2024 and is projected to reach USD 22.95 billion by 2035. Other estimates place the global paper towels market size at USD 17.63 billion in 2025, poised to grow to USD 28.17 billion by 2035.
- Professional/Away-From-Home (AFH) Hygiene Products: The global professional hygiene market size was USD 17.4 billion in 2024 and is predicted to reach USD 26.4 billion by 2032. Another source states the global professional hygiene market was valued at USD 17.80 billion in 2024, projected to reach USD 25.02 billion by 2030. The global away-from-home tissue and hygiene market size was valued at USD 45.18 billion in 2024 and is predicted to grow to USD 91.90 billion by 2034. North America held the largest share of the away-from-home tissue and hygiene market with 42.7% and a value of USD 18.1 billion in 2025.
AI Analysis | Feedback
- Organic Sales Growth through Price, Mix, and Volume: Kimberly-Clark anticipates continued organic net sales growth, driven by a balanced contribution from price realization, favorable product mix, and increasing volumes. This approach emphasizes healthier top-line momentum. For instance, the company expected a mid-single-digit percentage increase in 2024 Organic Net Sales, an upward revision from earlier forecasts. Pricing, particularly in hyperinflationary economies, and volume growth, spurred by innovation and improved supply, are key components of this strategy.
- Product Innovation and Premiumization: The company is focused on "pioneering innovation" to enhance the value proposition of its global brands and "elevate categories". This strategy involves making products better across the board and premiumizing offerings to drive demand. Kimberly-Clark plans to increase advertising spending and innovate further to drive growth.
- Strategic Market Expansion and Share Gains: Kimberly-Clark aims to expand its market presence and gain share in key regions and high-growth categories. The Personal Care segment is consistently highlighted as a strong revenue engine, with broad-based growth across regions and strong performance in markets like North America and China. The company has shown consistent double-digit growth in China over the past five years and is gaining market share in a fragmented category.
- Portfolio Optimization and Focus on Core Brands: Kimberly-Clark is strategically managing its portfolio by divesting non-core businesses to concentrate on higher-margin, branded products. Examples include the divestiture of the Brazil Tissue business and plans to exit certain private label diaper businesses in the U.S. to focus on proprietary, science-based innovation. This shift, while potentially causing short-term reported net sales headwinds, is intended to drive long-term profitable organic growth.
- Productivity Savings and Reinvestment in Brands: While not a direct revenue driver, the company's commitment to achieving significant productivity savings (e.g., $3 billion over several years) is crucial. These savings enhance profitability and allow Kimberly-Clark to reinvest in its brands, innovation pipeline, and commercial capabilities, which are fundamental to sustaining future revenue growth and competitive advantage.
AI Analysis | Feedback
Share Repurchases
- Kimberly-Clark repurchased 1.1 million shares at a cost of $141 million in 2025.
- In 2024, the company completed share repurchases of 7.2 million shares for $1.0 billion.
- Kimberly-Clark completed $225 million in share repurchases in 2023.
Share Issuance
- Kimberly-Clark stockholders approved the issuance of common stock to Kenvue stockholders in connection with a planned two-step merger on January 29, 2026. Approximately 96% of shares present at the meeting, totaling 239,054,286 votes, favored the issuance.
Outbound Investments
- Kimberly-Clark announced an agreement on November 3, 2025, to acquire all outstanding shares of Kenvue Inc. in a cash and stock transaction valued at approximately $48.7 billion.
- The company is in the process of selling its International Family Care and Professional (IFP) business, including a 51% ownership stake for $1.7 billion, with the transaction expected to close in mid-2026.
- In the first quarter of 2022, Kimberly-Clark acquired a controlling interest in Thinx.
Capital Expenditures
- Capital spending was $1.1 billion in 2025, a notable increase from $721 million in 2024.
- Capital expenditures were $721 million in 2024, following $766 million in 2023, $876 million in 2022, and $1.007 billion in 2021.
- Kimberly-Clark anticipates capital spending of approximately $1.3 billion in 2026, which includes investments related to its 2024 Transformation Initiative aimed at innovation, margin optimization, and organizational growth.

Peer Outperformance in Household Products
| Industry | Names | 1Y med | 3Y med | 5Y med | Top 3 by 5Y |
|---|---|---|---|---|---|
| Consumer Staples Merchandise Retail | 12 | 22.7% | 58.8% | 55.7% | WMT 167% · PSMT 128% · COST 117% |
| Tobacco | 6 | -28.4% | -8.3% | 37.2% | PM 164% · MO 147% |
| Food Retail | 6 | 6.9% | 65.0% | 34.5% | CASY 251% · SFM 103% · KR 78% |
| Soft Drinks & Non-alcoholic Beverages | 13 | 23.3% | -5.9% | 12.7% | COKE 402% · COCO 358% · MNST 100% |
| Food Distributors | 9 | 5.2% | 24.9% | 8.0% | CHEF 183% · USFD 177% · PFGC 121% |
| Brewers | 3 | 10.3% | -23.8% | 2.1% | BUD 48% · TAP 2% · SAM -56% |
| Personal Care Products | 4 | 21.5% | 9.0% | -13.8% | ELF 271% · PG 29% · COTY -56% |
| Household Products ← | 19 | 19.7% | 1.7% | -19.8% | IPAR 61% · CL 40% · CHD 31% |
| Packaged Foods & Meats | 48 | -24.0% | -32.8% | -36.2% | CALM 127% · TR 43% · SJM 24% |
| Agricultural Products & Services | 11 | -9.8% | -9.5% | -40.8% | ADM 25% · BG 22% · INGR 8% |
| Distillers & Vintners | 5 | -24.4% | -56.5% | -75.0% | STZ -30% · BF-B -53% |
| Drug Retail | 3 | -67.8% | -83.3% | -95.5% |
Latest Trefis Analyses
Research & Analysis
Invest in Strategies
Wealth Management
Peer Comparisons
| Peers to compare with: |
Financials
| Median | |
|---|---|
| Name | |
| Mkt Price | 103.81 |
| Mkt Cap | 31.0 |
| Rev LTM | 11,881 |
| Op Inc LTM | 1,767 |
| FCF LTM | 1,501 |
| FCF 3Y Avg | 1,579 |
| CFO LTM | 2,292 |
| CFO 3Y Avg | 2,180 |
Growth & Margins
| Median | |
|---|---|
| Name | |
| Rev Chg LTM | 4.7% |
| Rev Chg 3Y Avg | 1.4% |
| Rev Chg Q | 2.9% |
| QoQ Delta Rev Chg LTM | 0.7% |
| Op Inc Chg LTM | -1.4% |
| Op Inc Chg 3Y Avg | 1.9% |
| Op Mgn LTM | 16.3% |
| Op Mgn 3Y Avg | 16.7% |
| QoQ Delta Op Mgn LTM | -0.1% |
| CFO/Rev LTM | 19.8% |
| CFO/Rev 3Y Avg | 19.4% |
| FCF/Rev LTM | 14.3% |
| FCF/Rev 3Y Avg | 14.8% |
Valuation
| Median | |
|---|---|
| Name | |
| Mkt Cap | 31.0 |
| P/S | 2.9 |
| P/Op Inc | 16.9 |
| P/EBIT | 21.0 |
| P/E | 20.8 |
| P/CFO | 17.9 |
| Total Yield | 5.9% |
| Dividend Yield | 2.5% |
| FCF Yield 3Y Avg | 4.6% |
| D/E | 0.1 |
| Net D/E | 0.1 |
Returns
| Median | |
|---|---|
| Name | |
| 1M Rtn | 10.7% |
| 3M Rtn | 2.2% |
| 6M Rtn | 13.8% |
| 12M Rtn | 20.5% |
| 3Y Rtn | 10.4% |
| 1M Excs Rtn | 15.8% |
| 3M Excs Rtn | 7.9% |
| 6M Excs Rtn | 14.1% |
| 12M Excs Rtn | 13.6% |
| 3Y Excs Rtn | -62.9% |
Comparison Analyses
Segment Financials
Revenue by Segment| $ Mil | 2025 | 2024 | 2023 | 2022 | 2021 |
|---|---|---|---|---|---|
| Baby and Child Care | 6,773 | 7,056 | 7,054 | 7,166 | |
| Family Care | 4,056 | 3,928 | 4,024 | 6,243 | |
| Adult Care | 1,947 | 1,864 | 1,809 | 1,730 | |
| Professional | 1,841 | 2,152 | 2,385 | 3,256 | |
| Feminine Care | 1,706 | 1,721 | 1,787 | 1,695 | |
| All Other | 124 | 84 | 87 | 85 | |
| Consumer Tissue | 6,034 | ||||
| Corporate & Other | 67 | ||||
| Kimberly-Clark (K-C) Professional | 3,072 | ||||
| Personal Care | 10,267 | ||||
| Total | 16,447 | 16,805 | 17,146 | 20,175 | 19,440 |
| $ Mil | 2023 | 2022 | 2021 | 2020 | 2019 |
|---|---|---|---|---|---|
| Personal Care | 1,890 | 1,787 | 1,856 | 1,933 | 1,904 |
| Consumer Tissue | 976 | 806 | 888 | 1,448 | 1,007 |
| Kimberly-Clark (K-C) Professional | 665 | 457 | 404 | 528 | 657 |
| Other (income) and expense, net | -69 | 43 | -28 | 54 | 210 |
| Corporate & Other | -1,118 | -412 | -559 | -719 | -787 |
| Total | 2,344 | 2,681 | 2,561 | 3,244 | 2,991 |
| $ Mil | 2023 | 2022 | 2021 | 2020 | 2019 |
|---|---|---|---|---|---|
| Personal Care | 7,999 | 9,086 | 8,890 | 8,486 | 6,630 |
| Consumer Tissue | 4,935 | 5,048 | 5,083 | 5,227 | 4,954 |
| Kimberly-Clark (K-C) Professional | 2,507 | 2,675 | 2,650 | 2,551 | 2,442 |
| Corporate & Other | 1,903 | 1,161 | 1,214 | 1,259 | 1,257 |
| Total | 17,344 | 17,970 | 17,837 | 17,523 | 15,283 |
Price Behavior
| Market Price | $108.43 | |
| Market Cap ($ Bil) | 36.1 | |
| First Trading Date | 12/17/1984 | |
| Distance from 52W High | -4.4% | |
| 50 Days | 200 Days | |
| DMA Price | $102.46 | $101.43 |
| DMA Trend | down | indeterminate |
| Distance from DMA | 5.8% | 6.9% |
| 3M | 1YR | |
| Volatility | 27.4% | 25.1% |
| Downside Capture | 32.47 | 6.78 |
| Upside Capture | 42.56 | 21.46 |
| Correlation (S&P 500) | 2.8% | 1.2% |
| 1M | 2M | 3M | 6M | 1Y | 3Y | |
|---|---|---|---|---|---|---|
| Beta | -0.37 | 0.04 | 0.34 | -0.10 | 0.03 | 0.08 |
| Up Beta | -0.64 | -0.97 | 0.13 | -0.01 | 0.55 | 0.22 |
| Down Beta | -0.31 | -0.54 | -0.62 | -0.77 | -0.45 | -0.14 |
| Up Capture | 53% | 41% | 60% | 21% | -1% | 2% |
| Bmk +ve Days | 12 | 18 | 28 | 62 | 130 | 427 |
| Stock +ve Days | 11 | 18 | 27 | 60 | 123 | 390 |
| Down Capture | -111% | 30% | 69% | -8% | 7% | 23% |
| Bmk -ve Days | 10 | 25 | 36 | 64 | 121 | 325 |
| Stock -ve Days | 11 | 25 | 37 | 66 | 128 | 362 |
[1] Upside and downside betas calculated using positive and negative benchmark daily returns respectively
Based On 1-Year Data
| Annualized Return | Annualized Volatility | Sharpe Ratio | Correlation with KMB | |
|---|---|---|---|---|
| KMB | 14.0% | 25.1% | 0.47 | - |
| Sector ETF (XLP) | 21.2% | 15.8% | 1.01 | 66.8% |
| Equity (SPY) | 9.5% | 13.6% | 0.40 | 1.0% |
| Gold (GLD) | 1.6% | 28.7% | 0.05 | 9.7% |
| Commodities (DBC) | 38.4% | 21.2% | 1.42 | -32.5% |
| Real Estate (VNQ) | 11.3% | 14.2% | 0.51 | 43.5% |
| Bitcoin (BTCUSD) | -27.2% | 43.6% | -0.61 | -13.1% |
Smart multi-asset allocation framework can stack odds in your favor. Learn How
Based On 5-Year Data
| Annualized Return | Annualized Volatility | Sharpe Ratio | Correlation with KMB | |
|---|---|---|---|---|
| KMB | 0.4% | 21.3% | -0.06 | - |
| Sector ETF (XLP) | 7.5% | 14.0% | 0.31 | 64.2% |
| Equity (SPY) | 11.3% | 17.3% | 0.48 | 16.0% |
| Gold (GLD) | 17.5% | 19.1% | 0.74 | 6.7% |
| Commodities (DBC) | 8.1% | 19.6% | 0.30 | -15.2% |
| Real Estate (VNQ) | 1.3% | 18.9% | -0.04 | 35.1% |
| Bitcoin (BTCUSD) | 4.0% | 51.6% | 0.26 | 0.4% |
Smart multi-asset allocation framework can stack odds in your favor. Learn How
Based On 10-Year Data
| Annualized Return | Annualized Volatility | Sharpe Ratio | Correlation with KMB | |
|---|---|---|---|---|
| KMB | 3.1% | 21.6% | 0.12 | - |
| Sector ETF (XLP) | 8.4% | 15.0% | 0.42 | 68.0% |
| Equity (SPY) | 15.0% | 18.0% | 0.70 | 30.7% |
| Gold (GLD) | 11.9% | 16.5% | 0.59 | 6.7% |
| Commodities (DBC) | 7.5% | 18.1% | 0.33 | -3.1% |
| Real Estate (VNQ) | 5.9% | 20.7% | 0.24 | 41.0% |
| Bitcoin (BTCUSD) | 60.0% | 66.3% | 1.00 | 1.4% |
Smart multi-asset allocation framework can stack odds in your favor. Learn How
Returns Analyses
Earnings Returns History
Updated 11/8/2026| Forward Returns | |||
|---|---|---|---|
| Earnings Date | 1D Returns | 5D Returns | 21D Returns |
| 11/5/2026 | 1.5% | ||
| 8/4/2026 | 3.7% | 0.4% | -0.4% |
| 4/28/2026 | 0.2% | -2.6% | 2.0% |
| 1/27/2026 | -0.5% | -1.6% | 8.0% |
| 10/30/2025 | 3.0% | -14.3% | -7.0% |
| 8/1/2025 | 4.8% | 9.7% | 3.6% |
| 4/22/2025 | -1.5% | -6.5% | 1.1% |
| 1/28/2025 | -1.5% | -0.7% | 5.9% |
| ... | |||
| SUMMARY STATS | |||
| # Positive | 12 | 8 | 12 |
| # Negative | 12 | 15 | 11 |
| Median Positive | 3.1% | 3.9% | 2.2% |
| Median Negative | -2.7% | -2.6% | -5.5% |
| Max Positive | 8.1% | 10.8% | 16.5% |
| Max Negative | -5.9% | -14.3% | -7.9% |
| Forward Returns | |||
|---|---|---|---|
| Earnings Date | 1D Returns | 5D Returns | 21D Returns |
| 11/5/2026 | 1.5% | ||
| 8/4/2026 | 3.7% | 0.4% | -0.4% |
| 4/28/2026 | 0.2% | -2.6% | 2.0% |
| 1/27/2026 | -0.5% | -1.6% | 8.0% |
| 10/30/2025 | 3.0% | -14.3% | -7.0% |
| 8/1/2025 | 4.8% | 9.7% | 3.6% |
| 4/22/2025 | -1.5% | -6.5% | 1.1% |
| 1/28/2025 | -1.5% | -0.7% | 5.9% |
| 10/22/2024 | -4.5% | -6.0% | -6.0% |
| 7/23/2024 | -5.7% | -2.3% | 0.1% |
| 4/23/2024 | 5.5% | 5.4% | 3.7% |
| 1/24/2024 | -5.5% | -2.6% | -3.1% |
| 10/24/2023 | -1.1% | -1.9% | -0.2% |
| 7/25/2023 | -3.1% | -5.9% | -6.7% |
| 4/25/2023 | 1.6% | 2.4% | -2.7% |
| 1/25/2023 | -1.9% | -3.4% | -5.5% |
| 10/25/2022 | 3.1% | 7.4% | 16.5% |
| 7/26/2022 | 0.4% | 1.5% | 0.6% |
| 4/22/2022 | 8.1% | 10.8% | 0.2% |
| 1/26/2022 | -3.4% | -1.7% | -7.9% |
| 10/25/2021 | -2.2% | -2.7% | 1.8% |
| 7/23/2021 | 0.5% | 0.9% | 2.4% |
| 4/23/2021 | -5.9% | -5.5% | -5.7% |
| 1/25/2021 | 3.3% | -0.1% | -0.2% |
| SUMMARY STATS | |||
| # Positive | 12 | 8 | 12 |
| # Negative | 12 | 15 | 11 |
| Median Positive | 3.1% | 3.9% | 2.2% |
| Median Negative | -2.7% | -2.6% | -5.5% |
| Max Positive | 8.1% | 10.8% | 16.5% |
| Max Negative | -5.9% | -14.3% | -7.9% |
SEC Filings
Expand for More| Report Date | Filing Date | Filing |
|---|---|---|
| 09/30/2026 | 11/05/2026 | 10-Q |
| 06/30/2026 | 08/04/2026 | 10-Q |
| 03/31/2026 | 04/28/2026 | 10-Q |
| 12/31/2025 | 02/12/2026 | 10-K |
| 09/30/2025 | 10/30/2025 | 10-Q |
| 06/30/2025 | 08/01/2025 | 10-Q |
| 03/31/2025 | 04/22/2025 | 10-Q |
| 12/31/2024 | 02/13/2025 | 10-K |
| 09/30/2024 | 10/22/2024 | 10-Q |
| 06/30/2024 | 07/23/2024 | 10-Q |
| 03/31/2024 | 04/23/2024 | 10-Q |
| 12/31/2023 | 02/08/2024 | 10-K |
| 09/30/2023 | 10/24/2023 | 10-Q |
| 06/30/2023 | 07/25/2023 | 10-Q |
| 03/31/2023 | 04/25/2023 | 10-Q |
| 12/31/2022 | 02/09/2023 | 10-K |
| Report Date | Filing Date | Filing |
|---|---|---|
| 09/30/2026 | 11/05/2026 | 10-Q |
| 06/30/2026 | 08/04/2026 | 10-Q |
| 03/31/2026 | 04/28/2026 | 10-Q |
| 12/31/2025 | 02/12/2026 | 10-K |
| 09/30/2025 | 10/30/2025 | 10-Q |
| 06/30/2025 | 08/01/2025 | 10-Q |
| 03/31/2025 | 04/22/2025 | 10-Q |
| 12/31/2024 | 02/13/2025 | 10-K |
| 09/30/2024 | 10/22/2024 | 10-Q |
| 06/30/2024 | 07/23/2024 | 10-Q |
| 03/31/2024 | 04/23/2024 | 10-Q |
| 12/31/2023 | 02/08/2024 | 10-K |
| 09/30/2023 | 10/24/2023 | 10-Q |
| 06/30/2023 | 07/25/2023 | 10-Q |
| 03/31/2023 | 04/25/2023 | 10-Q |
| 12/31/2022 | 02/09/2023 | 10-K |
| 09/30/2022 | 10/25/2022 | 10-Q |
| 06/30/2022 | 07/26/2022 | 10-Q |
| 03/31/2022 | 04/22/2022 | 10-Q |
| 12/31/2021 | 02/10/2022 | 10-K |
| 09/30/2021 | 10/25/2021 | 10-Q |
| 06/30/2021 | 07/23/2021 | 10-Q |
| 03/31/2021 | 04/23/2021 | 10-Q |
| 12/31/2020 | 02/11/2021 | 10-K |
| 09/30/2020 | 10/22/2020 | 10-Q |
| 06/30/2020 | 07/23/2020 | 10-Q |
| 03/31/2020 | 04/22/2020 | 10-Q |
| 12/31/2019 | 02/13/2020 | 10-K |
Recent Forward Guidance
Updated 11/6/2026Latest: Q3 2026 Earnings Reported 11/5/2026
| Forward Guidance | Guidance Change | |||||||
|---|---|---|---|---|---|---|---|---|
| Metric | Source | Low | Mid | High | % Chg | % Delta | Change | Prior |
| 2026 Adjusted Operating Profit Growth (Constant Currency) | Reported | 4.0% | 5.0% | 6.0% | 0.0% | Affirmed | Guidance: 5.0% for 2026 | |
| 2026 Organic Sales Growth | Reported | 0.7% | -0.3% | Lowered | Guidance: 1.0% for 2026 | |||
| 2026 Adjusted EPS from Continuing Operations Growth (Constant Currency) | Reported | 7.0% | 8.0% | 9.0% | 0.0% | Affirmed | Guidance: 8.0% for 2026 | |
| 2026 Adjusted EPS Attributable to Kimberly-Clark Growth (Constant Currency) | Reported | -3.0% | -2.0% | -1.0% | 0.0% | Affirmed | Guidance: -2.0% for 2026 | |
Prior: Q2 2026 Earnings Reported 8/4/2026
| Forward Guidance | Guidance Change | |||||||
|---|---|---|---|---|---|---|---|---|
| Metric | Source | Low | Mid | High | % Chg | % Delta | Change | Prior |
| 2026 Adjusted Operating Profit Growth | Reported | 5.0% | -2.0% | Lowered | Guidance: 7.0% for 2026 | |||
| 2026 Income from Equity Companies Growth | Reported | 30.0% | ||||||
| 2026 Organic Sales Growth | Reported | 1.0% | ||||||
| 2026 Adjusted EPS from Continuing Operations Growth | Reported | 8.0% | -2.0% | Lowered | Guidance: 10.0% for 2026 | |||
| 2026 Adjusted EPS Attributable to Kimberly-Clark Growth | Reported | -2.0% | ||||||
Q1 2026 Earnings Reported 4/28/2026
| Forward Guidance | Guidance Change | |||||||
|---|---|---|---|---|---|---|---|---|
| Metric | Source | Low | Mid | High | % Chg | % Delta | Change | Prior |
| 2026 Adjusted Operating Profit Growth | Reported | 5.0% | 7.0% | 0.0% | Affirmed | Guidance: 7.0% for 2026 | ||
| 2026 Adjusted Effective Tax Rate | Reported | 23.0% | 0.0% | Affirmed | Guidance: 23.0% for 2026 | |||
| 2026 Adjusted EPS from Continuing Operations Growth | Reported | 10.0% | 0.0% | Affirmed | Guidance: 10.0% for 2026 | |||
Q4 2025 Earnings Reported 1/27/2026
| Forward Guidance | Guidance Change | |||||||
|---|---|---|---|---|---|---|---|---|
| Metric | Source | Low | Mid | High | % Chg | % Delta | Change | Prior |
| 2026 Adjusted Operating Profit Growth | Reported | 7.0% | 5.0% | Higher New | Guidance: 2.0% for 2025 | |||
| 2026 Income from Equity Companies Increase | Reported | 0.3 | ||||||
| 2026 Organic Sales Growth | Reported | 2.0% | 0 | Same New | Guidance: 2.0% for 2025 | |||
| 2026 Adjusted Effective Tax Rate | Reported | 23.0% | ||||||
| 2026 Adjusted EPS from Continuing Operations Growth | Reported | 10.0% | 6.5% | Higher New | Guidance: 3.5% for 2025 | |||
Insider Activity
Updated 11/4/2026| # | Owner | Title | Holding | Action | Filing Date | Price | Shares | Transacted Value | Value of Held Shares | Form |
|---|---|---|---|---|---|---|---|---|---|---|
| 1 | Scribner, Andrew | Controller, VP & FP&A | Direct | Sell | 5062026 | 98.00 | 4,095 | Form | ||
| 2 | Chen, Katy | President, Int'l Personal Care | Direct | Sell | 5042026 | 95.34 | 1,596 | 152,164 | 797,241 | Form |
| 3 | Chen, Katy | President, Int'l Personal Care | Direct | Sell | 5012026 | 96.95 | 1,405 | 136,222 | 630,401 | Form |
| 4 | MacLin, Todd | Trust | Buy | 2092026 | 104.15 | 10,000 | 1,041,467 | 1,041,467 | Form | |
| 5 | Scribner, Andrew | Controller, VP & FP&A | Direct | Sell | 2052026 | 104.29 | 3,049 | Form |
| # | Owner | Title | Holding | Action | Filing Date | Price | Shares | Transacted Value | Value of Held Shares | Form |
|---|---|---|---|---|---|---|---|---|---|---|
| 1 | Scribner, Andrew | Controller, VP & FP&A | Direct | Sell | 5062026 | 98.00 | 4,095 | Form | ||
| 2 | Chen, Katy | President, Int'l Personal Care | Direct | Sell | 5042026 | 95.34 | 1,596 | 152,164 | 797,241 | Form |
| 3 | Chen, Katy | President, Int'l Personal Care | Direct | Sell | 5012026 | 96.95 | 1,405 | 136,222 | 630,401 | Form |
| 4 | MacLin, Todd | Trust | Buy | 2092026 | 104.15 | 10,000 | 1,041,467 | 1,041,467 | Form | |
| 5 | Scribner, Andrew | Controller, VP & FP&A | Direct | Sell | 2052026 | 104.29 | 3,049 | Form |
Investor Activity (13F)
Updated Nov 8, 2026Active managers (13F portfolio over $250M, at least 3 holdings) with a position over $5M that is either over 10% of their portfolio or held in a concentrated book of 50 or fewer total positions. Index/ETF, sovereign, bank, community-bank and charitable/donor-advised filers are excluded.
| Active Manager | Value | % of Portfolio | Total Positions | QoQ | Filing |
|---|---|---|---|---|---|
| Sessa Capital IM, L.P. | $427.5 Mil | 8.1% | 31 | New | 13F |
| Holowesko Partners Ltd. | $23.9 Mil | 6.7% | 31 | TRIM -14.1% | 13F |
| Nuance Investments, LLC | $29.7 Mil | 4.1% | 43 | ADD +182.3% | 13F |
| Heathbridge Capital Management Ltd. | $10.2 Mil | 3.7% | 29 | New | 13F |
| Compass Rose Asset Management, LP | $10.1 Mil | 3.3% | 15 | TRIM -46.4% | 13F |
| Petrus Trust Company, LTA | $26.1 Mil | 2.9% | 27 | ADD +47.9% | 13F |
| HS Management Partners, LLC | $6.4 Mil | 2.2% | 24 | New | 13F |
| Active Manager | Value | % of Portfolio | Total Positions | QoQ | Filing |
|---|---|---|---|---|---|
| Sessa Capital IM, L.P. | $427.5 Mil | 8.1% | 31 | New | 13F |
| Heathbridge Capital Management Ltd. | $10.2 Mil | 3.7% | 29 | New | 13F |
| HS Management Partners, LLC | $6.4 Mil | 2.2% | 24 | New | 13F |
| Nuance Investments, LLC | $29.7 Mil | 4.1% | 43 | ADD +182.3% | 13F |
| Petrus Trust Company, LTA | $26.1 Mil | 2.9% | 27 | ADD +47.9% | 13F |
| Active Manager | Value | % of Portfolio | Total Positions | QoQ | As Of | Filing |
|---|---|---|---|---|---|---|
| TOMS Capital Investment Management LP | $92.3 Mil | 6.4% | 13 | Exited | Dec 31, 2025 | 13F |
| Campbell Capital Management Inc | $7.2 Mil | 2.4% | 46 | Exited | Dec 31, 2025 | 13F |
| Compass Rose Asset Management, LP | $10.1 Mil | 3.3% | 15 | TRIM -46.4% | Mar 31, 2026 | 13F |
| Holowesko Partners Ltd. | $23.9 Mil | 6.7% | 31 | TRIM -14.1% | Mar 31, 2026 | 13F |
| Active Manager | Value | % of Portfolio | Total Positions | QoQ | Filing |
|---|---|---|---|---|---|
| Sessa Capital IM, L.P. | $427.5 Mil | 8.1% | 31 | New | 13F |
| Nuance Investments, LLC | $29.7 Mil | 4.1% | 43 | ADD +182.3% | 13F |
| Petrus Trust Company, LTA | $26.1 Mil | 2.9% | 27 | ADD +47.9% | 13F |
| Holowesko Partners Ltd. | $23.9 Mil | 6.7% | 31 | TRIM -14.1% | 13F |
| Heathbridge Capital Management Ltd. | $10.2 Mil | 3.7% | 29 | New | 13F |
| Compass Rose Asset Management, LP | $10.1 Mil | 3.3% | 15 | TRIM -46.4% | 13F |
| HS Management Partners, LLC | $6.4 Mil | 2.2% | 24 | New | 13F |
KMB Trade Sentinel
Constructive
CONVICTION RATIONALE
Kimberly-Clark is at a defining moment, having just acquired Kenvue to pivot toward higher-growth health categories. While recent organic sales contracted 0.4%, the company affirmed its full-year 2026 guidance, signaling confidence. The investment case now rests entirely on management executing a complex integration and delivering on its synergy plan.
STOCK ARCHETYPE
Branded Consumer Goods(Volume of units sold) x (Average net selling price per unit) Margin expansion through productivity initiatives, cost synergies from acquisitions, and a favorable mix shift towards higher-margin premium and health products.
INVESTMENT THESIS
The recent Kenvue acquisition repositions the portfolio toward higher-growth categories, with a clear plan for synergy capture.
- The acquisition of Kenvue, a global consumer health leader, was completed on November 2, 2026.
- Management has a clear three-phase 'ready, set, and grow' integration plan to deliver value.
- The company affirmed its full-year 2026 guidance for organic sales and adjusted operating profit growth.
- The stated goal is to pivot the portfolio to 'higher growth, higher margin personal care categories'.
PRIMARY RISK
Failure to integrate Kenvue smoothly could disrupt operations, miss synergy targets, and strain a balance sheet now carrying 'substantially increased indebtedness.'
- The company incurred 'substantially increased indebtedness' to fund the ~$6.7 billion cash portion of the deal.
- Latest-quarter revenue declined 0.4%, with both price (-1.1%) and volume (-0.3%) falling.
- Latest-quarter gross margin contracted 1.1 percentage points, reversing a prior positive trend.
- Filings warn that anticipated synergies 'may not be realized when expected or at all'.
| KPI | Status | Rationale |
|---|---|---|
| Latest-Quarter Revenue Growth | -0.4% year-over-year for the quarter ended 9/30/2026 - Decelerating | The year-over-year growth rate has decelerated for two consecutive quarters, turning negative in the latest period. Management attributed the weakness to "one-off headwinds," including a social media disruption in China that created an approximate 270 basis point headwind to volume growth. |
| Inventory-vs-Revenue Growth Divergence | +2.9 percentage points for the quarter ended 9/30/2026 - Decelerating | In the latest quarter, inventory grew 2.5% year-over-year while revenue declined -0.4%. This is a reversal from the prior quarter, where inventory growth was below revenue growth, signaling a potential build-up of unsold goods. |
| Trailing-Twelve-Month Revenue Growth (YoY) | 0.6% (TTM ended 9/30/2026) | Represents the company's revenue growth over the past year, smoothing out quarterly volatility. The low positive number indicates near-stagnant growth. |
| Trailing-Twelve-Month Operating Margin | 14.5% (TTM ended 9/30/2026) | Shows the company's core profitability from its operations. The year-over-year increase from 13.7% indicates improved operational efficiency or pricing power relative to costs. |
Transformation Promise vs. Integration Peril
BULL VIEW
Bulls believe the Kenvue acquisition is a brilliant pivot that creates a higher-quality business, and that management's strong record on strategic deals ensures they will deliver the promised synergies.
CORE TENSION
Can the future value from $1.9 billion in Kenvue synergies overcome the drag from a core business with a -0.4% latest-quarter revenue decline and a newly leveraged balance sheet?
PREVAILING SENTIMENT
The latest evidence slightly favors the bulls. Management's decision to affirm full-year 2026 guidance suggests the recent operational weakness is contained and the transformation plan remains on track.
BEAR VIEW
Bears see a company taking on huge debt and execution risk while its core business is already faltering, with recent declines in revenue, volume, and price signaling deeper issues.
| Timeline | Event & Metric To Watch |
|---|---|
1/20/2027 | Peer Commentary Signals Worsening Macro Watch: PG's commentary on volume trends, private label pressure, and raw material inflation in shared categories like baby care and family care. |
1/25/2027 | China Diaper Recovery Stalls Watch: Management commentary on market share and consumer trust in China; any revision to the recovery timeline. |
1/25/2027 | Margin Erosion Persists Watch: Gross margin performance in the Q4 earnings report and management's outlook for cost inflation versus pricing power into 2027. |
1/25/2027 | Next Earnings Report Watch: The company is scheduled to report its next quarterly earnings, providing updates on the Kenvue integration, China recovery, and margin performance. |
1/28/2027 | Peer Earnings Reports Watch: Peers Colgate-Palmolive and Church & Dwight are scheduled to report earnings, offering further insight into the consumer staples environment. |
WITHIN_SIX_MONTHS | Kenvue Integration Stumbles Watch: Reports of operational disruptions, executive departures from the acquired business, or downward revisions to synergy targets. |
| Date | Event | Stock Impact |
|---|---|---|
2026-11-02 | Kenvue Acquisition Completed Details: On November 2, 2026, the company completed its acquisition of Kenvue for cash consideration of approximately $6.7 billion and approximately 281.1 million shares of K-C common stock. | -3.2% $107.94 -> $104.46 |
2026-10-29 | Kenvue Acquisition Financing Details: The company priced and closed a $4.9 billion private offering of senior unsecured notes to help fund the cash consideration for the pending Kenvue acquisition. | -0.4% $108.40 -> $107.94 |
2026-09-03 | Huggies NICU Campaign Details: The Huggies brand renamed its nano and micro preemie diapers 'Huggies Little Fighters' to mark NICU Awareness Month. | -2.8% $107.99 -> $104.96 |
2026-08-06 | Q2 Earnings and Outlook Update Details: The company reported Q2 results and lowered its full-year outlook, citing one-time disruptions and a softer consumer backdrop. | -2.4% $111.04 -> $108.38 |
2026-07-01 | IFP Joint Venture Completed Details: On July 1, 2026, the company completed the transaction to form the Arbex Joint Venture with Suzano, contributing its IFP business for a 49% equity interest and ~$1.3 billion. | +4.5% $108.47 -> $113.36 |
2026-06-08 | Pull-Ups Tech Launch Details: The Pull-Ups brand introduced Learning Layer technology in Canada to help children in potty training recognize the difference between wet and dry. | +1.5% $97.87 -> $99.33 |
2026-05-14 | Dividend Declared Details: The board of directors declared a regular quarterly dividend of $1.28 per share, payable on July 2, 2026. | -1.2% $94.59 -> $93.49 |
Position Sizing
4% - 6%
NORMAL POSITION
Sizing is volatility-based: KMB trades at roughly 27% annualized realized (three-month) volatility versus about 10% for the S&P 500 (2.6x the market). A 4% - 6% position keeps a single-name swing of that size within a diversified portfolio's risk budget.
Diversification Alternatives
PG - Procter & Gamble
Best-in-Class OperatorProcter & Gamble offers superior scale, with revenue 5.3 times larger than Kimberly-Clark's, and demonstrates stronger execution with revenue growth and significantly higher gross margins than Kimberly-Clark's 34.9%.
CL - a business partner
Margin Leadera business partner operates with a structurally more profitable model, boasting a trailing-twelve-month gross margin of 60.6% that far exceeds Kimberly-Clark's 34.9%, providing greater financial flexibility.
A consumer staples giant betting on a massive transformation, trading stable but slow tissue businesses for higher-growth consumer health via the Kenvue acquisition, creating a new investment thesis centered on integration execution and synergy capture.
Kimberly-Clark has just completed its acquisition of Kenvue, a defining moment that reshapes its portfolio towards health and wellness. This move is the cornerstone of its 'Powering Care' strategy, aiming to create a new kind of health and wellness company. The near-term focus is entirely on seamless integration, delivering on synergy commitments, and strengthening the core brands of both legacy companies. The success of this thesis hinges on executing a complex integration while navigating near-term headwinds like the disruption in its China diaper business.
Evidence of successful Kenvue integration, such as achieving or exceeding synergy targets, and a swift recovery of the China diaper business, along with market share gains in newly acquired Kenvue brands.
Faltering Kenvue integration, missed synergy targets, higher-than-expected integration costs, prolonged brand damage in China, or further share losses in core North American personal care categories.
Short-term fluctuations in commodity costs or quarterly retailer inventory shifts that do not reflect underlying consumer demand trends.
Repricing Catalyst
The successful execution of the Kenvue integration and delivery of the promised cost and revenue synergies, which management has laid out in a three-phase 'ready, set, and grow' plan.
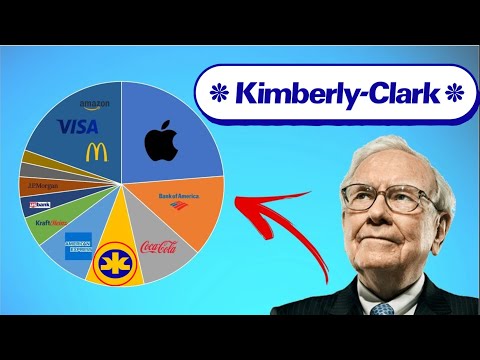
Kimberly-Clark — Investor Video Playlist



Industry Resources
| Consumer Staples Resources |
| FoodNavigator |
| Consumer Goods Technology (CGT) |
| Beverage Digest |
| Household Products Resources |
| Happi (Household and Personal Products Industry) |
| Nonwovens Industry |
| Consumer Reports - Household Products |
External Quote Links
| Y Finance | Barrons |
| TradingView | Morningstar |
| SeekingAlpha | ValueLine |
| Motley Fool | Robinhood |
| CNBC | Etrade |
| MarketWatch | Unusual Whales |
| YCharts | Perplexity Finance |
| FinViz |
Prefer one of these to Trefis? Tell us why.