
nLight (LASR)
Market Price (10/20/2026): $34.7 | Market Cap: $2.0 BilSector: Information Technology | Industry: Semiconductors
nLight (LASR)
Market Price (10/20/2026): $34.7Market Cap: $2.0 BilSector: Information TechnologyIndustry: Semiconductors
Investment Highlights Why It Matters Detailed financial logic regarding cash flow yields vs trend-riding momentum.
Cash is significant % of market capNet D/ENet Debt/Equity. Debt net of cash. Negative indicates net cash. Equity is taken as the Market Capitalization is -16% Strong revenue growthRev Chg LTMRevenue Change % Last Twelve Months (LTM) is 43% Attractive cash flow generationCFO/Rev LTMCash Flow from Operations / Revenue (Sales), Last Twelve Months (LTM) is 17%, FCF/Rev LTMFree Cash Flow / Revenue (Sales), Last Twelve Months (LTM) is 13% Valuation becoming less expensiveP/S 6M Chg %Price/Sales change over 6 months. Declining P/S indicates valuation has become less expensive. is -40% Megatrend and thematic driversMegatrends include Automation & Robotics, Battery Technology & Metals, and Advanced Materials. Themes include Factory Automation, Show more. | Not profitable at operating income levelOp Inc LTMOperating Income, Last Twelve Months is -14 Mil, Op Mgn LTMOperating Margin = Operating Income / Revenue Reflects profitability before taxes and before impact of capital structure (interest payments). is -4.6% Significant share based compensationSBC/Rev LTMShare Based Compensation / Revenue (Sales), Last Twelve Months (LTM) is 14% Yield minus risk free rate is negativeERPEquity Risk Premium (ERP) = Total Yield - Risk Free Rate, Reflects the premium above risk free assets offered by the investment. is -4.7% Key risksLASR key risks include [1] its significant revenue concentration within the U.S. Show more. |
| Cash is significant % of market capNet D/ENet Debt/Equity. Debt net of cash. Negative indicates net cash. Equity is taken as the Market Capitalization is -16% |
| Strong revenue growthRev Chg LTMRevenue Change % Last Twelve Months (LTM) is 43% |
| Attractive cash flow generationCFO/Rev LTMCash Flow from Operations / Revenue (Sales), Last Twelve Months (LTM) is 17%, FCF/Rev LTMFree Cash Flow / Revenue (Sales), Last Twelve Months (LTM) is 13% |
| Valuation becoming less expensiveP/S 6M Chg %Price/Sales change over 6 months. Declining P/S indicates valuation has become less expensive. is -40% |
| Megatrend and thematic driversMegatrends include Automation & Robotics, Battery Technology & Metals, and Advanced Materials. Themes include Factory Automation, Show more. |
| Not profitable at operating income levelOp Inc LTMOperating Income, Last Twelve Months is -14 Mil, Op Mgn LTMOperating Margin = Operating Income / Revenue Reflects profitability before taxes and before impact of capital structure (interest payments). is -4.6% |
| Significant share based compensationSBC/Rev LTMShare Based Compensation / Revenue (Sales), Last Twelve Months (LTM) is 14% |
| Yield minus risk free rate is negativeERPEquity Risk Premium (ERP) = Total Yield - Risk Free Rate, Reflects the premium above risk free assets offered by the investment. is -4.7% |
| Key risksLASR key risks include [1] its significant revenue concentration within the U.S. Show more. |
Qualitative Assessment
AI Analysis | Feedback
nLight (LASR) stock has lost about 50% since 6/30/2026 because of the following key factors:
1. Weak Q3 2026 Guidance Driven by Supply Chain Delays.
Despite exceeding revenue and adjusted EPS estimates for fiscal Q2 2026 (ended June 30, 2026), nLight's stock significantly declined following its August 6, 2026, earnings report due to a notably soft outlook for fiscal Q3 2026. The company projected fiscal Q3 2026 Adjusted EBITDA at a midpoint of $4 million, falling substantially below analyst estimates of $7.70 million. This lower guidance was primarily attributed to an approximately $17 million shift in expected product shipments from fiscal Q3 2026 into future quarters, caused by China-related supply chain delays impacting higher-margin commercial products.
2. Significant Insider Selling Prior to and During the Downturn.
Before the Q2 2026 earnings announcement and the subsequent stock price drop, nLight's CEO, CFO, and Chief Accounting Officer collectively sold shares totaling $25.08 million between May 15 and June 4, 2026. These transactions occurred at prices ranging from $68.48 to $81.06, which were significantly above the stock's price after the Q2 guidance. Furthermore, in mid-September 2026, the CEO executed additional sales exceeding $16.5 million. These substantial insider sales, totaling over $41 million, signaled a lack of executive confidence ahead of the public disclosure of material negative information regarding future performance.
Show more
nLight (LASR) stock has lost about 50% since 6/30/2026 because of the following key factors:
1. Weak Q3 2026 Guidance Driven by Supply Chain Delays.
Despite exceeding revenue and adjusted EPS estimates for fiscal Q2 2026 (ended June 30, 2026), nLight's stock significantly declined following its August 6, 2026, earnings report due to a notably soft outlook for fiscal Q3 2026. The company projected fiscal Q3 2026 Adjusted EBITDA at a midpoint of $4 million, falling substantially below analyst estimates of $7.70 million. This lower guidance was primarily attributed to an approximately $17 million shift in expected product shipments from fiscal Q3 2026 into future quarters, caused by China-related supply chain delays impacting higher-margin commercial products.
2. Significant Insider Selling Prior to and During the Downturn.
Before the Q2 2026 earnings announcement and the subsequent stock price drop, nLight's CEO, CFO, and Chief Accounting Officer collectively sold shares totaling $25.08 million between May 15 and June 4, 2026. These transactions occurred at prices ranging from $68.48 to $81.06, which were significantly above the stock's price after the Q2 guidance. Furthermore, in mid-September 2026, the CEO executed additional sales exceeding $16.5 million. These substantial insider sales, totaling over $41 million, signaled a lack of executive confidence ahead of the public disclosure of material negative information regarding future performance.
3. Analyst Concerns Regarding Market Positioning and Valuation.
Analysts expressed apprehension regarding nLight's strategic shift and valuation, with one firm downgrading the stock to "sell" in July 2026. Concerns centered on the company's evolving role from a prime contractor to a component supplier, which could expose it to increased price competition and erode its strategic advantage. The company's decision to exit industrial markets, which was expected to remove $25-$30 million in revenue in 2026, also heightened its dependence on the more volatile aerospace and defense sector. These factors contributed to a perception of overvaluation, with the stock trading around 12x-14x forward sales, above its industry peers.
Show less
Stock Movement Drivers
Fundamental Drivers
The -50.0% change in LASR stock from 6/30/2026 to 10/19/2026 was primarily driven by a -50.9% change in the company's P/S Multiple.| (LTM values as of) | 6302026 | 10192026 | Change |
|---|---|---|---|
| Stock Price ($) | 69.62 | 34.79 | -50.0% |
| Change Contribution By: | |||
| Total Revenues ($ Mil) | 290 | 311 | 7.2% |
| P/S Multiple | 13.0 | 6.4 | -50.9% |
| Shares Outstanding (Mil) | 54 | 57 | -5.0% |
| Cumulative Contribution | -50.0% |
Market Drivers
6/30/2026 to 10/19/2026| Return | Correlation | |
|---|---|---|
| LASR | -50.0% | |
| Market (SPY) | 2.6% | 37.9% |
| Sector (XLK) | -2.4% | 57.1% |
Fundamental Drivers
The -39.0% change in LASR stock from 3/31/2026 to 10/19/2026 was primarily driven by a -42.6% change in the company's P/S Multiple.| (LTM values as of) | 3312026 | 10192026 | Change |
|---|---|---|---|
| Stock Price ($) | 57.02 | 34.79 | -39.0% |
| Change Contribution By: | |||
| Total Revenues ($ Mil) | 261 | 311 | 18.9% |
| P/S Multiple | 11.1 | 6.4 | -42.6% |
| Shares Outstanding (Mil) | 51 | 57 | -10.6% |
| Cumulative Contribution | -39.0% |
Market Drivers
3/31/2026 to 10/19/2026| Return | Correlation | |
|---|---|---|
| LASR | -39.0% | |
| Market (SPY) | 18.2% | 42.3% |
| Sector (XLK) | 40.1% | 54.8% |
Fundamental Drivers
The 17.4% change in LASR stock from 9/30/2025 to 10/19/2026 was primarily driven by a 43.2% change in the company's Total Revenues ($ Mil).| (LTM values as of) | 9302025 | 10192026 | Change |
|---|---|---|---|
| Stock Price ($) | 29.63 | 34.79 | 17.4% |
| Change Contribution By: | |||
| Total Revenues ($ Mil) | 217 | 311 | 43.2% |
| P/S Multiple | 6.8 | 6.4 | -5.8% |
| Shares Outstanding (Mil) | 50 | 57 | -13.0% |
| Cumulative Contribution | 17.4% |
Market Drivers
9/30/2025 to 10/19/2026| Return | Correlation | |
|---|---|---|
| LASR | 17.4% | |
| Market (SPY) | 16.0% | 47.9% |
| Sector (XLK) | 32.5% | 55.9% |
Fundamental Drivers
The 234.5% change in LASR stock from 9/30/2023 to 10/19/2026 was primarily driven by a 200.8% change in the company's P/S Multiple.| (LTM values as of) | 9302023 | 10192026 | Change |
|---|---|---|---|
| Stock Price ($) | 10.40 | 34.79 | 234.5% |
| Change Contribution By: | |||
| Total Revenues ($ Mil) | 224 | 311 | 38.6% |
| P/S Multiple | 2.1 | 6.4 | 200.8% |
| Shares Outstanding (Mil) | 46 | 57 | -19.8% |
| Cumulative Contribution | 234.5% |
Market Drivers
9/30/2023 to 10/19/2026| Return | Correlation | |
|---|---|---|
| LASR | 234.5% | |
| Market (SPY) | 85.5% | 44.2% |
| Sector (XLK) | 130.9% | 48.6% |
Price Returns Compared
| 2021 | 2022 | 2023 | 2024 | 2025 | 2026 | Total [1] | |
|---|---|---|---|---|---|---|---|
| Returns | |||||||
| LASR Return | -27% | -58% | 33% | -22% | 258% | -10% | 3% |
| Peers Return | 29% | -7% | 33% | 18% | 15% | 12% | 143% |
| S&P 500 Return | 27% | -19% | 24% | 23% | 16% | 12% | 104% |
Monthly Win Rates [3] | |||||||
| LASR Win Rate | 25% | 42% | 42% | 33% | 75% | 50% | |
| Peers Win Rate | 57% | 43% | 58% | 50% | 53% | 46% | |
| S&P 500 Win Rate | 75% | 42% | 67% | 75% | 67% | 50% | |
Max Drawdowns [4] | |||||||
| LASR Max Drawdown | -48% | -64% | -48% | -33% | -47% | -60% | |
| Peers Max Drawdown | -24% | -38% | -33% | -33% | -41% | -36% | |
| S&P 500 Max Drawdown | -5% | -25% | -10% | -8% | -19% | -9% | |
[1] Cumulative total returns since the beginning of 2021
[2] Peers: QCOM, FSLR, SLAB, POWI, AVGO. See LASR Returns vs. Peers.
[3] Win Rate = % of calendar months in which monthly returns were positive
[4] Max drawdown represents maximum peak-to-trough decline within a year
[5] 2026 data is for the year up to 10/19/2026 (YTD)
How Low Can It Go
| Event | LASR | S&P 500 |
|---|---|---|
| 2025 US Tariff Shock | ||
| % Loss | -39.9% | -18.8% |
| % Gain to Breakeven | 66.5% | 23.1% |
| Time to Breakeven | 31 days | 79 days |
| Summer-Fall 2023 Five Percent Yield Shock | ||
| % Loss | -42.7% | -9.5% |
| % Gain to Breakeven | 74.5% | 10.5% |
| Time to Breakeven | 49 days | 24 days |
| 2023 SVB Regional Banking Crisis | ||
| % Loss | -31.7% | -6.7% |
| % Gain to Breakeven | 46.3% | 7.1% |
| Time to Breakeven | 9 days | 31 days |
| 2022 Inflation Shock & Fed Tightening | ||
| % Loss | -63.3% | -24.5% |
| % Gain to Breakeven | 172.5% | 32.4% |
| Time to Breakeven | 1031 days | 427 days |
| 2020 COVID-19 Crash | ||
| % Loss | -53.0% | -33.7% |
| % Gain to Breakeven | 112.9% | 50.9% |
| Time to Breakeven | 34 days | 140 days |
| Q4 2018 Fed Policy Error / Growth Scare | ||
| % Loss | -24.1% | -19.2% |
| % Gain to Breakeven | 31.7% | 23.8% |
| Time to Breakeven | 63 days | 105 days |
In The Past
nLight's stock fell -39.9% during the 2025 US Tariff Shock. Such a loss loss requires a 66.5% gain to breakeven.
Preserve Wealth
Limiting losses and compounding gains is essential to preserving wealth.
Asset Allocation
Actively managed asset allocation strategies protect wealth. Learn more.
| Event | LASR | S&P 500 |
|---|---|---|
| 2025 US Tariff Shock | ||
| % Loss | -39.9% | -18.8% |
| % Gain to Breakeven | 66.5% | 23.1% |
| Time to Breakeven | 31 days | 79 days |
| Summer-Fall 2023 Five Percent Yield Shock | ||
| % Loss | -42.7% | -9.5% |
| % Gain to Breakeven | 74.5% | 10.5% |
| Time to Breakeven | 49 days | 24 days |
| 2023 SVB Regional Banking Crisis | ||
| % Loss | -31.7% | -6.7% |
| % Gain to Breakeven | 46.3% | 7.1% |
| Time to Breakeven | 9 days | 31 days |
| 2022 Inflation Shock & Fed Tightening | ||
| % Loss | -63.3% | -24.5% |
| % Gain to Breakeven | 172.5% | 32.4% |
| Time to Breakeven | 1031 days | 427 days |
| 2020 COVID-19 Crash | ||
| % Loss | -53.0% | -33.7% |
| % Gain to Breakeven | 112.9% | 50.9% |
| Time to Breakeven | 34 days | 140 days |
| Q4 2018 Fed Policy Error / Growth Scare | ||
| % Loss | -24.1% | -19.2% |
| % Gain to Breakeven | 31.7% | 23.8% |
| Time to Breakeven | 63 days | 105 days |
In The Past
nLight's stock fell -39.9% during the 2025 US Tariff Shock. Such a loss loss requires a 66.5% gain to breakeven.
Preserve Wealth
Limiting losses and compounding gains is essential to preserving wealth.
Asset Allocation
Actively managed asset allocation strategies protect wealth. Learn more.
About nLight (LASR)
nLIGHT, Inc. (LASR) is a leading technology company that designs, manufactures, and sells advanced semiconductor and fiber lasers. These specialized lasers serve as critical components in precision and high-power applications across various industries. Beyond laser sources, nLIGHT also develops crucial complementary technologies, including fiber amplifiers and sophisticated beam combination and control systems, which are essential for optimizing and deploying high-energy laser solutions.
The company's primary product offerings leverage its expertise in both semiconductor and fiber laser technologies, tailored for demanding uses. nLIGHT targets three main market segments: industrial applications, encompassing areas like material processing; microfabrication, focusing on precision manufacturing at a microscopic scale; and the aerospace and defense sector, where its systems are vital for high-energy laser (HEL) applications and directed energy initiatives.
AI Analysis | Feedback
Here are a few analogies for nLight (LASR):
- Intel for high-power industrial and defense lasers. (Similar to how Intel provides the core processors for computers, nLight provides advanced laser components for high-tech industrial, microfabrication, and defense systems.)
- Corning for advanced laser technology. (Like Corning specializes in glass science and materials that enable various industries, nLight is a specialist in sophisticated laser components and systems for demanding applications.)
AI Analysis | Feedback
- Semiconductor and Fiber Lasers: These are core products designed for industrial, microfabrication, and aerospace and defense applications.
- Fiber Amplifiers: These systems are used to amplify light signals, particularly in high-energy laser systems.
- Beam Combination and Control Systems: These systems are essential for managing and directing high-energy laser beams, especially in directed energy applications.
AI Analysis | Feedback
nLight (LASR) primarily sells its products to other companies, serving industrial, microfabrication, and aerospace and defense sectors. Its major customers, based on its most recent annual report (2023 10-K), are:
- TRUMPF GmbH + Co. KG: A private German company that is a leading manufacturer of machine tools and lasers for industrial production.
- Dantsu Co. Ltd.: A private company based in Japan, which is a distributor of laser products and solutions.
AI Analysis | Feedback
AI Analysis | Feedback
Scott Keeney, Co-Founder and Chief Executive Officer
Scott Keeney co-founded nLight in 2000 and has served as the company's chief executive officer since its inception, also holding the position of chairman of the board of directors. Before establishing nLight, Keeney was the CEO of Aculight, which was subsequently acquired by Lockheed Martin Corporation. He also worked as a consultant with McKinsey & Company. Keeney is the founder of nConnect, a non-profit dedicated to enhancing STEM education in K-12 schools. In 2006, he was awarded the Ernst & Young Entrepreneur of the Year for Technology in the Pacific Northwest.
Joseph Corso, Chief Financial Officer
Joseph Corso joined nLight in 2020 and assumed the role of Chief Financial Officer effective March 1, 2022. Prior to his tenure at nLight, Corso served as Global Co-Head of Electronics and Industrial Technology at Stifel for over 15 years, where he provided advisory services to publicly traded companies on a variety of corporate finance and M&A transactions.
Robert Martinsen, Chief Technology Officer
Robert Martinsen is a co-founder of nLight and serves as the Chief Technology Officer. In this role, he is responsible for driving the core technology roadmap for the company's semiconductor and fiber lasers.
Chris Schechter, Chief Operating Officer
Chris Schechter joined nLight in 2022 as the Chief Operating Officer. Before joining nLight, Schechter held the position of Vice President of Operations for the Aerospace and Defense segment at Celestica. His past experience also includes roles such as VP/GM at Zodiac Seats and StandardAero, Manufacturing Integration Leader for the Parker Hannifin acquisition of Clarcor Filtration, and Director-level positions in Product Development, Operations Management, and Operational Excellence/Lean6Sigma for Axcelis Technologies.
Julie Dimmick, Vice President and General Counsel
Julie Dimmick joined nLight in 2021, serving as a Vice President and the company's General Counsel. Before her time at nLight, Dimmick held positions as senior counsel at AeroVironment, Inc., and general counsel at GE Homeland Protection, Inc. She also served as a special advisor to Secretary Tom Ridge at the U.S. Department of Homeland Security.
AI Analysis | Feedback
Here are the key risks to nLight's business:
- Persistent Unprofitability and High Financial Leverage: nLight has a history of negative GAAP profitability and operating margins, along with elevated net debt to EBITDA. While the company achieved positive Adjusted EBITDA in 2025, a clear and consistent path to positive net earnings and sustainable operating cash flow remains a significant concern for investors. This financial condition, coupled with high valuation multiples based on future expectations, means the stock is highly sensitive to any slowdown in growth or continued losses.
- Customer Concentration and Aerospace & Defense Program Risk: A substantial portion of nLight's recent revenue growth is driven by a small number of large customers and specific Aerospace & Defense (A&D) program awards. Any delays in these defense programs, changes in government budgets, or the loss of a key customer relationship could have a material adverse effect on the company's revenue and margins.
- Intense Competition and Market Volatility: nLight operates in highly competitive markets for its semiconductor and fiber laser products, facing significant price and technological competition from both established players and those offering conventional or non-laser solutions. This competitive landscape, combined with potentially uneven industrial demand and the risk of average selling price (ASP) pressure, could negatively impact the company's growth and profitability.
AI Analysis | Feedback
AI Analysis | Feedback
nLight (LASR) operates in several addressable markets for its semiconductor and fiber lasers, primarily focusing on industrial, microfabrication, and aerospace and defense applications. The company has made a strategic shift to focus increasingly on the defense sector.
The addressable markets for nLight's main products and services are as follows:
- Global Industrial Lasers Market: This market, which includes applications like macro processing, micro processing, and marking/engraving, was valued at approximately USD 23.9 billion in 2025. It is projected to grow to USD 70.02 billion by 2034, demonstrating a Compound Annual Growth Rate (CAGR) of 12.70% during the forecast period. Asia Pacific held the largest share of this market, at 49.00% in 2025. Another estimate for the global industrial laser systems market indicated a value of USD 6.2 billion in 2025, with a forecast to reach USD 10.5 billion by 2035, growing at a CAGR of 5.5%. The U.S. industrial laser systems market specifically was valued at USD 5 billion in 2025.
- Global Industrial Pulsed Fiber Laser Market: This segment was estimated to be worth USD 1.65 billion in 2024 and is projected to expand to USD 4.91 billion by 2035, with a CAGR of 10.42% between 2025 and 2035. North America is expected to generate the highest demand in this market.
- Global Military Laser Weapon Market: This market is projected to reach USD 1.079 billion by 2032. nLight's aerospace and defense segment, which includes high-energy laser systems for directed energy applications, saw revenue of USD 175 million in 2025, marking a 60% annual increase. This segment constituted 67% of nLight's total revenue in 2025.
AI Analysis | Feedback
Expected Drivers of Future Revenue Growth for nLight (LASR)
-
Accelerated Growth in the Aerospace and Defense (A&D) Market: nLight anticipates continued robust growth in its Aerospace and Defense segment, driven by increasing demand for directed energy and laser sensing applications. The company has reported significant year-over-year revenue increases in A&D and is actively executing on substantial contracts, such as the $171 million HELSI-2 program targeting a one-megawatt high-energy laser, with completion anticipated in late 2026. Furthermore, new contract wins in laser sensing markets are expected to contribute to this growth.
-
Launch and Commercialization of New, High-Power Laser Systems: The development and demonstration of advanced laser weapon systems, such as the new 70kW-class Laser Weapon System, along with 10kW and 30kW High-Energy Lasers, are key drivers for future revenue. These products are designed for critical applications like counter-drone and counter-missile missions, catering to rising military demand.
-
Strategic Reallocation of Resources to High-Growth, High-Margin Applications: nLight's decision to exit the lower-margin industrial cutting and welding markets, while creating a near-term revenue headwind of approximately $25 million to $30 million in 2026, is a strategic move to focus resources on more lucrative Aerospace & Defense and advanced manufacturing segments. This pivot is expected to significantly boost overall gross margins and channel investment into areas with higher growth potential.
-
Expansion of Manufacturing Capacity: To support the anticipated ramp-up in directed energy products and meet increasing demand from U.S. Department of Defense programs and allied customers, nLight is expanding its manufacturing capacity, including its facility in Longmont, Colorado. This expansion is crucial for scaling deliveries of high-energy lasers and components, thereby enabling future revenue growth.
AI Analysis | Feedback
Share Repurchases
- nLight has engaged in share buybacks over the past decade, though specific dollar amounts or future authorizations for the 2021-2025 period were not detailed in the provided information.
Share Issuance
- In February 2026, nLight completed an underwritten public offering of common stock, raising approximately $175 million in gross proceeds.
- The underwriters fully exercised their option, generating an additional $26 million and bringing the total gross proceeds from the February 2026 offering to approximately $201 million.
- The net proceeds from this equity raise, totaling over $190 million, are earmarked for manufacturing expansion, product development, and potential acquisitions, particularly for a new 50,000 sq. ft. manufacturing facility in Colorado.
Capital Expenditures
- Capital expenditures for the latest twelve months were $10.063 million.
- From fiscal years ending December 2020 to 2024, nLight's capital expenditures averaged $15.478 million, with a peak of $23.416 million in 2020 and a low of $5.339 million in 2023.
- The company is actively investing in infrastructure, including a new 50,000 square-foot manufacturing facility in Longmont, Colorado, to expand production capabilities for high-energy lasers for defense applications.
Peer Outperformance in Semiconductors
| Ticker | Name | Rev Growth 3Y Avg | P/E | 1Y | 3Y | 5Y | 5Y Gap |
|---|---|---|---|---|---|---|---|
| LASR | nLight | 13.7% | -158.9x | 15.6% | 287.0% | 28.4% | — |
| PENG | Penguin Solutions | 9.8% | 29.8x | 160.1% | 319.1% | 117.7% | +89pp |
| SMTC | Semtech | 13.2% | 86.1x | 109.8% | 762.5% | 81.1% | +53pp |
| Industry | Names | 1Y med | 3Y med | 5Y med | Top 3 by 5Y |
|---|---|---|---|---|---|
| Electronic Manufacturing Services | 10 | 37.7% | 143.5% | 239.0% | TTMI 632% · FLEX 525% · JBL 364% |
| Technology Distributors | 9 | 43.5% | 88.5% | 82.2% | AVT 173% · SNX 146% · CNXN 109% |
| Semiconductor Materials & Equipment | 27 | 59.0% | 72.3% | 78.1% | AXTI 568% · KLAC 426% · LRCX 402% |
| Communications Equipment | 36 | 4.0% | 107.5% | 63.8% | AAOI 954% · LITE 879% · ANET 651% |
| Electronic Components | 26 | 0.8% | 74.3% | 51.8% | CLS 3186% · BELFA 1198% · APH 331% |
| Semiconductors ← | 54 | 8.4% | 41.8% | 28.3% | MU 1272% · NVDA 878% · AVGO 616% |
| Technology Hardware, Storage & Peripherals | 21 | 16.1% | 79.5% | 18.2% | STX 839% · SMCI 811% · DELL 797% |
| Electronic Equipment & Instruments | 27 | -15.9% | 23.1% | -1.4% | PI 224% · OSIS 105% · KEYS 92% |
| Internet Services & Infrastructure | 6 | 0.0% | 46.6% | -4.8% | GDDY 53% · VRSN 45% · DOCN 10% |
| IT Consulting & Other Services | 28 | -27.1% | -2.7% | -20.9% | CHRN 393847% · APLD 435% · ADEA 148% |
| Application Software | 126 | -20.3% | -12.7% | -48.2% | PLTR 686% · FROG 157% · AGYS 111% |
| Systems Software | 69 | -15.0% | 22.0% | -50.5% | ZETA 293% · CRWD 223% · FTNT 158% |
Latest Trefis Analyses
Research & Analysis
Invest in Strategies
Wealth Management
Peer Comparisons
| Peers to compare with: |
Financials
| Median | |
|---|---|
| Name | |
| Mkt Price | 172.84 |
| Mkt Cap | 12.9 |
| Rev LTM | 3,117 |
| Op Inc LTM | 916 |
| FCF LTM | 790 |
| FCF 3Y Avg | 92 |
| CFO LTM | 1,127 |
| CFO 3Y Avg | 653 |
Growth & Margins
| Median | |
|---|---|
| Name | |
| Rev Chg LTM | 22.8% |
| Rev Chg 3Y Avg | 9.3% |
| Rev Chg Q | 10.5% |
| QoQ Delta Rev Chg LTM | 2.5% |
| Op Inc Chg LTM | 47.3% |
| Op Inc Chg 3Y Avg | 12.8% |
| Op Mgn LTM | 14.0% |
| Op Mgn 3Y Avg | 15.2% |
| QoQ Delta Op Mgn LTM | 1.8% |
| CFO/Rev LTM | 25.0% |
| CFO/Rev 3Y Avg | 23.7% |
| FCF/Rev LTM | 20.6% |
| FCF/Rev 3Y Avg | 10.1% |
Price Behavior
| Market Price | $34.79 | |
| Market Cap ($ Bil) | 2.0 | |
| First Trading Date | 04/26/2018 | |
| Distance from 52W High | -59.0% | |
| 50 Days | 200 Days | |
| DMA Price | $41.90 | $57.83 |
| DMA Trend | down | indeterminate |
| Distance from DMA | -17.0% | -39.8% |
| 3M | 1YR | |
| Volatility | 81.2% | 87.2% |
| Downside Capture | 462.28 | 371.82 |
| Upside Capture | -36.96 | 320.25 |
| Correlation (S&P 500) | 36.5% | 46.9% |
| 1M | 2M | 3M | 6M | 1Y | 3Y | |
|---|---|---|---|---|---|---|
| Beta | 1.80 | 1.84 | 3.32 | 3.05 | 3.21 | 2.11 |
| Up Beta | 2.75 | 4.28 | 6.77 | 3.81 | 3.16 | 2.01 |
| Down Beta | 4.92 | 1.90 | 0.35 | 1.72 | 2.46 | 2.03 |
| Up Capture | 96% | -92% | 113% | 268% | 1186% | 2907% |
| Bmk +ve Days | 6 | 16 | 27 | 66 | 132 | 424 |
| Stock +ve Days | 7 | 16 | 24 | 55 | 128 | 374 |
| Down Capture | 226% | 384% | 363% | 280% | 181% | 112% |
| Bmk -ve Days | 16 | 26 | 37 | 60 | 120 | 328 |
| Stock -ve Days | 15 | 26 | 40 | 71 | 124 | 371 |
[1] Upside and downside betas calculated using positive and negative benchmark daily returns respectively
Based On 1-Year Data
| Annualized Return | Annualized Volatility | Sharpe Ratio | Correlation with LASR | |
|---|---|---|---|---|
| LASR | 9.8% | 87.2% | 0.49 | - |
| Sector ETF (XLK) | 31.4% | 26.4% | 0.99 | 55.0% |
| Equity (SPY) | 17.1% | 12.7% | 0.95 | 46.5% |
| Gold (GLD) | -4.2% | 29.3% | -0.15 | 23.4% |
| Commodities (DBC) | 52.6% | 20.7% | 1.93 | -0.9% |
| Real Estate (VNQ) | 3.9% | 13.7% | 0.03 | 9.5% |
| Bitcoin (BTCUSD) | -24.8% | 43.7% | -0.53 | 27.8% |
Smart multi-asset allocation framework can stack odds in your favor. Learn How
Based On 5-Year Data
| Annualized Return | Annualized Volatility | Sharpe Ratio | Correlation with LASR | |
|---|---|---|---|---|
| LASR | 7.1% | 68.7% | 0.38 | - |
| Sector ETF (XLK) | 20.6% | 26.0% | 0.70 | 50.4% |
| Equity (SPY) | 13.5% | 17.1% | 0.60 | 47.2% |
| Gold (GLD) | 18.3% | 18.9% | 0.78 | 13.0% |
| Commodities (DBC) | 9.8% | 19.5% | 0.38 | 8.1% |
| Real Estate (VNQ) | 1.3% | 18.8% | -0.04 | 28.3% |
| Bitcoin (BTCUSD) | 7.2% | 51.8% | 0.32 | 24.5% |
Smart multi-asset allocation framework can stack odds in your favor. Learn How
Based On 10-Year Data
| Annualized Return | Annualized Volatility | Sharpe Ratio | Correlation with LASR | |
|---|---|---|---|---|
| LASR | 2.9% | 67.7% | 0.34 | - |
| Sector ETF (XLK) | 24.1% | 25.0% | 0.87 | 49.0% |
| Equity (SPY) | 15.3% | 17.9% | 0.72 | 46.2% |
| Gold (GLD) | 12.2% | 16.4% | 0.61 | 9.0% |
| Commodities (DBC) | 8.3% | 18.1% | 0.37 | 12.1% |
| Real Estate (VNQ) | 5.1% | 20.7% | 0.21 | 29.1% |
| Bitcoin (BTCUSD) | 63.0% | 66.2% | 1.03 | 19.1% |
Smart multi-asset allocation framework can stack odds in your favor. Learn How
Earnings Returns History
Updated 9/9/2026| Forward Returns | |||
|---|---|---|---|
| Earnings Date | 1D Returns | 5D Returns | 21D Returns |
| 8/6/2026 | -25.6% | -33.3% | -46.9% |
| 5/7/2026 | 11.7% | 22.9% | 0.9% |
| 2/26/2026 | -10.7% | -0.6% | 2.2% |
| 11/6/2025 | 14.7% | 1.9% | 27.2% |
| 8/7/2025 | 27.7% | 28.2% | 39.2% |
| 5/8/2025 | 35.5% | 48.3% | 104.8% |
| 1/14/2025 | -10.9% | 4.3% | -6.5% |
| 11/7/2024 | -23.5% | -28.5% | -24.2% |
| ... | |||
| SUMMARY STATS | |||
| # Positive | 9 | 10 | 12 |
| # Negative | 13 | 12 | 10 |
| Median Positive | 14.7% | 15.6% | 18.6% |
| Median Negative | -10.7% | -11.4% | -12.9% |
| Max Positive | 38.1% | 48.3% | 104.8% |
| Max Negative | -25.6% | -33.3% | -46.9% |
| Forward Returns | |||
|---|---|---|---|
| Earnings Date | 1D Returns | 5D Returns | 21D Returns |
| 8/6/2026 | -25.6% | -33.3% | -46.9% |
| 5/7/2026 | 11.7% | 22.9% | 0.9% |
| 2/26/2026 | -10.7% | -0.6% | 2.2% |
| 11/6/2025 | 14.7% | 1.9% | 27.2% |
| 8/7/2025 | 27.7% | 28.2% | 39.2% |
| 5/8/2025 | 35.5% | 48.3% | 104.8% |
| 1/14/2025 | -10.9% | 4.3% | -6.5% |
| 11/7/2024 | -23.5% | -28.5% | -24.2% |
| 8/1/2024 | -2.9% | -3.2% | 6.4% |
| 5/2/2024 | 5.0% | 15.6% | 9.4% |
| 11/2/2023 | 5.5% | 15.6% | 56.1% |
| 5/4/2023 | 38.1% | 31.9% | 51.4% |
| 2/23/2023 | -11.9% | -8.6% | -23.9% |
| 11/3/2022 | -11.0% | -0.5% | 1.7% |
| 8/4/2022 | -2.7% | -2.1% | -11.5% |
| 5/5/2022 | -4.0% | -17.5% | -5.7% |
| 2/17/2022 | -19.1% | -18.6% | -6.6% |
| 11/4/2021 | -6.5% | -14.2% | -22.4% |
| 8/5/2021 | -6.2% | -14.7% | -11.3% |
| 5/6/2021 | 3.8% | -1.3% | 9.9% |
| 2/17/2021 | -1.5% | 0.5% | -14.4% |
| 11/5/2020 | 24.8% | 11.6% | 39.8% |
| SUMMARY STATS | |||
| # Positive | 9 | 10 | 12 |
| # Negative | 13 | 12 | 10 |
| Median Positive | 14.7% | 15.6% | 18.6% |
| Median Negative | -10.7% | -11.4% | -12.9% |
| Max Positive | 38.1% | 48.3% | 104.8% |
| Max Negative | -25.6% | -33.3% | -46.9% |
SEC Filings
Expand for More| Report Date | Filing Date | Filing |
|---|---|---|
| 06/30/2026 | 08/07/2026 | 10-Q |
| 03/31/2026 | 05/08/2026 | 10-Q |
| 12/31/2025 | 02/27/2026 | 10-K |
| 09/30/2025 | 11/07/2025 | 10-Q |
| 06/30/2025 | 08/08/2025 | 10-Q |
| 03/31/2025 | 05/09/2025 | 10-Q |
| 12/31/2024 | 02/28/2025 | 10-K |
| 09/30/2024 | 11/08/2024 | 10-Q |
| 06/30/2024 | 08/02/2024 | 10-Q |
| 03/31/2024 | 05/03/2024 | 10-Q |
| 12/31/2023 | 02/26/2024 | 10-K |
| 09/30/2023 | 11/03/2023 | 10-Q |
| 06/30/2023 | 08/04/2023 | 10-Q |
| 03/31/2023 | 05/05/2023 | 10-Q |
| 12/31/2022 | 02/27/2023 | 10-K |
| 09/30/2022 | 11/07/2022 | 10-Q |
| Report Date | Filing Date | Filing |
|---|---|---|
| 06/30/2026 | 08/07/2026 | 10-Q |
| 03/31/2026 | 05/08/2026 | 10-Q |
| 12/31/2025 | 02/27/2026 | 10-K |
| 09/30/2025 | 11/07/2025 | 10-Q |
| 06/30/2025 | 08/08/2025 | 10-Q |
| 03/31/2025 | 05/09/2025 | 10-Q |
| 12/31/2024 | 02/28/2025 | 10-K |
| 09/30/2024 | 11/08/2024 | 10-Q |
| 06/30/2024 | 08/02/2024 | 10-Q |
| 03/31/2024 | 05/03/2024 | 10-Q |
| 12/31/2023 | 02/26/2024 | 10-K |
| 09/30/2023 | 11/03/2023 | 10-Q |
| 06/30/2023 | 08/04/2023 | 10-Q |
| 03/31/2023 | 05/05/2023 | 10-Q |
| 12/31/2022 | 02/27/2023 | 10-K |
| 09/30/2022 | 11/07/2022 | 10-Q |
| 06/30/2022 | 08/05/2022 | 10-Q |
| 03/31/2022 | 05/06/2022 | 10-Q |
| 12/31/2021 | 02/28/2022 | 10-K |
| 09/30/2021 | 11/05/2021 | 10-Q |
| 06/30/2021 | 08/06/2021 | 10-Q |
| 03/31/2021 | 05/07/2021 | 10-Q |
| 12/31/2020 | 02/26/2021 | 10-K |
| 09/30/2020 | 11/06/2020 | 10-Q |
| 06/30/2020 | 08/06/2020 | 10-Q |
| 03/31/2020 | 05/07/2020 | 10-Q |
| 12/31/2019 | 03/09/2020 | 10-K |
| 09/30/2019 | 11/06/2019 | 10-Q |
Recent Forward Guidance
Updated 10/4/2026Latest: Q2 2026 Earnings Reported 8/6/2026
| Forward Guidance | Guidance Change | |||||||
|---|---|---|---|---|---|---|---|---|
| Metric | Source | Low | Mid | High | % Chg | % Delta | Change | Prior |
| Q3 2026 Revenue | Reported | 63.00 Mil | 68.00 Mil | 73.00 Mil | -12.8% | Lower New | Guidance: 78.00 Mil for Q2 2026 | |
| Q3 2026 Products Revenue | Reported | 43.00 Mil | -25.9% | Lower New | Guidance: 58.00 Mil for Q2 2026 | |||
| Q3 2026 Advanced Development Revenue | Reported | 25.00 Mil | 25.0% | Higher New | Guidance: 20.00 Mil for Q2 2026 | |||
| Q3 2026 Gross Profit | Calculated | 15.12 Mil | 18.36 Mil | 21.90 Mil | Rev x Gross Margin | |||
| Q3 2026 Gross Margin | Reported | 24.0% | 27.0% | 30.0% | -4.0% | Lower New | Guidance: 31.0% for Q2 2026 | |
| Q3 2026 Products Gross Margin | Reported | 34.0% | 37.0% | 40.0% | -2.0% | Lower New | Guidance: 39.0% for Q2 2026 | |
| Q3 2026 Advanced Development Gross Margin | Reported | 8.0% | 0 | Same New | Guidance: 8.0% for Q2 2026 | |||
| Q3 2026 Adjusted EBITDA | Reported | 1.00 Mil | 4.00 Mil | 7.00 Mil | -60.0% | Lower New | Guidance: 10.00 Mil for Q2 2026 | |
Prior: Q1 2026 Earnings Reported 5/7/2026
| Forward Guidance | Guidance Change | |||||||
|---|---|---|---|---|---|---|---|---|
| Metric | Source | Low | Mid | High | % Chg | % Delta | Change | Prior |
| Q2 2026 Revenue | Reported | 75.00 Mil | 78.00 Mil | 81.00 Mil | 6.8% | Higher New | Guidance: 73.00 Mil for Q1 2026 | |
| Q2 2026 Products Revenue | Reported | 58.00 Mil | 7.4% | Higher New | Guidance: 54.00 Mil for Q1 2026 | |||
| Q2 2026 Advanced Development Revenue | Reported | 20.00 Mil | 5.3% | Higher New | Guidance: 19.00 Mil for Q1 2026 | |||
| Q2 2026 Gross Profit | Calculated | 21.75 Mil | 24.18 Mil | 26.73 Mil | Rev x Gross Margin | |||
| Q2 2026 Gross Margin | Reported | 29.0% | 31.0% | 33.0% | 1.5% | Higher New | Guidance: 29.5% for Q1 2026 | |
| Q2 2026 Products Gross Margin | Reported | 37.0% | 39.0% | 41.0% | 2.5% | Higher New | Guidance: 36.5% for Q1 2026 | |
| Q2 2026 Advanced Development Gross Margin | Reported | 8.0% | 0.0% | Same New | Guidance: 8.0% for Q1 2026 | |||
| Q2 2026 Adjusted EBITDA | Reported | 8.00 Mil | 10.00 Mil | 12.00 Mil | 33.3% | Higher New | Guidance: 7.50 Mil for Q1 2026 | |
Q4 2025 Earnings Reported 2/26/2026
| Forward Guidance | Guidance Change | |||||||
|---|---|---|---|---|---|---|---|---|
| Metric | Source | Low | Mid | High | % Chg | % Delta | Change | Prior |
| Q1 2026 Revenue | Reported | 70.00 Mil | 73.00 Mil | 76.00 Mil | -2.7% | Lower New | Guidance: 75.00 Mil for Q4 2025 | |
| Q1 2026 Laser Products Revenue | Reported | 54.00 Mil | -1.8% | Lower New | Guidance: 55.00 Mil for Q4 2025 | |||
| Q1 2026 Advanced Development Revenue | Reported | 19.00 Mil | -5.0% | Lower New | Guidance: 20.00 Mil for Q4 2025 | |||
| Q1 2026 Gross Profit | Calculated | 18.90 Mil | 21.54 Mil | 24.32 Mil | Rev x Gross Margin | |||
| Q1 2026 Gross Margin | Reported | 27.0% | 29.5% | 32.0% | 0 | Same New | Guidance: 29.5% for Q4 2025 | |
| Q1 2026 Laser Products Gross Margin | Reported | 34.0% | 36.5% | 39.0% | 0 | Same New | Guidance: 36.5% for Q4 2025 | |
| Q1 2026 Advanced Development Gross Margin | Reported | 8.0% | 0 | Same New | Guidance: 8.0% for Q4 2025 | |||
| Q1 2026 Adjusted EBITDA | Reported | 5.00 Mil | 7.50 Mil | 10.00 Mil | -11.8% | Lower New | Guidance: 8.50 Mil for Q4 2025 | |
Q3 2025 Earnings Reported 11/6/2025
| Forward Guidance | Guidance Change | |||||||
|---|---|---|---|---|---|---|---|---|
| Metric | Source | Low | Mid | High | % Chg | % Delta | Change | Prior |
| Q4 2025 Revenue | Reported | 72.00 Mil | 75.00 Mil | 78.00 Mil | 16.3% | Higher New | Actual: 64.50 Mil for Q3 2025 | |
| Q4 2025 Products Revenue | Reported | 55.00 Mil | 22.2% | Higher New | Actual: 45.00 Mil for Q3 2025 | |||
| Q4 2025 Advanced Development Revenue | Reported | 20.00 Mil | 5.3% | Higher New | Actual: 19.00 Mil for Q3 2025 | |||
| Q4 2025 Gross Profit | Calculated | 19.44 Mil | 22.12 Mil | 24.96 Mil | Rev x Gross Margin | |||
| Q4 2025 Gross Margin | Reported | 27.0% | 29.5% | 32.0% | 2.5% | Higher New | Actual: 27.0% for Q3 2025 | |
| Q4 2025 Products Gross Margin | Reported | 34.0% | 36.5% | 39.0% | 2.5% | Higher New | Actual: 34.0% for Q3 2025 | |
| Q4 2025 Advanced Development Gross Margin | Reported | 8.0% | 0.0% | Same New | Actual: 8.0% for Q3 2025 | |||
| Q4 2025 Adjusted EBITDA | Reported | 6.00 Mil | 8.50 Mil | 11.00 Mil | 112.5% | Higher New | Actual: 4.00 Mil for Q3 2025 | |
| 2025 A&D Revenue Growth | Reported | 40.0% | 0.0% | Raised | Guidance: 40.0% for 2025 | |||
Insider Activity
Updated 10/19/2026| # | Owner | Title | Holding | Action | Filing Date | Price | Shares | Transacted Value | Value of Held Shares | Form |
|---|---|---|---|---|---|---|---|---|---|---|
| 1 | Moore, Geoffrey | Direct | Sell | 10192026 | 34.57 | 4,452 | 153,906 | 2,809,331 | Form | |
| 2 | Moore, Geoffrey | Direct | Sell | 9172026 | 38.45 | 4,452 | 171,179 | 3,295,819 | Form | |
| 3 | Keeney, Scott H | President and CEO | Direct | Sell | 9102026 | 41.01 | 100,000 | 4,101,000 | 80,380,994 | Form |
| 4 | Keeney, Scott H | President and CEO | Direct | Sell | 9102026 | 41.32 | 115,252 | 4,761,677 | 85,111,030 | Form |
| 5 | Corso, Joseph John | Chief Financial Officer | Direct | Sell | 9082026 | 41.49 | 3,524 | 146,211 | 6,729,678 | Form |
| # | Owner | Title | Holding | Action | Filing Date | Price | Shares | Transacted Value | Value of Held Shares | Form |
|---|---|---|---|---|---|---|---|---|---|---|
| 1 | Moore, Geoffrey | Direct | Sell | 10192026 | 34.57 | 4,452 | 153,906 | 2,809,331 | Form | |
| 2 | Moore, Geoffrey | Direct | Sell | 9172026 | 38.45 | 4,452 | 171,179 | 3,295,819 | Form | |
| 3 | Keeney, Scott H | President and CEO | Direct | Sell | 9102026 | 41.01 | 100,000 | 4,101,000 | 80,380,994 | Form |
| 4 | Keeney, Scott H | President and CEO | Direct | Sell | 9102026 | 41.32 | 115,252 | 4,761,677 | 85,111,030 | Form |
| 5 | Corso, Joseph John | Chief Financial Officer | Direct | Sell | 9082026 | 41.49 | 3,524 | 146,211 | 6,729,678 | Form |
| 6 | Corso, Joseph John | Chief Financial Officer | Direct | Sell | 9082026 | 40.69 | 4,191 | 170,532 | 6,743,310 | Form |
| 7 | Keeney, Scott H | President and CEO | Direct | Sell | 9082026 | 40.69 | 9,753 | 396,850 | 88,512,387 | Form |
| 8 | Nias, James | Chief Accounting Officer | Direct | Sell | 9082026 | 40.69 | 1,025 | 41,707 | 3,930,491 | Form |
| 9 | Gossman, William | Direct | Sell | 9012026 | 44.36 | 15,000 | 665,400 | 4,447,134 | Form | |
| 10 | Keeney, Scott H | President and CEO | Direct | Sell | 8252026 | 44.15 | 181,750 | 8,024,701 | 96,474,741 | Form |
| 11 | Keeney, Scott H | President and CEO | Direct | Sell | 8252026 | 46.88 | 181,750 | 8,519,546 | 102,423,886 | Form |
| 12 | Keeney, Scott H | President and CEO | Direct | Sell | 6052026 | 74.60 | 16,089 | 1,200,266 | 163,007,459 | Form |
| 13 | Corso, Joseph John | Chief Financial Officer | Direct | Sell | 6052026 | 72.90 | 3,817 | 278,259 | 12,386,804 | Form |
| 14 | Keeney, Scott H | President and CEO | Direct | Sell | 6052026 | 77.99 | 8,901 | 694,189 | 171,665,973 | Form |
| 15 | Nias, James | Chief Accounting Officer | Direct | Sell | 6052026 | 77.99 | 940 | 73,311 | 7,613,462 | Form |
| 16 | Corso, Joseph John | Chief Financial Officer | Direct | Sell | 6052026 | 77.99 | 3,840 | 299,482 | 13,549,359 | Form |
| 17 | Keeney, Scott H | President and CEO | Direct | Sell | 6012026 | 73.36 | 41,371 | 3,034,907 | 162,123,988 | Form |
| 18 | Keeney, Scott H | President and CEO | Direct | Sell | 6012026 | 78.64 | 41,373 | 3,253,742 | 177,059,286 | Form |
| 19 | Keeney, Scott H | President and CEO | Direct | Sell | 5212026 | 75.19 | 41,373 | 3,111,024 | 172,404,051 | Form |
| 20 | Corso, Joseph John | Chief Financial Officer | Direct | Sell | 5212026 | 70.40 | 35,476 | 2,497,586 | 12,501,448 | Form |
| 21 | Nias, James | Chief Accounting Officer | Direct | Sell | 5212026 | 71.09 | 415 | 29,502 | 7,006,701 | Form |
| 22 | Keeney, Scott H | President and CEO | Direct | Sell | 5212026 | 70.40 | 41,373 | 2,912,745 | 164,328,699 | Form |
| 23 | Corso, Joseph John | Chief Financial Officer | Direct | Sell | 5212026 | 68.48 | 20,243 | 1,386,241 | 14,589,527 | Form |
| 24 | Nias, James | Chief Accounting Officer | Direct | Sell | 5212026 | 68.48 | 1,618 | 110,801 | 6,777,876 | Form |
| 25 | Keeney, Scott H | President and CEO | Direct | Sell | 5212026 | 68.48 | 46,735 | 3,200,413 | 162,675,541 | Form |
| 26 | Corso, Joseph John | Chief Financial Officer | Direct | Sell | 5192026 | 70.82 | 19,575 | 1,386,301 | 16,521,669 | Form |
| 27 | Nias, James | Chief Accounting Officer | Direct | Sell | 5192026 | 70.82 | 1,565 | 110,833 | 7,124,067 | Form |
| 28 | Keeney, Scott H | President and CEO | Direct | Sell | 5192026 | 70.82 | 45,191 | 3,200,427 | 171,544,028 | Form |
| 29 | Corso, Joseph John | Chief Financial Officer | Direct | Sell | 5192026 | 75.16 | 18,445 | 1,386,326 | 18,974,217 | Form |
| 30 | Nias, James | Chief Accounting Officer | Direct | Sell | 5192026 | 75.16 | 1,487 | 111,763 | 7,647,079 | Form |
| 31 | Keeney, Scott H | President and CEO | Direct | Sell | 5192026 | 75.16 | 42,584 | 3,200,613 | 185,453,166 | Form |
| 32 | Link, Raymond A | Direct | Sell | 3132026 | 63.28 | 6,644 | 420,432 | 4,883,444 | Form | |
| 33 | Link, Raymond A | Direct | Sell | 3132026 | 64.42 | 8,760 | 564,319 | 5,399,427 | Form | |
| 34 | Nias, James | Chief Accounting Officer | Direct | Sell | 3132026 | 64.42 | 1,808 | 116,471 | 6,048,974 | Form |
| 35 | Link, Raymond A | Direct | Sell | 3132026 | 62.79 | 10,000 | 627,900 | 5,812,847 | Form | |
| 36 | Keeney, Scott H | President and CEO | Direct | Sell | 3112026 | 58.80 | 19,096 | 1,122,755 | 129,939,361 | Form |
| 37 | Corso, Joseph John | Chief Financial Officer | Direct | Sell | 3092026 | 60.39 | 12,290 | 742,193 | 10,320,409 | Form |
| 38 | Keeney, Scott H | President and CEO | Direct | Sell | 3092026 | 60.53 | 23,656 | 1,431,876 | 134,926,850 | Form |
| 39 | Nias, James | Chief Accounting Officer | Direct | Sell | 3092026 | 61.96 | 3,249 | 201,308 | 5,930,006 | Form |
| 40 | Corso, Joseph John | Chief Financial Officer | Direct | Sell | 3092026 | 61.96 | 13,038 | 807,834 | 11,350,205 | Form |
| 41 | Keeney, Scott H | President and CEO | Direct | Sell | 3092026 | 61.96 | 32,239 | 1,997,528 | 139,582,311 | Form |
| 42 | Keeney, Scott H | President and CEO | Direct | Sell | 1082026 | 37.51 | 31,748 | 1,190,867 | 85,711,100 | Form |
| 43 | Corso, Joseph John | Chief Financial Officer | Direct | Sell | 12172025 | 36.32 | 66,075 | 2,399,684 | 7,126,382 | Form |
| 44 | Keeney, Scott H | President and CEO | Direct | Sell | 12052025 | 35.66 | 15,371 | 548,120 | 81,482,325 | Form |
| 45 | Nias, James | Chief Accounting Officer | Direct | Sell | 12052025 | 33.78 | 556 | 18,782 | 3,342,734 | Form |
| 46 | Corso, Joseph John | Chief Financial Officer | Direct | Sell | 12052025 | 33.78 | 4,127 | 139,410 | 8,860,460 | Form |
| 47 | Keeney, Scott H | President and CEO | Direct | Sell | 12052025 | 33.78 | 9,625 | 325,132 | 77,707,208 | Form |
| 48 | Nias, James | Chief Accounting Officer | Direct | Sell | 11252025 | 30.00 | 1,200 | 36,000 | 2,985,360 | Form |
| 49 | Link, Raymond A | Direct | Sell | 11132025 | 35.33 | 12,560 | 443,745 | 3,624,010 | Form |
Investor Activity (13F)
Updated Oct 20, 2026Active managers (13F portfolio over $250M, at least 3 holdings) with a position over $5M that is either over 10% of their portfolio or held in a concentrated book of 50 or fewer total positions. Index/ETF, sovereign, bank, community-bank and charitable/donor-advised filers are excluded.
| Active Manager |
|---|
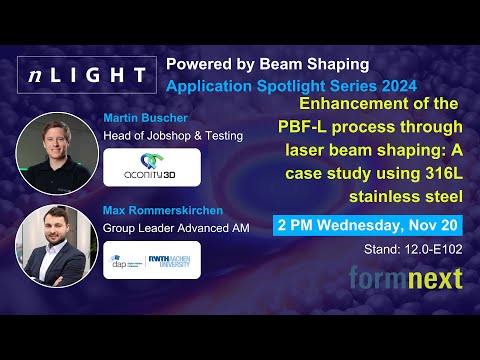
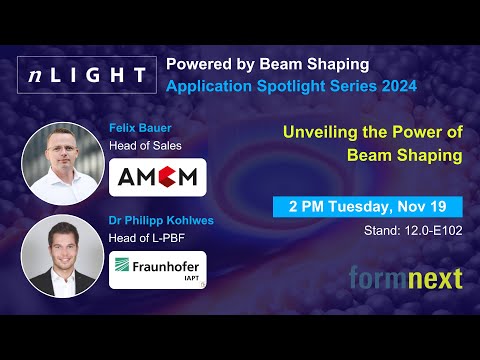
nLight — Investor Video Playlist



Industry Resources
| Information Technology Resources |
| TechCrunch |
| Wired |
| CIO |
| MIT Technology Review |
| Gartner Insights |
| Ars Technica |
| Semiconductors Resources |
| EE Times |
| Semiconductor Engineering |
| Semiconductor Digest |
External Quote Links
| Y Finance | Barrons |
| TradingView | Morningstar |
| SeekingAlpha | ValueLine |
| Motley Fool | Robinhood |
| CNBC | Etrade |
| MarketWatch | Unusual Whales |
| YCharts | Perplexity Finance |
| FinViz |
Prefer one of these to Trefis? Tell us why.