
Core Scientific (CORZ)
Market Price (11/10/2026): $12.74 | Market Cap: $4.1 BilSector: Information Technology | Industry: Systems Software
Core Scientific (CORZ)
Market Price (11/10/2026): $12.74Market Cap: $4.1 BilSector: Information TechnologyIndustry: Systems Software
Investment Highlights Why It Matters Detailed financial logic regarding cash flow yields vs trend-riding momentum.
Strong revenue growthRev Chg LTMRevenue Change % Last Twelve Months (LTM) is 77% Attractive cash flow generationCFO/Rev LTMCash Flow from Operations / Revenue (Sales), Last Twelve Months (LTM) is 77% Valuation becoming less expensiveP/S 6M Chg %Price/Sales change over 6 months. Declining P/S indicates valuation has become less expensive. is -63% Megatrend and thematic driversMegatrends include Crypto & Blockchain, Digital Infrastructure, and Sustainable Energy Solutions. Themes include Cryptocurrency Mining, Show more. | Weak multi-year price returns2Y Excs Rtn is -28% | Not profitable at operating income levelOp Inc LTMOperating Income, Last Twelve Months is -68 Mil, Op Mgn LTMOperating Margin = Operating Income / Revenue Reflects profitability before taxes and before impact of capital structure (interest payments). is -11% Debt is significantNet D/ENet Debt/Equity. Debt net of cash. Negative indicates net cash. Equity is taken as the Market Capitalization is 84% Significant share based compensationSBC/Rev LTMShare Based Compensation / Revenue (Sales), Last Twelve Months (LTM) is 15% Not cash flow generativeFCF/Rev LTMFree Cash Flow / Revenue (Sales), Last Twelve Months (LTM) is -225% Yield minus risk free rate is negativeERPEquity Risk Premium (ERP) = Total Yield - Risk Free Rate, Reflects the premium above risk free assets offered by the investment. is -8.0% Significant short interestShort Interest % of Basic SharesShort Interest % of Basic Shares = (Short Interest Quantity) / (Basic Shares Outstanding). A high fraction of short interest can indicate potential risk of a short squeeze. is 23% Short seller report Key risksCORZ key risks include [1] precarious financial health marked by significant debt and potential bankruptcy risk, Show more. |
| Strong revenue growthRev Chg LTMRevenue Change % Last Twelve Months (LTM) is 77% |
| Attractive cash flow generationCFO/Rev LTMCash Flow from Operations / Revenue (Sales), Last Twelve Months (LTM) is 77% |
| Valuation becoming less expensiveP/S 6M Chg %Price/Sales change over 6 months. Declining P/S indicates valuation has become less expensive. is -63% |
| Megatrend and thematic driversMegatrends include Crypto & Blockchain, Digital Infrastructure, and Sustainable Energy Solutions. Themes include Cryptocurrency Mining, Show more. |
| Weak multi-year price returns2Y Excs Rtn is -28% |
| Not profitable at operating income levelOp Inc LTMOperating Income, Last Twelve Months is -68 Mil, Op Mgn LTMOperating Margin = Operating Income / Revenue Reflects profitability before taxes and before impact of capital structure (interest payments). is -11% |
| Debt is significantNet D/ENet Debt/Equity. Debt net of cash. Negative indicates net cash. Equity is taken as the Market Capitalization is 84% |
| Significant share based compensationSBC/Rev LTMShare Based Compensation / Revenue (Sales), Last Twelve Months (LTM) is 15% |
| Not cash flow generativeFCF/Rev LTMFree Cash Flow / Revenue (Sales), Last Twelve Months (LTM) is -225% |
| Yield minus risk free rate is negativeERPEquity Risk Premium (ERP) = Total Yield - Risk Free Rate, Reflects the premium above risk free assets offered by the investment. is -8.0% |
| Significant short interestShort Interest % of Basic SharesShort Interest % of Basic Shares = (Short Interest Quantity) / (Basic Shares Outstanding). A high fraction of short interest can indicate potential risk of a short squeeze. is 23% |
| Short seller report |
| Key risksCORZ key risks include [1] precarious financial health marked by significant debt and potential bankruptcy risk, Show more. |
Qualitative Assessment
AI Analysis | Feedback
Core Scientific (CORZ) stock has lost about 40% since 7/31/2026 because of the following key factors:
1. High Capital Expenditures and Liquidity Drain for AI Pivot.
Core Scientific undertook substantial capital expenditures during its transition to high-density colocation services for artificial intelligence, with capital expenditures reaching $985.1 million in fiscal Q3 2026, an increase from $797.5 million in fiscal Q2 2026. This aggressive investment contributed to a significant decline in liquidity, which fell by approximately $1 billion from fiscal Q2 2026 to fiscal Q3 2026, reflecting $540 million in capital expenditures primarily related to AMD sites and $440 million for the Polaris acquisition.
2. Bitcoin Price Decline and Phased Exit from Mining.
The broader cryptocurrency market experienced a downturn since July 31, 2026, with Bitcoin's price falling below $75,000 in early November 2026 to 2.5-month lows. On November 9, 2026, Bitcoin was trading at approximately $74,549.48, representing a $30,162 fall compared to one year prior. This decline negatively impacts Core Scientific's self-mining operations, which the company plans to cease by December 31, 2026. In fiscal Q3 2026, Core Scientific sold 816 Bitcoin to fund capital spending and other cash needs.
Show more
Core Scientific (CORZ) stock has lost about 40% since 7/31/2026 because of the following key factors:
1. High Capital Expenditures and Liquidity Drain for AI Pivot.
Core Scientific undertook substantial capital expenditures during its transition to high-density colocation services for artificial intelligence, with capital expenditures reaching $985.1 million in fiscal Q3 2026, an increase from $797.5 million in fiscal Q2 2026. This aggressive investment contributed to a significant decline in liquidity, which fell by approximately $1 billion from fiscal Q2 2026 to fiscal Q3 2026, reflecting $540 million in capital expenditures primarily related to AMD sites and $440 million for the Polaris acquisition.
2. Bitcoin Price Decline and Phased Exit from Mining.
The broader cryptocurrency market experienced a downturn since July 31, 2026, with Bitcoin's price falling below $75,000 in early November 2026 to 2.5-month lows. On November 9, 2026, Bitcoin was trading at approximately $74,549.48, representing a $30,162 fall compared to one year prior. This decline negatively impacts Core Scientific's self-mining operations, which the company plans to cease by December 31, 2026. In fiscal Q3 2026, Core Scientific sold 816 Bitcoin to fund capital spending and other cash needs.
3. Analyst Price Target Reductions.
Despite reporting strong revenue growth in its colocation segment for fiscal Q3 2026, analysts lowered their price targets for Core Scientific. Macquarie, for example, reduced its price target to $25 from $38 on November 6, 2026, while maintaining an "Outperform" rating. Similarly, B. Riley Financial cut its price target for Core Scientific from $31 to $27 on November 9, 2026, though it maintained a "Buy" rating.
4. Non-Cash Earnings Dominating Net Income.
Core Scientific's reported GAAP net income of $1.18 billion in fiscal Q3 2026 was largely attributed to a $1.03 billion non-cash gain from the change in fair value of warrants. Excluding this non-cash item, the company's net income was $37.3 million. Additionally, operating cash flow for fiscal Q3 2026 was $65.3 million, less than half of the Adjusted EBITDA, partly due to rent credits that offset monthly cash payments from the CoreWeave lease during the early years of the agreement.
Show less
Stock Movement Drivers
Fundamental Drivers
The -38.6% change in CORZ stock from 7/31/2026 to 11/9/2026 was primarily driven by a -54.0% change in the company's P/S Multiple.| (LTM values as of) | 7312026 | 11092026 | Change |
|---|---|---|---|
| Stock Price ($) | 20.72 | 12.72 | -38.6% |
| Change Contribution By: | |||
| Total Revenues ($ Mil) | 440 | 592 | 34.5% |
| P/S Multiple | 15.3 | 7.0 | -54.0% |
| Shares Outstanding (Mil) | 325 | 328 | -0.7% |
| Cumulative Contribution | -38.6% |
Market Drivers
7/31/2026 to 11/9/2026| Return | Correlation | |
|---|---|---|
| CORZ | -38.6% | |
| Market (SPY) | 0.8% | 53.5% |
| Sector (XLK) | -2.5% | 65.8% |
Fundamental Drivers
The -36.4% change in CORZ stock from 4/30/2026 to 11/9/2026 was primarily driven by a -64.9% change in the company's P/S Multiple.| (LTM values as of) | 4302026 | 11092026 | Change |
|---|---|---|---|
| Stock Price ($) | 20.00 | 12.72 | -36.4% |
| Change Contribution By: | |||
| Total Revenues ($ Mil) | 319 | 592 | 85.6% |
| P/S Multiple | 20.1 | 7.0 | -64.9% |
| Shares Outstanding (Mil) | 320 | 328 | -2.3% |
| Cumulative Contribution | -36.4% |
Market Drivers
4/30/2026 to 11/9/2026| Return | Correlation | |
|---|---|---|
| CORZ | -36.4% | |
| Market (SPY) | 5.0% | 51.5% |
| Sector (XLK) | 7.3% | 65.8% |
Fundamental Drivers
The -40.9% change in CORZ stock from 10/31/2025 to 11/9/2026 was primarily driven by a -65.7% change in the company's P/S Multiple.| (LTM values as of) | 10312025 | 11092026 | Change |
|---|---|---|---|
| Stock Price ($) | 21.54 | 12.72 | -40.9% |
| Change Contribution By: | |||
| Total Revenues ($ Mil) | 334 | 592 | 77.2% |
| P/S Multiple | 20.5 | 7.0 | -65.7% |
| Shares Outstanding (Mil) | 319 | 328 | -2.8% |
| Cumulative Contribution | -40.9% |
Market Drivers
10/31/2025 to 11/9/2026| Return | Correlation | |
|---|---|---|
| CORZ | -40.9% | |
| Market (SPY) | 11.3% | 52.4% |
| Sector (XLK) | 14.1% | 65.1% |
Fundamental Drivers
nullnull
Market Drivers
10/31/2023 to 11/9/2026| Return | Correlation | |
|---|---|---|
| CORZ | ||
| Market (SPY) | 86.2% | 44.6% |
| Sector (XLK) | 112.1% | 49.9% |
Price Returns Compared
| 2021 | 2022 | 2023 | 2024 | 2025 | 2026 | Total [1] | |
|---|---|---|---|---|---|---|---|
| Returns | |||||||
| CORZ Return | - | - | - | 308% | 4% | -13% | 270% |
| Peers Return | 31% | -85% | 410% | -3% | 66% | -10% | 45% |
| S&P 500 Return | 27% | -19% | 24% | 23% | 16% | 8% | 96% |
Monthly Win Rates [3] | |||||||
| CORZ Win Rate | - | - | - | 67% | 50% | 27% | |
| Peers Win Rate | 44% | 33% | 73% | 45% | 67% | 44% | |
| S&P 500 Win Rate | 75% | 42% | 67% | 75% | 67% | 36% | |
Max Drawdowns [4] | |||||||
| CORZ Max Drawdown | - | - | - | - | -61% | -61% | |
| Peers Max Drawdown | -71% | -89% | -57% | -61% | -60% | -67% | |
| S&P 500 Max Drawdown | -5% | -25% | -10% | -8% | -19% | -9% | |
[1] Cumulative total returns since the beginning of 2021
[2] Peers: RIOT, HUT, CLSK, CIFR, MARA.
[3] Win Rate = % of calendar months in which monthly returns were positive
[4] Max drawdown represents maximum peak-to-trough decline within a year
[5] 2026 data is for the year up to 11/9/2026 (YTD)
How Low Can It Go
| Event | CORZ | S&P 500 |
|---|---|---|
| 2025 US Tariff Shock | ||
| % Loss | -46.8% | -18.8% |
| % Gain to Breakeven | 88.1% | 23.1% |
| Time to Breakeven | 44 days | 79 days |
| 2024 Yen Carry Trade Unwind | ||
| % Loss | -15.9% | -7.8% |
| % Gain to Breakeven | 18.9% | 8.5% |
| Time to Breakeven | 2 days | 18 days |
In The Past
Core Scientific's stock fell -46.8% during the 2025 US Tariff Shock. Such a loss loss requires a 88.1% gain to breakeven.
Preserve Wealth
Limiting losses and compounding gains is essential to preserving wealth.
Asset Allocation
Actively managed asset allocation strategies protect wealth. Learn more.
| Event | CORZ | S&P 500 |
|---|---|---|
| 2025 US Tariff Shock | ||
| % Loss | -46.8% | -18.8% |
| % Gain to Breakeven | 88.1% | 23.1% |
| Time to Breakeven | 44 days | 79 days |
In The Past
Core Scientific's stock fell -46.8% during the 2025 US Tariff Shock. Such a loss loss requires a 88.1% gain to breakeven.
Preserve Wealth
Limiting losses and compounding gains is essential to preserving wealth.
Asset Allocation
Actively managed asset allocation strategies protect wealth. Learn more.
About Core Scientific (CORZ)
Core Scientific (CORZ) is a leading North American provider of net carbon-neutral blockchain infrastructure and digital asset mining solutions. The company operates through two primary segments: offering infrastructure services and equipment sales to third parties, and conducting its own digital asset mining operations.
In its Hosting segment, Core Scientific provides comprehensive blockchain infrastructure services to other digital asset miners. This includes offering robust data center facilities with power, racks, proprietary thermodynamic management, redundant connectivity, and 24/7 security. They also equip customers with their proprietary software platforms, Minder and MinderOS, for infrastructure management and custom firmware. Simultaneously, the company actively participates in its own digital asset mining, generating digital assets by solving complex cryptographic algorithms to validate transactions on specific digital asset network blockchains.
The company primarily serves other digital asset mining customers through consumption-based hosting contracts and direct equipment sales. Their service offerings to these customers include deployment, monitoring, troubleshooting, optimization, and maintenance for their mining equipment, along with essential electrical power and infrastructure support. Core Scientific operates a network of data centers across Georgia, Kentucky, North Carolina, North Dakota, and Texas, targeting the North American digital asset market.
AI Analysis | Feedback
Here are 1-3 brief analogies to describe Core Scientific:
Core Scientific is like an Equinix or Digital Realty Trust for cryptocurrency miners, providing them specialized hosting and also running its own large mining operations.
Think of Core Scientific as the AWS (Amazon Web Services) for cryptocurrency mining, offering specialized infrastructure for others while also operating its own massive mining farm.
AI Analysis | Feedback
- Blockchain Hosting Services: Provides comprehensive infrastructure, power, and proprietary software platforms for third-party customers to host and manage their digital asset mining equipment.
- Digital Asset Self-Mining: Operates its own fleet of digital asset mining equipment to generate digital assets by solving complex cryptographic algorithms on various blockchain networks.
- Mining Equipment Sales: Sells digital asset mining equipment directly to customers.
AI Analysis | Feedback
Core Scientific (CORZ) primarily serves other businesses and entities within the digital asset mining and blockchain infrastructure sectors. Based on the provided company description, specific names of major customer companies are not listed.
However, the types of business customers it serves can be categorized as:
- Digital Asset Mining Companies/Operations: These customers utilize Core Scientific's blockchain hosting services, which encompass providing power, racks, proprietary thermodynamic management, redundant connectivity, 24/7 security, and its proprietary software platforms (Minder and MinderOS). Core Scientific also offers deployment, monitoring, troubleshooting, optimization, and maintenance services for their digital asset mining equipment.
- Purchasers of Digital Asset Mining Equipment: The company engages in equipment sales to customers, indicating a segment of businesses or large-scale operators who acquire mining hardware directly from Core Scientific.
- Businesses Requiring Blockchain Infrastructure and Third-Party Hosting: This category includes entities seeking broader blockchain infrastructure services, leveraging Core Scientific's data centers and comprehensive hosting solutions for various blockchain-related needs.
AI Analysis | Feedback
- Bitmain Technologies Ltd.
- MicroBT
AI Analysis | Feedback
Adam Sullivan, Chief Executive Officer
Mr. Sullivan has over a decade of experience in financial services, with a focus on investment banking in the digital assets and infrastructure space. Prior to joining Core Scientific as President in 2023, he served as a Managing Director and Head of Digital Assets and Infrastructure at XMS Capital Partners. In this role, Mr. Sullivan oversaw more than $5 billion of transactions, including Core Scientific's business combination with Power & Digital Infrastructure Acquisition Corp. (“XPDI”) in 2021. He previously held positions at Indian Wells Capital Management and M&T Bank.
Jim Nygaard, Chief Financial Officer
Mr. Nygaard brings nearly 30 years of investment banking expertise, including extensive M&A, corporate finance, and capital-raising experience. Since 2008, he served as Managing Director and Head of M&A at XMS Capital Partners, LLC, where he advised clients across multiple industries on strategic transactions and financing initiatives. Before joining XMS Capital, Mr. Nygaard spent more than a decade at Morgan Stanley advising clients on complex deals and growth strategies.
Matt Brown, Chief Operating Officer
Mr. Brown has over 15 years of experience in operations and engineering management, including infrastructure strategy and management, site engineering, and data center operations. His previous roles include Senior Director – Americas IBX Operations at Equinix, where he was responsible for 200 data centers, and 12 years at Hewlett Packard, overseeing end-to-end data center infrastructure services. He began his career with the US Army.
Todd Duchene, Chief Legal and Administrative Officer
Mr. Duchene serves as the Executive Vice President, Chief Legal and Administrative Officer, and Secretary for Core Scientific.
Larry Kom, Chief Technology Officer
Mr. Kom holds the position of Chief Technology Officer at Core Scientific.
AI Analysis | Feedback
Key Risks to Core Scientific (CORZ)
- Volatility of Digital Asset Prices: As a company heavily involved in digital asset mining and holding digital assets, Core Scientific's financial performance is intrinsically linked to the market prices of cryptocurrencies, particularly Bitcoin. Significant declines in these prices could severely impact revenue from mining operations, the value of their digital asset holdings, and the demand for their hosting services.
- Energy Price Fluctuations and Availability: Core Scientific's operations, which include running large data centers for blockchain infrastructure and digital asset mining, are highly energy-intensive. Increases in electricity costs or disruptions in energy supply in their operational regions (Georgia, Kentucky, North Carolina, North Dakota, and Texas) could substantially increase operating expenses, reduce profitability, and potentially impact the viability of their mining and hosting activities.
- Regulatory and Legislative Changes: The digital asset and blockchain industry operates in a rapidly evolving regulatory landscape. New or adverse legislation, regulations, or government actions in the jurisdictions where Core Scientific operates or where its digital assets are traded could impose significant operational restrictions, increase compliance costs, impact the legality of certain activities, or negatively affect the market for digital assets.
AI Analysis | Feedback
Evolving regulatory landscapes leading to restrictions or outright bans on energy-intensive Proof-of-Work (PoW) cryptocurrency mining.
AI Analysis | Feedback
Core Scientific (CORZ) operates in the blockchain infrastructure and digital asset mining sector, offering blockchain hosting services, digital asset mining operations, and equipment sales. The addressable markets for its main products and services are sized as follows:
Blockchain Hosting Services
The global market for Blockchain Hosting was estimated to be worth approximately USD 212 million in 2025 and is projected to reach about USD 662 million by 2032, growing at a Compound Annual Growth Rate (CAGR) of 17.9% from 2026 to 2032. North America holds a significant share of the Blockchain-as-a-Service (BaaS) market, with approximately 40.40% in 2025. Based on this, the North American blockchain hosting market is estimated to be approximately USD 85.6 million in 2025.
Digital Asset Mining Operations
The global cryptocurrency mining market size was valued at USD 2.77 billion in 2025 and is predicted to increase to approximately USD 9.18 billion by 2035, expanding at a CAGR of 12.73% from 2026 to 2035. North America generated the largest portion of the worldwide market for cryptocurrency mining, with an estimated market share of 44.1% in 2025. This translates to an approximate North American digital asset mining market size of USD 1.22 billion in 2025.
Equipment Sales
The global cryptocurrency mining equipment market size is projected to be USD 5.1 billion in 2025 and is expected to grow to USD 5.42 billion in 2026, with a CAGR of 6.3%. The North America cryptocurrency mining hardware market size was USD 900.60 million in 2024 and is projected to reach USD 1.538 billion by 2031, growing at a CAGR of 6.7% from 2024 to 2031.
AI Analysis | Feedback
Core Scientific (CORZ) is undergoing a significant strategic shift, moving away from its legacy Bitcoin mining operations to focus on high-density colocation services, particularly for artificial intelligence (AI) and high-performance computing (HPC) workloads. Over the next 2-3 years, the company's revenue growth is expected to be driven by the following key factors:
- Expansion of AI/HPC Colocation Services: Core Scientific is strategically transforming into a dedicated AI infrastructure provider, with an expectation to rapidly increase revenue from high-density colocation (HDC) services. This involves converting existing facilities to support AI-related workloads and next-generation colocation services for third-party customers.
- Execution of the CoreWeave Partnership: A major driver of future revenue is the existing partnership with CoreWeave, which guarantees approximately 590 MW of infrastructure capacity. This contract is projected to generate over $10 billion in revenue over its term, equating to an average annual run rate of approximately $850 million. Core Scientific is on track to fully deliver this capacity by early 2027.
- Increased Power Capacity and Data Center Footprint: Core Scientific is actively expanding its colocation platform, aiming for a 1.5 gigawatt pipeline of leasable capacity by 2028. This includes the development of a new site in Hunt County, Texas, expected to add approximately 430 MW, and further expansions at existing locations in Dalton, Georgia, and Pecos, Texas, contributing an additional 300 MW.
- Diversification of Colocation Customer Base: While the CoreWeave contract is substantial, Core Scientific is also pursuing high-density, hybrid data center solutions for other compute-intensive clients beyond its traditional Bitcoin mining activities, as evidenced by its partnership with the Cadillac Formula 1 Team for data center services. This indicates a broader strategy to attract diverse customers needing high-performance computing infrastructure.
- Shift from Digital Asset Self-Mining to Higher-Margin Services: The company is actively repurposing its facilities previously used for digital asset self-mining to support higher-value AI and HPC colocation services. This strategic pivot is expected to lead to a rapid increase in revenue from high-density colocation, offsetting declines in digital asset self-mining revenue and shifting the revenue mix towards more stable and potentially higher-margin services.
AI Analysis | Feedback
Share Issuance
- Core Scientific reported proceeds from the issuance of new common stock of $55,000 in both the first quarter of 2025 and the third quarter of 2025.
Inbound Investments
- Core Scientific was the subject of a proposed $9 billion all-stock acquisition by CoreWeave, announced in July 2025, which was subsequently terminated in October 2025.
- A significant portion of Core Scientific's capital expenditures has been funded by CoreWeave as part of colocation service agreements, including $196.4 million in Q3 2025 and $226.2 million in Q4 2025.
- The company is exploring raising up to $4 billion for future infrastructure growth, supported by stable cash flows from existing high-performance computing (HPC) contracts.
Capital Expenditures
- Capital expenditures for the full year 2025 were approximately $729 million, largely driven by the expansion of colocation infrastructure for AI computing.
- In Q4 2025, capital expenditures were $279.2 million, with $226.2 million of this amount funded by CoreWeave.
- Core Scientific anticipates approximately $125 million in capital expenditures for 2026, focusing on colocation infrastructure for AI computing, with a significant portion expected to be funded by HPC customers like CoreWeave. The company also plans to sell approximately 2,500 BTC (~$165 million) in Q1 2026 to fund these expenditures.
Peer Outperformance in Systems Software
null| Industry | Names | 1Y med | 3Y med | 5Y med | Top 3 by 5Y |
|---|---|---|---|---|---|
| Electronic Manufacturing Services | 10 | 15.6% | 110.8% | 187.8% | FLEX 499% · TTMI 428% · JBL 303% |
| Technology Distributors | 9 | 50.7% | 59.2% | 59.9% | AVT 146% · SNX 118% · CNXN 77% |
| Semiconductor Materials & Equipment | 28 | 39.5% | 48.2% | 43.1% | AXTI 370% · KLAC 281% · LRCX 274% |
| Communications Equipment | 36 | 10.5% | 99.8% | 38.1% | AAOI 806% · LITE 546% · ANET 461% |
| Electronic Components | 24 | 20.6% | 78.5% | 33.8% | CLS 1838% · BELFA 1082% · APH 310% |
| Electronic Equipment & Instruments | 27 | -5.1% | 32.8% | -0.4% | PI 129% · OSIS 112% · MIR 70% |
| Semiconductors | 55 | 12.1% | 44.0% | -5.3% | MU 893% · AVGO 526% · NVDA 485% |
| Technology Hardware, Storage & Peripherals | 21 | 13.0% | 88.7% | -8.8% | WDC 592% · DELL 581% · SMCI 538% |
| IT Consulting & Other Services | 30 | -17.7% | -7.7% | -25.2% | APLD 293% · IBM 142% · GIB -10% |
| Internet Services & Infrastructure | 6 | -9.8% | 38.8% | -29.7% | GDDY 56% · VRSN 33% · AKAM -27% |
| Systems Software ← | 70 | -7.3% | 17.7% | -52.9% | ZETA 227% · CRWD 212% · CVLT 145% |
| Application Software | 126 | -11.5% | -11.7% | -55.7% | PLTR 598% · FROG 180% · AGYS 141% |
Latest Trefis Analyses
Research & Analysis
Invest in Strategies
Wealth Management
Peer Comparisons
| Peers to compare with: |
Financials
| Median | |
|---|---|
| Name | |
| Mkt Price | 9.79 |
| Mkt Cap | 3.5 |
| Rev LTM | 634 |
| Op Inc LTM | -398 |
| FCF LTM | -1,285 |
| FCF 3Y Avg | -955 |
| CFO LTM | -433 |
| CFO 3Y Avg | -294 |
Growth & Margins
| Median | |
|---|---|
| Name | |
| Rev Chg LTM | 6.8% |
| Rev Chg 3Y Avg | 48.9% |
| Rev Chg Q | -20.8% |
| QoQ Delta Rev Chg LTM | -5.6% |
| Op Inc Chg LTM | -140.9% |
| Op Inc Chg 3Y Avg | -100.6% |
| Op Mgn LTM | -82.0% |
| Op Mgn 3Y Avg | -62.7% |
| QoQ Delta Op Mgn LTM | -19.1% |
| CFO/Rev LTM | -82.8% |
| CFO/Rev 3Y Avg | -68.6% |
| FCF/Rev LTM | -195.4% |
| FCF/Rev 3Y Avg | -197.9% |
Valuation
| Median | |
|---|---|
| Name | |
| Mkt Cap | 3.5 |
| P/S | 8.3 |
| P/Op Inc | -9.6 |
| P/EBIT | -3.9 |
| P/E | -3.6 |
| P/CFO | -5.9 |
| Total Yield | -30.5% |
| Dividend Yield | 0.0% |
| FCF Yield 3Y Avg | -21.9% |
| D/E | 1.0 |
| Net D/E | 0.8 |
Price Behavior
| Market Price | $12.72 | |
| Market Cap ($ Bil) | 4.2 | |
| First Trading Date | 01/24/2024 | |
| Distance from 52W High | -56.4% | |
| 50 Days | 200 Days | |
| DMA Price | $15.60 | $19.48 |
| DMA Trend | down | down |
| Distance from DMA | -18.5% | -34.7% |
| 3M | 1YR | |
| Volatility | 79.0% | 76.0% |
| Downside Capture | 503.18 | 380.34 |
| Upside Capture | 340.21 | 276.77 |
| Correlation (S&P 500) | 51.3% | 52.1% |
| 1M | 2M | 3M | 6M | 1Y | 3Y | |
|---|---|---|---|---|---|---|
| Beta | 5.70 | 4.34 | 3.83 | 3.43 | 3.06 | -0.30 |
| Up Beta | -4.59 | -0.33 | 1.35 | 3.57 | 2.72 | -0.08 |
| Down Beta | 5.58 | 6.70 | 5.33 | 2.82 | 2.76 | 0.41 |
| Up Capture | 585% | 451% | 343% | 442% | 701% | 11433% |
| Bmk +ve Days | 12 | 18 | 28 | 62 | 130 | 427 |
| Stock +ve Days | 13 | 23 | 29 | 60 | 125 | 366 |
| Down Capture | 590% | 391% | 402% | 267% | 182% | 113% |
| Bmk -ve Days | 10 | 25 | 36 | 64 | 121 | 325 |
| Stock -ve Days | 9 | 20 | 35 | 66 | 126 | 324 |
[1] Upside and downside betas calculated using positive and negative benchmark daily returns respectively
Based On 1-Year Data
| Annualized Return | Annualized Volatility | Sharpe Ratio | Correlation with CORZ | |
|---|---|---|---|---|
| CORZ | -38.3% | 76.0% | -0.31 | - |
| Sector ETF (XLK) | 18.7% | 28.5% | 0.59 | 64.9% |
| Equity (SPY) | 13.3% | 13.7% | 0.65 | 52.0% |
| Gold (GLD) | 3.7% | 28.8% | 0.12 | 22.4% |
| Commodities (DBC) | 38.2% | 21.3% | 1.42 | -2.3% |
| Real Estate (VNQ) | 13.7% | 14.3% | 0.65 | -0.5% |
| Bitcoin (BTCUSD) | -25.3% | 43.6% | -0.55 | 37.5% |
Smart multi-asset allocation framework can stack odds in your favor. Learn How
Based On 5-Year Data
| Annualized Return | Annualized Volatility | Sharpe Ratio | Correlation with CORZ | |
|---|---|---|---|---|
| CORZ | 34.4% | 84.9% | 0.99 | - |
| Sector ETF (XLK) | 17.1% | 26.5% | 0.58 | 50.0% |
| Equity (SPY) | 11.8% | 17.3% | 0.51 | 44.5% |
| Gold (GLD) | 17.8% | 19.1% | 0.75 | 11.1% |
| Commodities (DBC) | 8.0% | 19.6% | 0.29 | 7.8% |
| Real Estate (VNQ) | 1.5% | 18.9% | -0.03 | 15.6% |
| Bitcoin (BTCUSD) | 4.4% | 51.6% | 0.27 | 37.5% |
Smart multi-asset allocation framework can stack odds in your favor. Learn How
Based On 10-Year Data
| Annualized Return | Annualized Volatility | Sharpe Ratio | Correlation with CORZ | |
|---|---|---|---|---|
| CORZ | 15.9% | 84.9% | 0.99 | - |
| Sector ETF (XLK) | 23.1% | 25.3% | 0.83 | 50.0% |
| Equity (SPY) | 15.3% | 18.0% | 0.72 | 44.5% |
| Gold (GLD) | 12.1% | 16.5% | 0.60 | 11.1% |
| Commodities (DBC) | 7.6% | 18.1% | 0.33 | 7.8% |
| Real Estate (VNQ) | 6.1% | 20.7% | 0.25 | 15.6% |
| Bitcoin (BTCUSD) | 60.0% | 66.3% | 1.00 | 37.5% |
Smart multi-asset allocation framework can stack odds in your favor. Learn How
Returns Analyses
Earnings Returns History
Updated 11/10/2026| Forward Returns | |||
|---|---|---|---|
| Earnings Date | 1D Returns | 5D Returns | 21D Returns |
| 11/5/2026 | -10.8% | ||
| 7/28/2026 | 0.0% | 10.1% | -13.1% |
| 5/6/2026 | -9.2% | -2.6% | 5.0% |
| 3/2/2026 | -7.2% | -8.1% | -9.3% |
| 10/24/2025 | 2.7% | 11.4% | -18.6% |
| 8/8/2025 | 0.8% | -1.9% | 0.8% |
| 5/7/2025 | 6.2% | 16.0% | 37.0% |
| 2/26/2025 | 6.9% | -4.2% | -21.4% |
| ... | |||
| SUMMARY STATS | |||
| # Positive | 8 | 5 | 5 |
| # Negative | 4 | 6 | 6 |
| Median Positive | 4.7% | 11.4% | 18.6% |
| Median Negative | -8.2% | -6.2% | -14.2% |
| Max Positive | 14.9% | 16.0% | 123.6% |
| Max Negative | -10.8% | -13.0% | -21.4% |
| Forward Returns | |||
|---|---|---|---|
| Earnings Date | 1D Returns | 5D Returns | 21D Returns |
| 11/5/2026 | -10.8% | ||
| 7/28/2026 | 0.0% | 10.1% | -13.1% |
| 5/6/2026 | -9.2% | -2.6% | 5.0% |
| 3/2/2026 | -7.2% | -8.1% | -9.3% |
| 10/24/2025 | 2.7% | 11.4% | -18.6% |
| 8/8/2025 | 0.8% | -1.9% | 0.8% |
| 5/7/2025 | 6.2% | 16.0% | 37.0% |
| 2/26/2025 | 6.9% | -4.2% | -21.4% |
| 11/6/2024 | 14.9% | 12.6% | 18.6% |
| 8/7/2024 | 3.3% | -10.4% | -5.1% |
| 5/8/2024 | 12.1% | 10.1% | 123.6% |
| 3/12/2024 | -6.2% | -13.0% | -15.3% |
| SUMMARY STATS | |||
| # Positive | 8 | 5 | 5 |
| # Negative | 4 | 6 | 6 |
| Median Positive | 4.7% | 11.4% | 18.6% |
| Median Negative | -8.2% | -6.2% | -14.2% |
| Max Positive | 14.9% | 16.0% | 123.6% |
| Max Negative | -10.8% | -13.0% | -21.4% |
SEC Filings
Expand for More| Report Date | Filing Date | Filing |
|---|---|---|
| 09/30/2026 | 11/05/2026 | 10-Q |
| 06/30/2026 | 07/28/2026 | 10-Q |
| 03/31/2026 | 05/06/2026 | 10-Q |
| 12/31/2025 | 03/02/2026 | 10-K |
| 09/30/2025 | 10/24/2025 | 10-Q |
| 06/30/2025 | 08/08/2025 | 10-Q |
| 03/31/2025 | 05/07/2025 | 10-Q |
| 12/31/2024 | 02/27/2025 | 10-K |
| 09/30/2024 | 11/06/2024 | 10-Q |
| 06/30/2024 | 08/07/2024 | 10-Q |
| 03/31/2024 | 05/09/2024 | 10-Q |
| 12/31/2023 | 03/13/2024 | 10-K |
| 09/30/2023 | 11/06/2023 | 10-Q |
| 06/30/2023 | 08/04/2023 | 10-Q |
| 03/31/2023 | 05/15/2023 | 10-Q |
| 12/31/2022 | 04/04/2023 | 10-K |
| Report Date | Filing Date | Filing |
|---|---|---|
| 09/30/2026 | 11/05/2026 | 10-Q |
| 06/30/2026 | 07/28/2026 | 10-Q |
| 03/31/2026 | 05/06/2026 | 10-Q |
| 12/31/2025 | 03/02/2026 | 10-K |
| 09/30/2025 | 10/24/2025 | 10-Q |
| 06/30/2025 | 08/08/2025 | 10-Q |
| 03/31/2025 | 05/07/2025 | 10-Q |
| 12/31/2024 | 02/27/2025 | 10-K |
| 09/30/2024 | 11/06/2024 | 10-Q |
| 06/30/2024 | 08/07/2024 | 10-Q |
| 03/31/2024 | 05/09/2024 | 10-Q |
| 12/31/2023 | 03/13/2024 | 10-K |
| 09/30/2023 | 11/06/2023 | 10-Q |
| 06/30/2023 | 08/04/2023 | 10-Q |
| 03/31/2023 | 05/15/2023 | 10-Q |
| 12/31/2022 | 04/04/2023 | 10-K |
| 09/30/2022 | 11/22/2022 | 10-Q |
| 06/30/2022 | 08/22/2022 | 10-Q |
| 03/31/2022 | 05/13/2022 | 10-Q |
| 12/31/2021 | 03/30/2022 | 10-K |
| 09/30/2021 | 01/03/2022 | 424B3 |
Insider Activity
Updated 11/4/2026| # | Owner | Title | Holding | Action | Filing Date | Price | Shares | Transacted Value | Value of Held Shares | Form |
|---|---|---|---|---|---|---|---|---|---|---|
| 1 | Duchene, Todd M | See remarks | Direct | Sell | 11042026 | 12.78 | 10,000 | 127,832 | 14,359,220 | Form |
| 2 | Duchene, Todd M | See remarks | Direct | Sell | 10282026 | 13.56 | 10,000 | 135,594 | 15,366,661 | Form |
| 3 | Duchene, Todd M | See remarks | Direct | Sell | 10202026 | 13.87 | 10,000 | 138,744 | 15,862,407 | Form |
| 4 | Duchene, Todd M | See remarks | Direct | Sell | 10142026 | 15.12 | 10,000 | 151,160 | 17,529,541 | Form |
| 5 | Duchene, Todd M | See remarks | Direct | Sell | 10072026 | 16.31 | 10,000 | 163,056 | 19,072,139 | Form |
| # | Owner | Title | Holding | Action | Filing Date | Price | Shares | Transacted Value | Value of Held Shares | Form |
|---|---|---|---|---|---|---|---|---|---|---|
| 1 | Duchene, Todd M | See remarks | Direct | Sell | 11042026 | 12.78 | 10,000 | 127,832 | 14,359,220 | Form |
| 2 | Duchene, Todd M | See remarks | Direct | Sell | 10282026 | 13.56 | 10,000 | 135,594 | 15,366,661 | Form |
| 3 | Duchene, Todd M | See remarks | Direct | Sell | 10202026 | 13.87 | 10,000 | 138,744 | 15,862,407 | Form |
| 4 | Duchene, Todd M | See remarks | Direct | Sell | 10142026 | 15.12 | 10,000 | 151,160 | 17,529,541 | Form |
| 5 | Duchene, Todd M | See remarks | Direct | Sell | 10072026 | 16.31 | 10,000 | 163,056 | 19,072,139 | Form |
| 6 | Duchene, Todd M | See remarks | Direct | Sell | 9302026 | 16.76 | 10,000 | 167,586 | 19,907,474 | Form |
| 7 | Duchene, Todd M | See remarks | Direct | Sell | 9232026 | 18.37 | 10,000 | 183,746 | 22,010,860 | Form |
| 8 | Weiss, Eric Stanton | Direct | Buy | 9172026 | 16.33 | 6,000 | 97,980 | 4,331,728 | Form | |
| 9 | Duchene, Todd M | See remarks | Direct | Sell | 9162026 | 17.14 | 10,000 | 171,362 | 20,698,747 | Form |
| 10 | Duchene, Todd M | See remarks | Direct | Sell | 9102026 | 18.67 | 10,000 | 186,735 | 22,742,381 | Form |
| 11 | Duchene, Todd M | See remarks | Direct | Sell | 9022026 | 16.23 | 10,000 | 162,340 | 31,297,464 | Form |
| 12 | Duchene, Todd M | See remarks | Direct | Sell | 8262026 | 17.45 | 10,000 | 174,493 | 33,814,929 | Form |
| 13 | Crain, Elizabeth | Direct | Buy | 8242026 | 18.33 | 6,000 | 109,994 | 1,307,980 | Form | |
| 14 | Duchene, Todd M | See remarks | Direct | Sell | 8192026 | 20.10 | 10,000 | 200,974 | 39,372,836 | Form |
| 15 | Duchene, Todd M | See remarks | Direct | Sell | 8122026 | 19.97 | 10,000 | 199,735 | 39,329,918 | Form |
| 16 | Duchene, Todd M | See remarks | Direct | Sell | 8052026 | 22.23 | 10,000 | 222,340 | 44,003,292 | Form |
| 17 | Duchene, Todd M | See remarks | Direct | Sell | 7292026 | 20.95 | 10,000 | 209,476 | 41,666,946 | Form |
| 18 | Duchene, Todd M | See remarks | Direct | Sell | 7222026 | 22.30 | 10,000 | 222,995 | 44,578,953 | Form |
| 19 | Duchene, Todd M | See remarks | Direct | Sell | 7152026 | 22.45 | 10,000 | 224,475 | 45,196,374 | Form |
| 20 | Duchene, Todd M | See remarks | Direct | Sell | 7082026 | 22.63 | 10,000 | 226,254 | 45,780,823 | Form |
| 21 | Duchene, Todd M | See remarks | Direct | Sell | 7012026 | 26.17 | 10,000 | 261,658 | 53,349,229 | Form |
| 22 | Duchene, Todd M | See remarks | Direct | Sell | 6242026 | 29.29 | 10,000 | 292,939 | 60,020,174 | Form |
| 23 | Duchene, Todd M | See remarks | Direct | Sell | 6172026 | 28.19 | 10,000 | 281,935 | 58,047,508 | Form |
| 24 | Duchene, Todd M | See remarks | Direct | Sell | 6102026 | 26.85 | 10,000 | 268,481 | 55,545,827 | Form |
| 25 | Duchene, Todd M | See remarks | Direct | Sell | 6032026 | 28.36 | 10,000 | 283,619 | 58,961,354 | Form |
| 26 | Duchene, Todd M | See remarks | Direct | Sell | 5282026 | 26.25 | 10,000 | 262,540 | 54,841,849 | Form |
| 27 | Duchene, Todd M | See remarks | Direct | Sell | 5202026 | 23.15 | 10,000 | 231,497 | 45,381,515 | Form |
| 28 | Duchene, Todd M | See remarks | Direct | Sell | 5132026 | 23.24 | 10,000 | 232,420 | 45,794,820 | Form |
| 29 | Duchene, Todd M | See remarks | Direct | Sell | 5062026 | 20.86 | 10,000 | 208,567 | 41,303,526 | Form |
| 30 | Duchene, Todd M | See remarks | Direct | Sell | 4292026 | 20.94 | 10,000 | 209,390 | 41,675,897 | Form |
| 31 | Duchene, Todd M | See remarks | Direct | Sell | 4222026 | 19.80 | 10,000 | 197,952 | 39,597,289 | Form |
| 32 | Duchene, Todd M | See remarks | Direct | Sell | 4152026 | 18.62 | 10,000 | 186,247 | 37,753,973 | Form |
| 33 | Duchene, Todd M | See remarks | Direct | Sell | 4082026 | 16.49 | 10,000 | 164,865 | 33,584,468 | Form |
| 34 | Duchene, Todd M | See remarks | Direct | Sell | 4022026 | 15.25 | 10,000 | 152,523 | 31,222,816 | Form |
| 35 | Weiss, Eric Stanton | Direct | Buy | 3102026 | 14.53 | 7,000 | 101,700 | 3,664,988 | Form | |
| 36 | Weiss, Eric Stanton | Direct | Buy | 11062025 | 21.50 | 5,000 | 107,500 | 4,873,770 | Form |
Investor Activity (13F)
Updated Nov 10, 2026Active managers (13F portfolio over $250M, at least 3 holdings) with a position over $5M that is either over 10% of their portfolio or held in a concentrated book of 50 or fewer total positions. Index/ETF, sovereign, bank, community-bank and charitable/donor-advised filers are excluded.
| Active Manager | Value | % of Portfolio | Total Positions | QoQ | Filing |
|---|---|---|---|---|---|
| Ascentis Wealth Management, LLC | $144.4 Mil | 28.4% | 1741 | Hold | 13F |
| Scoggin Management LP | $29.9 Mil | 11.8% | 30 | ADD +70.2% | 13F |
| Goodlander Investment Management, LLC | $33.7 Mil | 11.6% | 12 | ADD +181.3% | 13F |
| Two Seas Capital LP | $244.5 Mil | 11.3% | 35 | Hold | 13F |
| Situational Awareness Partners LP | $389.1 Mil | 10.1% | 26 | New | 13F |
| Situational Awareness LP | $389.1 Mil | 10.1% | 26 | TRIM -9.6% | 13F |
| Valiant Capital Management, L.P. | $102.5 Mil | 8.1% | 28 | ADD +8.1% | 13F |
| Pennant Investors, LP | $16.6 Mil | 4.6% | 17 | TRIM -27.9% | 13F |
| VR Advisory Services Ltd | $36.1 Mil | 4.3% | 40 | ADD +18.6% | 13F |
| Alta Fundamental Advisers LLC | $8.9 Mil | 3.5% | 21 | New | 13F |
| Troluce Capital Advisors LLC | $25.4 Mil | 2.7% | 46 | New | 13F |
| Jericho Capital Asset Management L.P. | $175.4 Mil | 2.6% | 23 | TRIM -10.1% | 13F |
| ParaFi Capital LP | $7.6 Mil | 2.4% | 18 | TRIM -54.5% | 13F |
| Element Capital Management LLC | $5.2 Mil | 2.1% | 34 | Hold | 13F |
| Nishkama Capital, LLC | $9.7 Mil | 1.4% | 39 | New | 13F |
| Deltroit Asset Management (UK) LLP | $6.7 Mil | 1.2% | 39 | TRIM -10.0% | 13F |
| Dendur Capital LP | $10.0 Mil | 0.7% | 21 | New | 13F |
| Kensico Capital Management Corp | $35.1 Mil | 0.7% | 20 | New | 13F |
| Avantyr Capital Partners, LP | $11.9 Mil | 0.6% | 22 | New | 13F |
| Active Manager | Value | % of Portfolio | Total Positions | QoQ | Filing |
|---|---|---|---|---|---|
| Situational Awareness Partners LP | $389.1 Mil | 10.1% | 26 | New | 13F |
| Kensico Capital Management Corp | $35.1 Mil | 0.7% | 20 | New | 13F |
| Troluce Capital Advisors LLC | $25.4 Mil | 2.7% | 46 | New | 13F |
| Avantyr Capital Partners, LP | $11.9 Mil | 0.6% | 22 | New | 13F |
| Dendur Capital LP | $10.0 Mil | 0.7% | 21 | New | 13F |
| Nishkama Capital, LLC | $9.7 Mil | 1.4% | 39 | New | 13F |
| Alta Fundamental Advisers LLC | $8.9 Mil | 3.5% | 21 | New | 13F |
| Goodlander Investment Management, LLC | $33.7 Mil | 11.6% | 12 | ADD +181.3% | 13F |
| Scoggin Management LP | $29.9 Mil | 11.8% | 30 | ADD +70.2% | 13F |
| VR Advisory Services Ltd | $36.1 Mil | 4.3% | 40 | ADD +18.6% | 13F |
| Valiant Capital Management, L.P. | $102.5 Mil | 8.1% | 28 | ADD +8.1% | 13F |
| Active Manager | Value | % of Portfolio | Total Positions | QoQ | As Of | Filing |
|---|---|---|---|---|---|---|
| Think Investments LP | $40.8 Mil | 5.2% | 22 | Exited | Dec 31, 2025 | 13F |
| Parsifal Capital Management, LP | $17.4 Mil | 1.8% | 15 | Exited | Dec 31, 2025 | 13F |
| ParaFi Capital LP | $7.6 Mil | 2.4% | 18 | TRIM -54.5% | Mar 31, 2026 | 13F |
| Pennant Investors, LP | $16.6 Mil | 4.6% | 17 | TRIM -27.9% | Mar 31, 2026 | 13F |
| Jericho Capital Asset Management L.P. | $175.4 Mil | 2.6% | 23 | TRIM -10.1% | Mar 31, 2026 | 13F |
| Deltroit Asset Management (UK) LLP | $6.7 Mil | 1.2% | 39 | TRIM -10.0% | Mar 31, 2026 | 13F |
| Situational Awareness LP | $389.1 Mil | 10.1% | 26 | TRIM -9.6% | Mar 31, 2026 | 13F |
| Active Manager | Value | % of Portfolio | Total Positions | QoQ | Filing |
|---|---|---|---|---|---|
| Situational Awareness Partners LP | $389.1 Mil | 10.1% | 26 | New | 13F |
| Situational Awareness LP | $389.1 Mil | 10.1% | 26 | TRIM -9.6% | 13F |
| Two Seas Capital LP | $244.5 Mil | 11.3% | 35 | Hold | 13F |
| Jericho Capital Asset Management L.P. | $175.4 Mil | 2.6% | 23 | TRIM -10.1% | 13F |
| Ascentis Wealth Management, LLC | $144.4 Mil | 28.4% | 1741 | Hold | 13F |
| Valiant Capital Management, L.P. | $102.5 Mil | 8.1% | 28 | ADD +8.1% | 13F |
| VR Advisory Services Ltd | $36.1 Mil | 4.3% | 40 | ADD +18.6% | 13F |
| Kensico Capital Management Corp | $35.1 Mil | 0.7% | 20 | New | 13F |
| Goodlander Investment Management, LLC | $33.7 Mil | 11.6% | 12 | ADD +181.3% | 13F |
| Scoggin Management LP | $29.9 Mil | 11.8% | 30 | ADD +70.2% | 13F |
| Troluce Capital Advisors LLC | $25.4 Mil | 2.7% | 46 | New | 13F |
| Pennant Investors, LP | $16.6 Mil | 4.6% | 17 | TRIM -27.9% | 13F |
| Avantyr Capital Partners, LP | $11.9 Mil | 0.6% | 22 | New | 13F |
| Dendur Capital LP | $10.0 Mil | 0.7% | 21 | New | 13F |
| Nishkama Capital, LLC | $9.7 Mil | 1.4% | 39 | New | 13F |
| Alta Fundamental Advisers LLC | $8.9 Mil | 3.5% | 21 | New | 13F |
| ParaFi Capital LP | $7.6 Mil | 2.4% | 18 | TRIM -54.5% | 13F |
| Deltroit Asset Management (UK) LLP | $6.7 Mil | 1.2% | 39 | TRIM -10.0% | 13F |
| Element Capital Management LLC | $5.2 Mil | 2.1% | 34 | Hold | 13F |
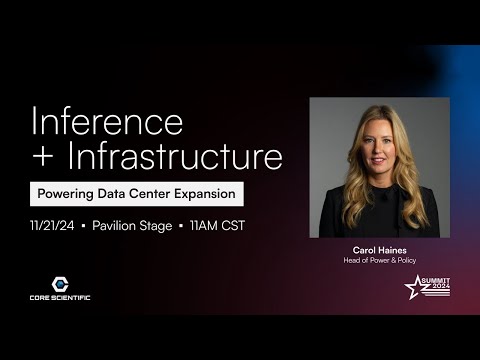
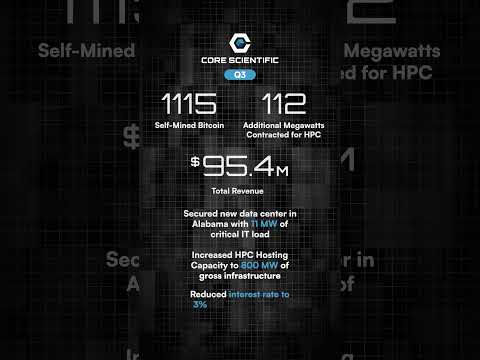
Core Scientific — Investor Video Playlist





Industry Resources
| Information Technology Resources |
| TechCrunch |
| Wired |
| CIO |
| MIT Technology Review |
| Gartner Insights |
| Ars Technica |
| Systems Software Resources |
| CNET |
| ZDNet |
| Gartner |
| Software Development Times |
External Quote Links
| Y Finance | Barrons |
| TradingView | Morningstar |
| SeekingAlpha | ValueLine |
| Motley Fool | Robinhood |
| CNBC | Etrade |
| MarketWatch | Unusual Whales |
| YCharts | Perplexity Finance |
| FinViz |
Prefer one of these to Trefis? Tell us why.