
Advanced Micro Devices (AMD)
Market Price (11/6/2026): $417.89 | Market Cap: $685.4 BilInvestor Relations Sector: Information Technology | Industry: Semiconductors
Advanced Micro Devices (AMD)
Market Price (11/6/2026): $417.89Market Cap: $685.4 BilSector: Information TechnologyIndustry: Semiconductors
Investment Highlights Why It Matters Detailed financial logic regarding cash flow yields vs trend-riding momentum.
Strong revenue growthRev Chg LTMRevenue Change % Last Twelve Months (LTM) is 42% Attractive cash flow generationCFO/Rev LTMCash Flow from Operations / Revenue (Sales), Last Twelve Months (LTM) is 20%, FCF/Rev LTMFree Cash Flow / Revenue (Sales), Last Twelve Months (LTM) is 16%, CFO LTM is 9.1 Bil, FCF LTM is 7.1 Bil Valuation becoming less expensiveP/S 6M Chg %Price/Sales change over 6 months. Declining P/S indicates valuation has become less expensive. is -37% Stock buyback supportStock Buyback 3Y Total is 5.8 Bil Megatrend and thematic driversMegatrends include Artificial Intelligence, Cloud Computing, Digital Content & Streaming, and 5G & Advanced Connectivity. Show more. | Expensive valuation multiplesP/EBITPrice/EBIT or Price/(Operating Income) ratio is 80x, P/CFOPrice/(Cash Flow from Operations). CFO is cash before capital expenditures. is 73x, P/EPrice/Earnings or Price/(Net Income) is 87x Yield minus risk free rate is negativeERPEquity Risk Premium (ERP) = Total Yield - Risk Free Rate, Reflects the premium above risk free assets offered by the investment. is -4.1% Key risksAMD key risks include [1] fierce competition from NVIDIA, Show more. |
| Strong revenue growthRev Chg LTMRevenue Change % Last Twelve Months (LTM) is 42% |
| Attractive cash flow generationCFO/Rev LTMCash Flow from Operations / Revenue (Sales), Last Twelve Months (LTM) is 20%, FCF/Rev LTMFree Cash Flow / Revenue (Sales), Last Twelve Months (LTM) is 16%, CFO LTM is 9.1 Bil, FCF LTM is 7.1 Bil |
| Valuation becoming less expensiveP/S 6M Chg %Price/Sales change over 6 months. Declining P/S indicates valuation has become less expensive. is -37% |
| Stock buyback supportStock Buyback 3Y Total is 5.8 Bil |
| Megatrend and thematic driversMegatrends include Artificial Intelligence, Cloud Computing, Digital Content & Streaming, and 5G & Advanced Connectivity. Show more. |
| Expensive valuation multiplesP/EBITPrice/EBIT or Price/(Operating Income) ratio is 80x, P/CFOPrice/(Cash Flow from Operations). CFO is cash before capital expenditures. is 73x, P/EPrice/Earnings or Price/(Net Income) is 87x |
| Yield minus risk free rate is negativeERPEquity Risk Premium (ERP) = Total Yield - Risk Free Rate, Reflects the premium above risk free assets offered by the investment. is -4.1% |
| Key risksAMD key risks include [1] fierce competition from NVIDIA, Show more. |
Qualitative Assessment
AI Analysis | Feedback
Advanced Micro Devices (AMD) stock has lost about 15% since 7/31/2026 because of the following key factors:
1. High Valuation and Investor Profit-Taking. Despite reporting record fiscal third quarter 2026 revenue of $13.4 billion, a 45% increase year-over-year, and non-GAAP earnings per share of $2.09, up 74% year-over-year, AMD's stock valuation remained elevated. As of November 2, 2026, AMD traded at approximately 61.3 times its adjusted EPS forecast for fiscal 2026, suggesting high investor expectations for future growth. This high valuation, coupled with significant year-to-date gains of nearly 118% as of November 3, 2026, likely prompted some investors to take profits, thereby capping further substantial upward movement during the period.
2. Mixed Performance Across Business Segments. While the Data Center segment was a standout, achieving a record $8.5 billion in revenue in fiscal Q3 2026, representing a 97% year-over-year increase driven by demand for EPYC CPUs and Instinct MI450 Series GPUs, other segments presented a more mixed picture. The Gaming segment experienced a significant 40% year-over-year decline in revenue to $773 million in fiscal Q3 2026 due to lower semi-custom and graphics revenue. Although the Client business grew 7% year-over-year to $2.9 billion, the contrasting performance across key segments likely contributed to the stock's largely stable trend.
Show more
Advanced Micro Devices (AMD) stock has lost about 15% since 7/31/2026 because of the following key factors:
1. High Valuation and Investor Profit-Taking. Despite reporting record fiscal third quarter 2026 revenue of $13.4 billion, a 45% increase year-over-year, and non-GAAP earnings per share of $2.09, up 74% year-over-year, AMD's stock valuation remained elevated. As of November 2, 2026, AMD traded at approximately 61.3 times its adjusted EPS forecast for fiscal 2026, suggesting high investor expectations for future growth. This high valuation, coupled with significant year-to-date gains of nearly 118% as of November 3, 2026, likely prompted some investors to take profits, thereby capping further substantial upward movement during the period.
2. Mixed Performance Across Business Segments. While the Data Center segment was a standout, achieving a record $8.5 billion in revenue in fiscal Q3 2026, representing a 97% year-over-year increase driven by demand for EPYC CPUs and Instinct MI450 Series GPUs, other segments presented a more mixed picture. The Gaming segment experienced a significant 40% year-over-year decline in revenue to $773 million in fiscal Q3 2026 due to lower semi-custom and graphics revenue. Although the Client business grew 7% year-over-year to $2.9 billion, the contrasting performance across key segments likely contributed to the stock's largely stable trend.
3. Broader Macroeconomic Headwinds and Sectoral Selectivity. In fiscal Q3 2026, the broader market experienced a narrow set of companies driving gains, with many sectors facing declines influenced by rising interest rates and persistent inflation. While the semiconductor sector, supported by AI-compute demand, performed strongly (with the VanEck Semiconductor ETF gaining over 9% in September 2026), this overall cautious macroeconomic environment and selective investor appetite likely tempered AMD's ability to achieve significant sustained upward momentum despite its strong company-specific performance.
4. Strategic Acquisitions and Associated Integration Risks. During the period, AMD announced significant strategic moves, including agreements to acquire World Labs for approximately $8.2 billion in an all-stock transaction and Taalas for specialized inference silicon technology. While these acquisitions are aimed at bolstering AMD's long-term AI capabilities, such large-scale integrations inherently introduce potential short-term integration costs and execution risks. These factors could have introduced a degree of investor caution, contributing to the stock's consolidation rather than a strong upward trend.
Show less
Stock Movement Drivers
Fundamental Drivers
The -15.1% change in AMD stock from 7/31/2026 to 11/5/2026 was primarily driven by a -44.0% change in the company's P/E Multiple.| (LTM values as of) | 7312026 | 11052026 | Change |
|---|---|---|---|
| Stock Price ($) | 476.15 | 404.40 | -15.1% |
| Change Contribution By: | |||
| Total Revenues ($ Mil) | 37,454 | 45,436 | 21.3% |
| Net Income Margin (%) | 13.4% | 16.8% | 25.4% |
| P/E Multiple | 155.0 | 86.8 | -44.0% |
| Shares Outstanding (Mil) | 1,631 | 1,636 | -0.3% |
| Cumulative Contribution | -15.1% |
Market Drivers
7/31/2026 to 11/5/2026| Return | Correlation | |
|---|---|---|
| AMD | -15.1% | |
| Market (SPY) | -1.9% | 70.8% |
| Sector (XLK) | -7.4% | 85.2% |
Fundamental Drivers
The 14.1% change in AMD stock from 4/30/2026 to 11/5/2026 was primarily driven by a 34.0% change in the company's Net Income Margin (%).| (LTM values as of) | 4302026 | 11052026 | Change |
|---|---|---|---|
| Stock Price ($) | 354.49 | 404.40 | 14.1% |
| Change Contribution By: | |||
| Total Revenues ($ Mil) | 34,639 | 45,436 | 31.2% |
| Net Income Margin (%) | 12.5% | 16.8% | 34.0% |
| P/E Multiple | 133.0 | 86.8 | -34.7% |
| Shares Outstanding (Mil) | 1,627 | 1,636 | -0.6% |
| Cumulative Contribution | 14.1% |
Market Drivers
4/30/2026 to 11/5/2026| Return | Correlation | |
|---|---|---|
| AMD | 14.1% | |
| Market (SPY) | 2.3% | 71.4% |
| Sector (XLK) | 1.9% | 85.6% |
Fundamental Drivers
The 57.9% change in AMD stock from 10/31/2025 to 11/5/2026 was primarily driven by a 75.1% change in the company's Net Income Margin (%).| (LTM values as of) | 10312025 | 11052026 | Change |
|---|---|---|---|
| Stock Price ($) | 256.12 | 404.40 | 57.9% |
| Change Contribution By: | |||
| Total Revenues ($ Mil) | 29,600 | 45,436 | 53.5% |
| Net Income Margin (%) | 9.6% | 16.8% | 75.1% |
| P/E Multiple | 146.7 | 86.8 | -40.8% |
| Shares Outstanding (Mil) | 1,623 | 1,636 | -0.8% |
| Cumulative Contribution | 57.9% |
Market Drivers
10/31/2025 to 11/5/2026| Return | Correlation | |
|---|---|---|
| AMD | 57.9% | |
| Market (SPY) | 8.4% | 63.8% |
| Sector (XLK) | 8.4% | 79.8% |
Fundamental Drivers
The 310.6% change in AMD stock from 10/31/2023 to 11/5/2026 was primarily driven by a 107.7% change in the company's Total Revenues ($ Mil).| (LTM values as of) | 10312023 | 11052026 | Change |
|---|---|---|---|
| Stock Price ($) | 98.50 | 404.40 | 310.6% |
| Change Contribution By: | |||
| Total Revenues ($ Mil) | 21,876 | 45,436 | 107.7% |
| P/S Multiple | 7.3 | 14.6 | 100.6% |
| Shares Outstanding (Mil) | 1,612 | 1,636 | -1.5% |
| Cumulative Contribution | 310.6% |
Market Drivers
10/31/2023 to 11/5/2026| Return | Correlation | |
|---|---|---|
| AMD | 310.6% | |
| Market (SPY) | 81.3% | 61.3% |
| Sector (XLK) | 101.5% | 73.2% |
Price Returns Compared
| 2021 | 2022 | 2023 | 2024 | 2025 | 2026 | Total [1] | |
|---|---|---|---|---|---|---|---|
| Returns | |||||||
| AMD Return | 57% | -55% | 128% | -18% | 77% | 89% | 341% |
| Peers Return | 59% | -41% | 107% | 63% | 33% | 15% | 382% |
| S&P 500 Return | 27% | -19% | 24% | 23% | 16% | 12% | 105% |
Monthly Win Rates [3] | |||||||
| AMD Win Rate | 50% | 33% | 58% | 42% | 42% | 55% | |
| Peers Win Rate | 63% | 40% | 68% | 60% | 57% | 45% | |
| S&P 500 Win Rate | 75% | 42% | 67% | 75% | 67% | 45% | |
Max Drawdowns [4] | |||||||
| AMD Max Drawdown | -25% | -63% | -27% | -44% | -40% | -38% | |
| Peers Max Drawdown | -24% | -51% | -20% | -36% | -40% | -45% | |
| S&P 500 Max Drawdown | -5% | -25% | -10% | -8% | -19% | -9% | |
[1] Cumulative total returns since the beginning of 2021
[2] Peers: INTC, NVDA, AVGO, QCOM, MRVL. See AMD Returns vs. Peers.
[3] Win Rate = % of calendar months in which monthly returns were positive
[4] Max drawdown represents maximum peak-to-trough decline within a year
[5] 2026 data is for the year up to 11/5/2026 (YTD)
How Low Can It Go
| Event | AMD | S&P 500 |
|---|---|---|
| 2025 US Tariff Shock | ||
| % Loss | -31.8% | -18.8% |
| % Gain to Breakeven | 46.6% | 23.1% |
| Time to Breakeven | 36 days | 79 days |
| 2024 Yen Carry Trade Unwind | ||
| % Loss | -30.1% | -7.8% |
| % Gain to Breakeven | 43.0% | 8.5% |
| Time to Breakeven | 371 days | 18 days |
| Summer-Fall 2023 Five Percent Yield Shock | ||
| % Loss | -17.1% | -9.5% |
| % Gain to Breakeven | 20.6% | 10.5% |
| Time to Breakeven | 12 days | 24 days |
| 2022 Inflation Shock & Fed Tightening | ||
| % Loss | -62.8% | -24.5% |
| % Gain to Breakeven | 168.6% | 32.4% |
| Time to Breakeven | 459 days | 427 days |
| 2020 COVID-19 Crash | ||
| % Loss | -34.3% | -33.7% |
| % Gain to Breakeven | 52.2% | 50.9% |
| Time to Breakeven | 128 days | 140 days |
| Q4 2018 Fed Policy Error / Growth Scare | ||
| % Loss | -41.4% | -19.2% |
| % Gain to Breakeven | 70.8% | 23.8% |
| Time to Breakeven | 100 days | 105 days |
In The Past
Advanced Micro Devices's stock fell -31.8% during the 2025 US Tariff Shock. Such a loss loss requires a 46.6% gain to breakeven.
Preserve Wealth
Limiting losses and compounding gains is essential to preserving wealth.
Asset Allocation
Actively managed asset allocation strategies protect wealth. Learn more.
| Event | AMD | S&P 500 |
|---|---|---|
| 2025 US Tariff Shock | ||
| % Loss | -31.8% | -18.8% |
| % Gain to Breakeven | 46.6% | 23.1% |
| Time to Breakeven | 36 days | 79 days |
| 2024 Yen Carry Trade Unwind | ||
| % Loss | -30.1% | -7.8% |
| % Gain to Breakeven | 43.0% | 8.5% |
| Time to Breakeven | 371 days | 18 days |
| 2022 Inflation Shock & Fed Tightening | ||
| % Loss | -62.8% | -24.5% |
| % Gain to Breakeven | 168.6% | 32.4% |
| Time to Breakeven | 459 days | 427 days |
| 2020 COVID-19 Crash | ||
| % Loss | -34.3% | -33.7% |
| % Gain to Breakeven | 52.2% | 50.9% |
| Time to Breakeven | 128 days | 140 days |
| Q4 2018 Fed Policy Error / Growth Scare | ||
| % Loss | -41.4% | -19.2% |
| % Gain to Breakeven | 70.8% | 23.8% |
| Time to Breakeven | 100 days | 105 days |
| 2014-2016 Oil Price Collapse | ||
| % Loss | -61.2% | -6.8% |
| % Gain to Breakeven | 157.4% | 7.3% |
| Time to Breakeven | 302 days | 15 days |
| 2011 US Debt Ceiling Crisis & European Contagion | ||
| % Loss | -41.5% | -17.9% |
| % Gain to Breakeven | 71.1% | 21.8% |
| Time to Breakeven | 162 days | 123 days |
| 2010 Eurozone Sovereign Debt Crisis / Flash Crash | ||
| % Loss | -29.4% | -15.4% |
| % Gain to Breakeven | 41.6% | 18.2% |
| Time to Breakeven | 2347 days | 125 days |
| 2008-2009 Global Financial Crisis | ||
| % Loss | -76.8% | -53.4% |
| % Gain to Breakeven | 331.7% | 114.4% |
| Time to Breakeven | 373 days | 1085 days |
| Summer 2007 Credit Crunch | ||
| % Loss | -24.2% | -8.6% |
| % Gain to Breakeven | 32.0% | 9.5% |
| Time to Breakeven | 3947 days | 47 days |
In The Past
Advanced Micro Devices's stock fell -31.8% during the 2025 US Tariff Shock. Such a loss loss requires a 46.6% gain to breakeven.
Preserve Wealth
Limiting losses and compounding gains is essential to preserving wealth.
Asset Allocation
Actively managed asset allocation strategies protect wealth. Learn more.
About Advanced Micro Devices (AMD)
Advanced Micro Devices (AMD) is a global semiconductor company that specializes in designing and producing a wide range of high-performance microprocessors and graphics processing units (GPUs). The company operates primarily through two segments: Computing and Graphics, and Enterprise, Embedded and Semi-Custom. AMD is a critical provider of the foundational computing technology that powers everything from personal computers to advanced data centers.
AMD's main product categories include central processing units (CPUs) and graphics processing units (GPUs). For desktop and notebook personal computers, it offers CPUs under brands like AMD Ryzen and Athlon, and discrete GPUs under AMD Radeon graphics. Its powerful AMD EPYC microprocessors are designed for servers, while professional graphics products include AMD Radeon Pro and AMD FirePro. Furthermore, AMD provides high-performance accelerators like Radeon Instinct and AMD Instinct for data centers and AI applications, and is a key supplier of semi-custom System-on-Chip (SoC) products, notably for leading game consoles.
The company serves a diverse global customer base that includes major original equipment manufacturers (OEMs) for PCs and servers, public cloud service providers, and original design manufacturers (ODMs). AMD's technology is also integral to game console manufacturers. It reaches its markets through a combination of direct sales, independent distributors, sales representatives, system integrators, online retailers, and add-in-board manufacturers, ensuring its products are widely adopted across various computing and entertainment industries.
AI Analysis | Feedback
AMD is a semiconductor company that directly challenges Intel for computer processors (CPUs) and NVIDIA for graphics cards and AI accelerators (GPUs).
AI Analysis | Feedback
- x86 Microprocessors (APUs): Processors designed for desktop and notebook personal computers, often integrating CPU and GPU cores.
- Chipsets: Components that facilitate communication between the processor, memory, and other peripherals within a system.
- Graphics Processing Units (GPUs): Discrete and integrated graphics cards for a range of applications, including consumer PCs, professional workstations, and data centers.
- Server and Embedded Processors: High-performance processors specifically designed for use in servers, data centers, and specialized embedded computing systems.
- Semi-custom System-on-Chip (SoC) Products: Integrated circuits tailored to customer specifications, often combining CPU, GPU, and multimedia technologies, such as those used in game consoles.
- Development Services: Services that assist with the design and integration of AMD's CPU, GPU, and multimedia technologies into customer-specific solutions.
AI Analysis | Feedback
Advanced Micro Devices (AMD) primarily operates on a Business-to-Business (B2B) model, selling its processors, graphics cards, and semi-custom solutions to other companies that integrate them into their final products or services.
The company's major customers include:
- Microsoft Corp. (MSFT): A significant customer for AMD's custom System-on-Chip (SoC) products used in Xbox game consoles, as well as for server processors (EPYC) and accelerators in its Azure cloud computing services.
- Sony Group Corp. (SONY): Another major customer for AMD's custom SoC products powering the PlayStation series of game consoles.
- Hewlett-Packard (HP) Inc. (HPQ): A leading Original Equipment Manufacturer (OEM) that incorporates AMD CPUs and GPUs into its desktop and notebook personal computers.
- Dell Technologies Inc. (DELL): A prominent OEM for personal computers and servers, utilizing AMD processors and graphics solutions in its product lines.
- Alphabet Inc. (GOOGL): The parent company of Google Cloud, which deploys AMD EPYC server processors in its data centers to power its cloud computing services.
- Amazon.com Inc. (AMZN): Through its Amazon Web Services (AWS) division, Amazon utilizes AMD EPYC server processors to deliver cloud infrastructure services.
- Lenovo Group Ltd. (HKG: 0992): A major global OEM for personal computers, workstations, and servers that integrates AMD's CPUs and GPUs into a wide range of its products.
AI Analysis | Feedback
- Taiwan Semiconductor Manufacturing Company (TSM)
- GlobalFoundries (GFS)
- ASE Technology Holding Co., Ltd. (ASX)
- Amkor Technology, Inc. (AMKR)
AI Analysis | Feedback
Lisa Su, Chair and Chief Executive Officer
Lisa Su joined AMD in 2012 and became President and CEO in October 2014, leading a significant turnaround of the company. Before AMD, she held senior leadership roles at Freescale Semiconductor, Inc., including Senior Vice President and General Manager of Networking and Multimedia, and Chief Technology Officer. Prior to Freescale, she spent 13 years at IBM in various engineering and business leadership positions, including Vice President of the Semiconductor Research and Development Center. At IBM, she was involved in developing silicon-on-insulator semiconductor manufacturing technologies and more efficient semiconductor chips, and she formed IBM's Emerging Products group, helping to transform industry standards by replacing aluminum interconnects with copper ones.
Jean Hu, Executive Vice President, Chief Financial Officer, and Treasurer
Jean Hu joined AMD in January 2023. Before joining AMD, she served as CFO of Marvell Technology Group Ltd. from August 2016 to January 2023. She also held CFO roles at QLogic Corporation from April 2011 to August 2016 and served as acting CEO of QLogic from May 2013 to February 2014 and from August 2015 to August 2016. Additionally, she was CFO and Senior Vice President, Business Development at Conexant Systems, Inc. from 2004 to 2011. She serves on the board of directors at Fortinet.
Mark Papermaster, Executive Vice President and Chief Technology Officer
Mark Papermaster joined AMD in October 2011 and is responsible for the company's technical direction and product development, including leading the development of the "Zen" CPU architecture. Before AMD, he was the leader of Cisco's Silicon Engineering Group (2010-2011), Senior Vice President of Devices Hardware Engineering at Apple Inc. for iPod and iPhone products (2008-2010), and held multiple leadership roles at IBM for 26 years (1982-2008), involved in PowerPC technology development and the blade server division.
Rick Bergman, Executive Vice President of Computing and Graphics
Rick Bergman is currently AMD's Executive Vice President of Computing and Graphics, a role he returned to in 2019. He initially joined AMD in 2006 following its acquisition of ATI Technologies. From 2011 to 2019, he served as President and CEO of Synaptics. Before ATI, he held senior management positions at S3 Graphics, Texas Instruments, and IBM. He also served on the board of Maxwell Technologies from 2015 until its acquisition by Tesla in 2019 and was President and CEO of Kymeta Corporation from April 2024 to November 2025.
Victor Peng, President, Adaptive and Embedded Computing Group
Victor Peng rejoined AMD in 2022 as President, Adaptive and Embedded Computing Group, following AMD's acquisition of Xilinx. He previously served as President and CEO of Xilinx from 2018 to 2022, and prior to that, was COO and Executive Vice President & General Manager of Products at Xilinx. Before joining Xilinx in 2008, Peng worked at AMD as Corporate Vice President of the graphics products group silicon engineering. He has held executive and engineering leadership roles at TZero Technologies, MIPS Technologies, Silicon Graphics (SGI), and Digital Equipment Corporation. He announced his retirement from his presidential role at AMD effective August 30, 2024, continuing in an advisory capacity. In February 2025, he joined the Board of Directors of Microchip Technology, and he has also served on the Board of Directors of KLA Corporation since 2019.
AI Analysis | Feedback
Advanced Micro Devices (AMD) faces several key risks to its business, primarily stemming from the highly competitive nature of the semiconductor industry, cyclical demand for certain products, and its manufacturing model.
- Intense Competition and Rapid Technological Obsolescence: AMD operates in highly competitive markets for microprocessors (CPUs) and graphics processing units (GPUs), where it directly competes with established giants like Intel and NVIDIA. AMD's success relies heavily on its ability to continuously innovate and introduce new products with superior features and performance on a timely basis. Failure to keep pace with technological advancements, particularly in critical areas like AI accelerators where NVIDIA holds a dominant position with its CUDA software ecosystem, could lead to a loss of market share and reduced revenue. Intel's aggressive product roadmaps also pose a constant threat in the client and server CPU segments.
- Decline in Gaming Segment Revenue due to Maturing Console Cycles and Customer Concentration: A significant portion of AMD's semi-custom System-on-Chip (SoC) revenue is derived from providing processors for game consoles such as the Sony PlayStation and Microsoft Xbox. These console markets are cyclical, and as current console generations mature, demand for these SoCs naturally declines, leading to a contraction in AMD's gaming segment revenue. AMD's reliance on a limited number of key customers for these high-volume semi-custom products makes it vulnerable to fluctuations in console sales and potential shifts in supplier choices by these manufacturers. For instance, the gaming segment experienced a significant year-over-year decline in revenue in early 2024 due to waning demand as consoles entered their fifth year in the market.
- Dependence on Third-Party Manufacturing and Supply Chain Disruptions: Advanced Micro Devices operates a fabless business model, meaning it relies on third-party foundries, primarily Taiwan Semiconductor Manufacturing Company (TSMC), for the manufacturing of its chips. This dependence exposes AMD to risks related to manufacturing capacity constraints, potential production issues at these foundries, and broader global supply chain disruptions. Such issues can lead to product shortages, delays in bringing new products to market, increased costs, and ultimately, an inability to meet customer demand, thereby negatively impacting revenue and profitability.
AI Analysis | Feedback
The clear emerging threats for Advanced Micro Devices (AMD) are:
- The increasing trend among major customers, particularly public cloud service providers, to design and develop their own custom silicon (CPUs and AI accelerators) for their data centers. This strategic shift directly threatens AMD's market share and revenue from its EPYC server processors and Instinct accelerators by reducing reliance on external vendors for these critical components.
- The growing adoption and performance capabilities of ARM-based processors in core AMD markets, specifically for desktop personal computers, notebooks, and servers. The success of ARM-based solutions like Apple Silicon and the push by other companies into Windows on ARM, alongside the increasing use of ARM server processors by cloud providers, presents a fundamental architectural challenge to AMD's predominant x86 offerings in these segments.
AI Analysis | Feedback
Advanced Micro Devices (AMD) participates in several large and growing addressable markets for its main products and services:
-
Computing and Graphics Segment:
- Processors for Desktop and Notebook Personal Computers (CPUs): The global PC Processor Market was valued at approximately USD 120.15 billion in 2024 and is projected to reach USD 168.26 billion by 2032, growing at a Compound Annual Growth Rate (CAGR) of 4.3%.
- Discrete and Integrated Graphics Processing Units (GPUs) for PCs: The global discrete GPU market was valued at USD 11.71 billion in 2023 and is anticipated to reach USD 18.67 billion by 2032, expanding at a CAGR of 6.5%. The broader global Graphics Card Market, which includes both discrete and integrated, was valued at USD 23.57 billion in 2025 and is projected to grow to USD 97.4 billion by 2034, exhibiting a CAGR of 17.0%. The overall global GPU market is projected to expand from USD 82.99 billion in 2025 to USD 325.96 billion by 2031, registering a CAGR of 25.61%.
-
Enterprise, Embedded and Semi-Custom Segment:
- Data Center and Professional GPUs (Accelerators): AMD projects the overall data center total addressable market (TAM) to reach USD 1 trillion by 2030 globally, growing from an estimated USD 200 billion in 2025 at a CAGR of over 40%. Specifically for AI accelerators, AMD estimates this market will exceed USD 526 billion by 2028 globally. Other reports suggest the global data center accelerator market was estimated at USD 68.0 billion in 2024 and is projected to reach USD 393.8 billion by 2030, with a CAGR of 34.0%.
- Server and Embedded Processors: The global CPU for Server market was valued at USD 21.45 billion in 2024 and is projected to grow to USD 33.26 billion by 2031, exhibiting a CAGR of 6.2%. Another estimate for the global Server Microprocessor Market is USD 24.0 billion in 2025, expected to reach USD 43.0 billion by 2035 at a CAGR of 6.0%. For embedded solutions, AMD has secured over USD 50 billion in design wins since 2022 for its adaptive and embedded portfolio, which also includes semi-custom solutions.
- Semi-Custom System-on-Chip (SoC) products (Game Consoles): AMD provides custom chips for leading game consoles such as the Sony PlayStation and Microsoft Xbox. AMD has powered over one billion gaming devices, including game consoles, with its processors and graphics from 2008 to 2025. The value of AMD's secured semi-custom designs for various customers, including those in gaming, has been reported as $15 billion since 2022.
AI Analysis | Feedback
Advanced Micro Devices (AMD) is expected to drive future revenue growth over the next 2-3 years through several key areas:
- Accelerated Demand for Data Center AI Processors (Instinct GPUs): AMD anticipates significant growth from its Instinct MI300 series GPUs, including the MI350, MI450, and future MI500 series, which are designed for artificial intelligence and high-performance computing. The company expects its data center AI revenues to achieve a compound annual growth rate (CAGR) of over 80% in the next 3-5 years. This growth is fueled by substantial multi-year deals with major hyperscalers, such as Meta Platforms, which is poised to deploy up to 6 gigawatts (GW) of Instinct GPUs, and a partnership with OpenAI to deploy 6 GW of chips starting in the second half of 2026. AMD's strategy to foster an open software ecosystem with ROCm 7 is also aimed at reducing developer switching costs from competitors.
- Expansion and Market Share Gains in Server CPUs (EPYC Processors): AMD's EPYC server processors are a crucial driver, benefiting from strong demand and an expanding market. The company aims to achieve more than 50% server CPU revenue market share. The overall server CPU market is projected to grow by strong double digits in 2026, with AI-driven CPU workloads contributing significantly to this expansion, projected to fuel an 18% annual growth rate by 2030. Next-generation EPYC CPUs, such as "Turin" (based on Zen 5 architecture) and "Venice" (2nm), are expected to further bolster market share gains in cloud and enterprise environments.
- Growth in the Client and Gaming Segments: AMD expects to achieve a greater than 10% revenue CAGR across its Client and Gaming businesses. The client business, driven by AMD Ryzen processors, experienced 34% year-over-year growth in Q4 2025. AMD projects it will exceed 40% client revenue market share. The introduction of new Ryzen processors featuring integrated AI accelerators, such as the Ryzen 8000 series and upcoming "Strix Point," is set to capitalize on the emerging "AI PC" market, contributing to continued growth in 2026 despite potential broader market contractions.
- Diversification and Expansion in the Embedded Segment: The Embedded segment, encompassing adaptive SoCs, FPGAs, embedded x86 processors, and semi-custom silicon, returned to growth in Q4 2025. AMD anticipates a greater than 10% revenue CAGR for this segment and aims to exceed 70% revenue market share. The company plans to expand opportunities by growing its embedded x86 and semi-custom silicon markets, with automotive AI identified as a multi-billion dollar growth opportunity.
AI Analysis | Feedback
Share Repurchases
- In May 2025, Advanced Micro Devices (AMD) authorized a new $6 billion share repurchase program. This increased the total repurchase authority to approximately $10 billion, adding to the remaining balance of its existing program.
- AMD repurchased $1.3 billion in stock in 2025. As of December 27, 2025, approximately $9.4 billion remained available for future stock repurchases under the program.
- In February 2022, AMD approved a new $8 billion share repurchase program, building on a $4 billion program announced in May 2021. Under the May 2021 program, approximately $3 billion of shares had been repurchased.
Share Issuance
- As part of the ZT Systems acquisition in March and October 2025, AMD issued 9.1 million shares of its common stock.
- In February 2026, AMD issued Meta Platforms a performance-based warrant for up to 160 million shares of AMD common stock, structured to vest as specific milestones associated with Instinct GPU shipments are achieved under their strategic partnership.
- AMD issued a warrant to OpenAI in October 2025 to purchase up to an aggregate of 160 million shares of AMD's common stock at an exercise price of $0.01 per share, contingent on certain GPU purchase milestones and stock performance.
Outbound Investments
- AMD completed the acquisition of ZT Systems in March and October 2025, which involved a total of $2.0 billion in cash (net of cash acquired) and the issuance of 9.1 million shares of common stock, aimed at strengthening AI infrastructure.
- In February 2026, AMD announced a strategic investment of $150 million in Nutanix common stock and up to $100 million for joint engineering initiatives, as part of a multi-year strategic partnership to develop an open and scalable platform for enterprise AI.
- AMD made several acquisitions to bolster its AI capabilities, including Nod.ai (October 2023) for open-source AI software, Silo AI (July 2024, for $665 million) for AI model development, and Mipsology (August 2023) for AI inference software.
Capital Expenditures
- AMD's capital expenditures for fiscal year 2025 reached $974 million, marking a peak in the last five years.
- The average capital expenditures for fiscal years 2021 to 2025 was $581.4 million. Capital expenditures increased annually from $301 million in 2021 to $974 million in 2025.
- Expected capital expenditures for the upcoming fiscal year (2026) are projected to be approximately $1,371.6 million, supporting increased investments in product development, AI solutions, and go-to-market strategies.

Peer Outperformance in Semiconductors
| Industry | Names | 1Y med | 3Y med | 5Y med | Top 3 by 5Y |
|---|---|---|---|---|---|
| Electronic Manufacturing Services | 10 | -4.5% | 87.9% | 147.0% | FLEX 399% · TTMI 335% · JBL 268% |
| Technology Distributors | 9 | 41.5% | 40.5% | 44.9% | AVT 115% · SNX 101% · CNXN 68% |
| Semiconductor Materials & Equipment | 28 | 19.0% | 38.5% | 18.3% | AXTI 298% · KLAC 227% · LRCX 219% |
| Communications Equipment | 36 | -6.2% | 75.3% | 17.2% | AAOI 700% · LITE 446% · ANET 380% |
| Electronic Components | 24 | 3.9% | 54.9% | 16.5% | CLS 1768% · BELFA 923% · APH 268% |
| Electronic Equipment & Instruments | 27 | -7.8% | 26.6% | 4.8% | PI 107% · OSIS 100% · CXT 61% |
| Semiconductors ← | 55 | -6.9% | 28.4% | -15.7% | MU 822% · NVDA 513% · AVGO 470% |
| Technology Hardware, Storage & Peripherals | 21 | -9.8% | 50.3% | -27.4% | WDC 540% · DELL 520% · SMCI 481% |
| Internet Services & Infrastructure | 6 | -1.5% | 35.3% | -29.3% | GDDY 65% · VRSN 37% · AKAM -27% |
| IT Consulting & Other Services | 30 | -22.2% | -1.8% | -32.0% | APLD 222% · IBM 142% · GIB -9% |
| Application Software | 125 | -11.5% | -10.1% | -49.9% | PLTR 496% · AGYS 140% · FROG 91% |
| Systems Software | 70 | -11.3% | 19.3% | -56.2% | ZETA 220% · CRWD 218% · CVLT 132% |
Latest Trefis Analyses
Research & Analysis
Invest in Strategies
Wealth Management
Peer Comparisons
| Peers to compare with: |
Financials
| Median | |
|---|---|
| Name | |
| Mkt Price | 171.31 |
| Mkt Cap | 480.4 |
| Rev LTM | 52,664 |
| Op Inc LTM | 8,354 |
| FCF LTM | 7,854 |
| FCF 3Y Avg | 7,782 |
| CFO LTM | 14,308 |
| CFO 3Y Avg | 12,192 |
Growth & Margins
| Median | |
|---|---|
| Name | |
| Rev Chg LTM | 36.2% |
| Rev Chg 3Y Avg | 24.2% |
| Rev Chg Q | 40.6% |
| QoQ Delta Rev Chg LTM | 9.2% |
| Op Inc Chg LTM | 137.1% |
| Op Inc Chg 3Y Avg | 151.3% |
| Op Mgn LTM | 18.9% |
| Op Mgn 3Y Avg | 17.8% |
| QoQ Delta Op Mgn LTM | 1.6% |
| CFO/Rev LTM | 27.5% |
| CFO/Rev 3Y Avg | 28.2% |
| FCF/Rev LTM | 19.1% |
| FCF/Rev 3Y Avg | 23.9% |
Valuation
| Median | |
|---|---|
| Name | |
| Mkt Cap | 480.4 |
| P/S | 13.9 |
| P/Op Inc | 39.4 |
| P/EBIT | 25.9 |
| P/E | 30.0 |
| P/CFO | 34.0 |
| Total Yield | 3.0% |
| Dividend Yield | 0.2% |
| FCF Yield 3Y Avg | 1.9% |
| D/E | 0.0 |
| Net D/E | 0.0 |
Returns
| Median | |
|---|---|
| Name | |
| 1M Rtn | -29.4% |
| 3M Rtn | -22.6% |
| 6M Rtn | -17.0% |
| 12M Rtn | 16.1% |
| 3Y Rtn | 211.0% |
| 1M Excs Rtn | -27.4% |
| 3M Excs Rtn | -23.2% |
| 6M Excs Rtn | -21.9% |
| 12M Excs Rtn | 4.5% |
| 3Y Excs Rtn | 145.0% |
Comparison Analyses
Segment Financials
Revenue by Segment| $ Mil | 2025 | 2024 | 2023 | 2022 | 2021 |
|---|---|---|---|---|---|
| Data Center | 16,635 | 12,579 | 6,496 | 6,043 | 3,694 |
| Client | 10,640 | 7,054 | 4,651 | 6,201 | 6,887 |
| Gaming | 3,910 | 2,595 | 6,212 | 6,805 | 5,607 |
| Embedded | 3,454 | 3,557 | 5,321 | 4,552 | 246 |
| Total | 34,639 | 25,785 | 22,680 | 23,601 | 16,434 |
| $ Mil | 2025 | 2024 | 2023 | 2022 | 2021 |
|---|---|---|---|---|---|
| Data Center | 3,603 | 3,482 | 1,267 | 1,848 | 991 |
| Client and Gaming | 2,855 | 1,187 | 925 | ||
| Embedded | 1,243 | 1,421 | 2,628 | 2,252 | 44 |
| All Other | -4,007 | -4,190 | -4,419 | -4,979 | -409 |
| Client | 1,190 | 2,088 | |||
| Gaming | 953 | 934 | |||
| Total | 3,694 | 1,900 | 401 | 1,264 | 3,648 |
| $ Mil | 2002 | 2001 | 2000 | 1998 |
|---|---|---|---|---|
| Core products | 5,619 | 5,647 | ||
| Core Products | 5,506 | |||
| AMD | 4,118 | |||
| Vantis | 135 | |||
| Total | 5,619 | 5,647 | 5,506 | 4,253 |
Price Behavior
| Market Price | $404.40 | |
| Market Cap ($ Bil) | 661.6 | |
| First Trading Date | 03/21/1983 | |
| Distance from 52W High | -37.7% | |
| 50 Days | 200 Days | |
| DMA Price | $547.37 | $415.00 |
| DMA Trend | up | up |
| Distance from DMA | -26.1% | -2.6% |
| 3M | 1YR | |
| Volatility | 68.6% | 71.5% |
| Downside Capture | 261.31 | 288.44 |
| Upside Capture | 285.39 | 328.14 |
| Correlation (S&P 500) | 51.8% | 59.4% |
| 1M | 2M | 3M | 6M | 1Y | 3Y | |
|---|---|---|---|---|---|---|
| Beta | 4.91 | 3.93 | 3.39 | 4.20 | 3.30 | 2.35 |
| Up Beta | 3.61 | 5.84 | 4.14 | 6.24 | 3.70 | 2.38 |
| Down Beta | 6.39 | 7.16 | 6.10 | 3.98 | 3.26 | 2.00 |
| Up Capture | 326% | 353% | 300% | 754% | 1204% | 7166% |
| Bmk +ve Days | 12 | 18 | 28 | 62 | 130 | 427 |
| Stock +ve Days | 10 | 23 | 35 | 66 | 135 | 391 |
| Down Capture | 473% | 206% | 216% | 236% | 172% | 113% |
| Bmk -ve Days | 10 | 25 | 36 | 64 | 121 | 325 |
| Stock -ve Days | 12 | 20 | 29 | 60 | 116 | 359 |
[1] Upside and downside betas calculated using positive and negative benchmark daily returns respectively
Based On 1-Year Data
| Annualized Return | Annualized Volatility | Sharpe Ratio | Correlation with AMD | |
|---|---|---|---|---|
| AMD | 62.0% | 71.5% | 0.97 | - |
| Sector ETF (XLK) | 11.0% | 28.3% | 0.35 | 79.7% |
| Equity (SPY) | 9.5% | 13.6% | 0.41 | 63.7% |
| Gold (GLD) | 3.6% | 28.7% | 0.11 | 28.0% |
| Commodities (DBC) | 37.7% | 21.2% | 1.40 | -6.0% |
| Real Estate (VNQ) | 12.0% | 14.2% | 0.55 | -2.9% |
| Bitcoin (BTCUSD) | -20.8% | 43.3% | -0.42 | 29.9% |
Smart multi-asset allocation framework can stack odds in your favor. Learn How
Based On 5-Year Data
| Annualized Return | Annualized Volatility | Sharpe Ratio | Correlation with AMD | |
|---|---|---|---|---|
| AMD | 27.3% | 58.5% | 0.64 | - |
| Sector ETF (XLK) | 15.9% | 26.4% | 0.55 | 75.6% |
| Equity (SPY) | 11.3% | 17.3% | 0.48 | 65.3% |
| Gold (GLD) | 17.5% | 19.1% | 0.74 | 16.0% |
| Commodities (DBC) | 8.0% | 19.6% | 0.29 | 8.3% |
| Real Estate (VNQ) | 1.2% | 18.9% | -0.05 | 28.1% |
| Bitcoin (BTCUSD) | 5.9% | 51.5% | 0.29 | 30.6% |
Smart multi-asset allocation framework can stack odds in your favor. Learn How
Based On 10-Year Data
| Annualized Return | Annualized Volatility | Sharpe Ratio | Correlation with AMD | |
|---|---|---|---|---|
| AMD | 49.4% | 57.4% | 0.93 | - |
| Sector ETF (XLK) | 22.4% | 25.3% | 0.81 | 66.4% |
| Equity (SPY) | 14.9% | 18.0% | 0.70 | 56.9% |
| Gold (GLD) | 12.0% | 16.5% | 0.59 | 12.6% |
| Commodities (DBC) | 7.6% | 18.1% | 0.33 | 13.4% |
| Real Estate (VNQ) | 5.7% | 20.7% | 0.23 | 27.3% |
| Bitcoin (BTCUSD) | 61.3% | 66.2% | 1.01 | 17.6% |
Smart multi-asset allocation framework can stack odds in your favor. Learn How
Returns Analyses
Earnings Returns History
Updated 11/6/2026| Forward Returns | |||
|---|---|---|---|
| Earnings Date | 1D Returns | 5D Returns | 21D Returns |
| 11/3/2026 | 1.0% | ||
| 8/4/2026 | -7.0% | -8.5% | -11.9% |
| 5/5/2026 | 18.6% | 26.2% | 47.3% |
| 2/3/2026 | -17.3% | -11.8% | -17.6% |
| 11/4/2025 | 2.5% | -5.0% | -12.8% |
| 8/5/2025 | -6.4% | 0.4% | -7.2% |
| 5/6/2025 | 1.8% | 14.0% | 17.3% |
| 2/4/2025 | -6.3% | -7.0% | -17.3% |
| ... | |||
| SUMMARY STATS | |||
| # Positive | 10 | 9 | 11 |
| # Negative | 14 | 14 | 12 |
| Median Positive | 6.4% | 14.0% | 19.0% |
| Median Negative | -6.7% | -6.1% | -12.3% |
| Max Positive | 18.6% | 26.2% | 47.3% |
| Max Negative | -17.3% | -14.8% | -18.1% |
| Forward Returns | |||
|---|---|---|---|
| Earnings Date | 1D Returns | 5D Returns | 21D Returns |
| 11/3/2026 | 1.0% | ||
| 8/4/2026 | -7.0% | -8.5% | -11.9% |
| 5/5/2026 | 18.6% | 26.2% | 47.3% |
| 2/3/2026 | -17.3% | -11.8% | -17.6% |
| 11/4/2025 | 2.5% | -5.0% | -12.8% |
| 8/5/2025 | -6.4% | 0.4% | -7.2% |
| 5/6/2025 | 1.8% | 14.0% | 17.3% |
| 2/4/2025 | -6.3% | -7.0% | -17.3% |
| 10/29/2024 | -10.6% | -14.8% | -18.1% |
| 7/30/2024 | 4.4% | -6.0% | 5.7% |
| 4/30/2024 | -8.9% | -2.5% | 5.3% |
| 1/30/2024 | -2.5% | -2.4% | 11.9% |
| 10/31/2023 | 9.7% | 15.2% | 23.0% |
| 8/1/2023 | -7.0% | -3.7% | -9.4% |
| 5/2/2023 | -9.2% | 5.7% | 32.9% |
| 1/31/2023 | 12.6% | 14.3% | 7.0% |
| 10/6/2022 | -13.9% | -13.1% | -8.3% |
| 8/2/2022 | -1.2% | -3.8% | -14.5% |
| 5/3/2022 | 9.1% | -2.6% | 19.2% |
| 2/1/2022 | 5.1% | 9.8% | -4.1% |
| 10/26/2021 | -0.5% | 3.8% | 28.4% |
| 7/27/2021 | 7.6% | 23.7% | 19.0% |
| 4/27/2021 | -1.4% | -7.7% | -8.1% |
| 1/26/2021 | -6.2% | -6.2% | -13.0% |
| SUMMARY STATS | |||
| # Positive | 10 | 9 | 11 |
| # Negative | 14 | 14 | 12 |
| Median Positive | 6.4% | 14.0% | 19.0% |
| Median Negative | -6.7% | -6.1% | -12.3% |
| Max Positive | 18.6% | 26.2% | 47.3% |
| Max Negative | -17.3% | -14.8% | -18.1% |
SEC Filings
Expand for More| Report Date | Filing Date | Filing |
|---|---|---|
| 09/30/2026 | 11/04/2026 | 10-Q |
| 06/30/2026 | 08/05/2026 | 10-Q |
| 03/31/2026 | 05/06/2026 | 10-Q |
| 12/31/2025 | 02/04/2026 | 10-K |
| 09/30/2025 | 11/05/2025 | 10-Q |
| 06/30/2025 | 08/06/2025 | 10-Q |
| 03/31/2025 | 05/07/2025 | 10-Q |
| 12/31/2024 | 02/05/2025 | 10-K |
| 09/30/2024 | 10/30/2024 | 10-Q |
| 06/30/2024 | 07/31/2024 | 10-Q |
| 03/31/2024 | 05/01/2024 | 10-Q |
| 12/31/2023 | 01/31/2024 | 10-K |
| 09/30/2023 | 11/01/2023 | 10-Q |
| 06/30/2023 | 08/02/2023 | 10-Q |
| 03/31/2023 | 05/03/2023 | 10-Q |
| 12/31/2022 | 02/27/2023 | 10-K |
| Report Date | Filing Date | Filing |
|---|---|---|
| 09/30/2026 | 11/04/2026 | 10-Q |
| 06/30/2026 | 08/05/2026 | 10-Q |
| 03/31/2026 | 05/06/2026 | 10-Q |
| 12/31/2025 | 02/04/2026 | 10-K |
| 09/30/2025 | 11/05/2025 | 10-Q |
| 06/30/2025 | 08/06/2025 | 10-Q |
| 03/31/2025 | 05/07/2025 | 10-Q |
| 12/31/2024 | 02/05/2025 | 10-K |
| 09/30/2024 | 10/30/2024 | 10-Q |
| 06/30/2024 | 07/31/2024 | 10-Q |
| 03/31/2024 | 05/01/2024 | 10-Q |
| 12/31/2023 | 01/31/2024 | 10-K |
| 09/30/2023 | 11/01/2023 | 10-Q |
| 06/30/2023 | 08/02/2023 | 10-Q |
| 03/31/2023 | 05/03/2023 | 10-Q |
| 12/31/2022 | 02/27/2023 | 10-K |
| 09/30/2022 | 11/02/2022 | 10-Q |
| 06/30/2022 | 08/03/2022 | 10-Q |
| 03/31/2022 | 05/04/2022 | 10-Q |
| 12/31/2021 | 02/03/2022 | 10-K |
| 09/30/2021 | 10/27/2021 | 10-Q |
| 06/30/2021 | 07/28/2021 | 10-Q |
| 03/31/2021 | 04/28/2021 | 10-Q |
| 12/31/2020 | 01/29/2021 | 10-K |
| 09/30/2020 | 10/28/2020 | 10-Q |
| 06/30/2020 | 07/29/2020 | 10-Q |
| 03/31/2020 | 04/29/2020 | 10-Q |
| 12/31/2019 | 02/04/2020 | 10-K |
Recent Forward Guidance
Updated 11/4/2026Latest: Q3 2026 Earnings Reported 11/3/2026
| Forward Guidance | Guidance Change | |||||||
|---|---|---|---|---|---|---|---|---|
| Metric | Source | Low | Mid | High | % Chg | % Delta | Change | Prior |
| Q4 2026 Revenue | Reported | 16.49 Bil | 17.00 Bil | 17.51 Bil | 30.8% | Higher New | Guidance: 13.00 Bil for Q3 2026 | |
| Q4 2026 Revenue Growth YoY | Reported | 66.0% | ||||||
| Q4 2026 Sequential Revenue Growth | Reported | 27.0% | ||||||
| Q4 2026 Non-GAAP Gross Margin | Reported | 55.0% | -1.0% | Lower New | Guidance: 56.0% for Q3 2026 | |||
| 2026 Projected Non-GAAP Tax Rate | Reported | 13.0% | ||||||
Prior: Q2 2026 Earnings Reported 8/4/2026
| Forward Guidance | Guidance Change | |||||||
|---|---|---|---|---|---|---|---|---|
| Metric | Source | Low | Mid | High | % Chg | % Delta | Change | Prior |
| Q3 2026 Revenue | Reported | 12.70 Bil | 13.00 Bil | 13.30 Bil | 16.1% | Higher New | Guidance: 11.20 Bil for Q2 2026 | |
| Q3 2026 Non-GAAP Gross Margin | Reported | 56.0% | 0.0% | Same New | Guidance: 56.0% for Q2 2026 | |||
Q1 2026 Earnings Reported 5/5/2026
| Forward Guidance | Guidance Change | |||||||
|---|---|---|---|---|---|---|---|---|
| Metric | Source | Low | Mid | High | % Chg | % Delta | Change | Prior |
| Q2 2026 Revenue | Reported | 10.90 Bil | 11.20 Bil | 11.50 Bil | 14.3% | Higher New | Guidance: 9.80 Bil for Q1 2026 | |
| Q2 2026 Gross Profit | Calculated | 6.10 Bil | 6.27 Bil | 6.44 Bil | Rev x Gross Margin | |||
| Q2 2026 Non-GAAP Gross Margin | Reported | 56.0% | 1.0% | Higher New | Guidance: 55.0% for Q1 2026 | |||
Q4 2025 Earnings Reported 2/3/2026
| Forward Guidance | Guidance Change | |||||||
|---|---|---|---|---|---|---|---|---|
| Metric | Source | Low | Mid | High | % Chg | % Delta | Change | Prior |
| Q1 2026 Revenue | Reported | 9.50 Bil | 9.80 Bil | 10.10 Bil | 2.1% | Higher New | Guidance: 9.60 Bil for Q4 2025 | |
| Q1 2026 Non-GAAP Gross Margin | Reported | 55.0% | 0.5% | Higher New | Guidance: 54.5% for Q4 2025 | |||
Insider Activity
Updated 10/19/2026| # | Owner | Title | Holding | Action | Filing Date | Price | Shares | Transacted Value | Value of Held Shares | Form |
|---|---|---|---|---|---|---|---|---|---|---|
| 1 | Norrod, Forrest Eugene | EVP & GM DSG | Direct | Sell | 10162026 | 540.70 | 17,262 | 9,333,585 | 191,038,952 | Form |
| 2 | Norrod, Forrest Eugene | EVP & GM DSG | Direct | Sell | 9162026 | 503.05 | 17,261 | 8,683,156 | 182,766,818 | Form |
| 3 | Su, Lisa T | Chair, President & CEO | Direct | Sell | 9112026 | 506.80 | 70,000 | 35,475,919 | 1,536,693,170 | Form |
| 4 | Su, Lisa T | Chair, President & CEO | Lisa Su and Daniel Lin Family Trust dated 11/3/2021 | Sell | 9112026 | 506.79 | 25,000 | 12,669,747 | 37,609,383 | Form |
| 5 | Hu, Jean X | EVP, CFO and Treasurer | Direct | Sell | 8262026 | 474.08 | 15,000 | 7,111,160 | 76,316,498 | Form |
| # | Owner | Title | Holding | Action | Filing Date | Price | Shares | Transacted Value | Value of Held Shares | Form |
|---|---|---|---|---|---|---|---|---|---|---|
| 1 | Norrod, Forrest Eugene | EVP & GM DSG | Direct | Sell | 10162026 | 540.70 | 17,262 | 9,333,585 | 191,038,952 | Form |
| 2 | Norrod, Forrest Eugene | EVP & GM DSG | Direct | Sell | 9162026 | 503.05 | 17,261 | 8,683,156 | 182,766,818 | Form |
| 3 | Su, Lisa T | Chair, President & CEO | Direct | Sell | 9112026 | 506.80 | 70,000 | 35,475,919 | 1,536,693,170 | Form |
| 4 | Su, Lisa T | Chair, President & CEO | Lisa Su and Daniel Lin Family Trust dated 11/3/2021 | Sell | 9112026 | 506.79 | 25,000 | 12,669,747 | 37,609,383 | Form |
| 5 | Hu, Jean X | EVP, CFO and Treasurer | Direct | Sell | 8262026 | 474.08 | 15,000 | 7,111,160 | 76,316,498 | Form |
| 6 | Norrod, Forrest Eugene | EVP & GM DSG | Direct | Sell | 8252026 | 459.95 | 17,261 | 7,939,159 | 171,706,325 | Form |
| 7 | Papermaster, Mark D | Chief Technology Officer & EVP | Direct | Sell | 8212026 | 471.87 | 28,811 | 13,595,067 | 595,246,514 | Form |
| 8 | Su, Lisa T | Chair, President & CEO | Direct | Sell | 8202026 | 480.94 | 15,000 | 7,214,067 | 1,491,944,152 | Form |
| 9 | Hahn, Ava | SVP, GC & Corporate Secretary | Direct | Sell | 8192026 | 488.69 | 2,993 | 1,462,649 | 13,010,394 | Form |
| 10 | Grasby, Paul Darren | EVP & CSO | Direct | Sell | 8182026 | 514.91 | 15,000 | 7,723,650 | 60,598,213 | Form |
| 11 | Papermaster, Mark D | Chief Technology Officer & EVP | Direct | Sell | 8182026 | 487.34 | 7,369 | 3,591,208 | 604,958,047 | Form |
| 12 | Hahn, Ava | SVP, GC & Corporate Secretary | Direct | Sell | 8122026 | 474.75 | 143 | 67,889 | 8,376,489 | Form |
| 13 | Papermaster, Mark D | Chief Technology Officer & EVP | Direct | Sell | 7162026 | 556.43 | 6,000 | 3,338,580 | 686,460,457 | Form |
| 14 | Papermaster, Mark D | Chief Technology Officer & EVP | Direct | Sell | 6172026 | 536.33 | 6,000 | 3,217,980 | 661,663,349 | Form |
| 15 | Su, Lisa T | Chair, President & CEO | Direct | Sell | 6122026 | 460.69 | 125,000 | 57,585,715 | 1,334,559,991 | Form |
| 16 | Denzel, Nora | Direct | Sell | 6022026 | 522.00 | 8,626 | 4,502,772 | 45,504,306 | Form | |
| 17 | Denzel, Nora | Direct | Sell | 6022026 | 522.00 | 1,821 | 950,562 | 50,007,078 | Form | |
| 18 | Norrod, Forrest Eugene | EVP & GM DESG | Direct | Sell | 5212026 | 431.40 | 19,487 | 8,406,784 | 140,002,483 | Form |
| 19 | Papermaster, Mark D | Chief Technology Officer & EVP | Direct | Sell | 5192026 | 433.79 | 6,000 | 2,602,740 | 535,161,084 | Form |
| 20 | Su, Lisa T | Chair, President & CEO | Direct | Sell | 5152026 | 445.51 | 125,000 | 55,688,359 | 1,346,276,778 | Form |
| 21 | Grasby, Paul Darren | EVP & CSO | Direct | Sell | 5112026 | 444.39 | 24,376 | 10,832,451 | 46,759,605 | Form |
| 22 | Papermaster, Mark D | Chief Technology Officer & EVP | Direct | Sell | 4282026 | 350.00 | 31,320 | 10,962,000 | 432,612,950 | Form |
| 23 | Papermaster, Mark D | Chief Technology Officer & EVP | Direct | Sell | 4162026 | 275.00 | 27,109 | 7,454,975 | 348,523,175 | Form |
| 24 | Papermaster, Mark D | Chief Technology Officer & EVP | Direct | Sell | 4162026 | 255.54 | 6,000 | 1,533,240 | 330,787,842 | Form |
| 25 | Papermaster, Mark D | Chief Technology Officer & EVP | Direct | Sell | 4082026 | 225.00 | 3,293 | 740,925 | 291,254,850 | Form |
| 26 | Su, Lisa T | Chair, President & CEO | Direct | Sell | 3162026 | 198.77 | 85,000 | 16,895,157 | 625,320,780 | Form |
| 27 | Grasby, Paul Darren | EVP & CSO | Direct | Sell | 3122026 | 204.87 | 7,500 | 1,536,525 | 26,550,742 | Form |
| 28 | Papermaster, Mark D | Chief Technology Officer & EVP | Direct | Sell | 3052026 | 200.00 | 3,034 | 606,800 | 259,551,800 | Form |
| 29 | Hahn, Ava | SVP, GC & Corporate Secretary | Direct | Sell | 2192026 | 198.65 | 286 | 56,814 | 3,419,958 | Form |
| 30 | Hu, Jean X | EVP, CFO and Treasurer | Direct | Sell | 2182026 | 201.62 | 19,956 | 4,023,581 | 5,030,081 | Form |
| 31 | Norrod, Forrest Eugene | EVP & GM DESG | Direct | Sell | 2122026 | 216.81 | 19,450 | 4,216,969 | 62,679,548 | Form |
| 32 | Su, Lisa T | Chair, President & CEO | Direct | Sell | 2122026 | 214.36 | 125,000 | 26,794,875 | 675,761,605 | Form |
| 33 | Hahn, Ava | SVP, GC & Corporate Secretary | Direct | Sell | 1202026 | 234.42 | 2,442 | 572,454 | 3,834,877 | Form |
| 34 | Su, Lisa T | Chair, President & CEO | Direct | Sell | 12122025 | 215.14 | 125,000 | 26,891,905 | 705,100,585 | Form |
| 35 | Grasby, Paul Darren | EVP & CSO | Direct | Sell | 12082025 | 218.77 | 10,000 | 2,187,700 | 29,171,667 | Form |
| 36 | Hu, Jean X | EVP, CFO and Treasurer | Direct | Sell | 11252025 | 209.96 | 14,506 | 3,045,741 | 5,360,806 | Form |
| 37 | Norrod, Forrest Eugene | EVP & GM DESG | Direct | Sell | 11212025 | 229.37 | 19,450 | 4,461,296 | 68,891,587 | Form |
| 38 | Papermaster, Mark D | Chief Technology Officer & EVP | Direct | Sell | 11172025 | 240.12 | 17,108 | 4,107,935 | 411,683,151 | Form |
| 39 | Papermaster, Mark D | Chief Technology Officer & EVP | Direct | Sell | 10162025 | 224.28 | 16,800 | 3,767,863 | 384,524,964 | Form |
| 40 | Hahn, Ava | SVP, GC & Corporate Secretary | Direct | Sell | 10072025 | 226.01 | 2,868 | 648,197 | 2,041,548 | Form |
Investor Activity (13F)
Updated Nov 6, 2026Active managers (13F portfolio over $250M, at least 3 holdings) with a position over $5M that is either over 10% of their portfolio or held in a concentrated book of 50 or fewer total positions. Index/ETF, sovereign, bank, community-bank and charitable/donor-advised filers are excluded.
| Active Manager | Value | % of Portfolio | Total Positions | QoQ | Filing |
|---|---|---|---|---|---|
| Ossiam | $808.3 Mil | 14.2% | 388 | ADD +39.7% | 13F |
| Dream Peak Capital Ltd | $91.5 Mil | 13.6% | 6 | New | 13F |
| Light Street Capital Management, LLC | $44.6 Mil | 9.0% | 23 | Hold | 13F |
| Once Capital Management, LLC | $25.5 Mil | 6.8% | 22 | Hold | 13F |
| ADAPT Investment Managers SA | $19.0 Mil | 6.5% | 34 | New | 13F |
| Columbus Hill Capital Management, L.P. | $36.5 Mil | 6.2% | 21 | ADD +42.8% | 13F |
| Soma Equity Partners LP | $79.1 Mil | 5.8% | 20 | TRIM -25.3% | 13F |
| Estuary Capital Management LP | $34.5 Mil | 5.8% | 22 | Hold | 13F |
| Eminence Capital, LP | $239.4 Mil | 5.5% | 33 | ADD +21.5% | 13F |
| Firetrail Investments PTY LTD | $15.5 Mil | 5.3% | 28 | Hold | 13F |
| Nepsis Inc. | $15.7 Mil | 5.3% | 29 | Hold | 13F |
| Generali Powszechne Towarzystwo Emerytalne | $28.5 Mil | 5.0% | 28 | Hold | 13F |
| Vienna Powszechne Towarzystwo Emerytalne S.A. Vienna Insurance Group | $12.4 Mil | 4.7% | 28 | TRIM -42.0% | 13F |
| Southpoint Capital Advisors LP | $183.1 Mil | 3.8% | 41 | ADD +50.0% | 13F |
| Glenview Capital Management, LLC | $132.4 Mil | 3.6% | 41 | ADD +65.1% | 13F |
| Tairen Capital Ltd | $32.6 Mil | 3.5% | 44 | New | 13F |
| California First Leasing Corp | $11.0 Mil | 3.5% | 39 | Hold | 13F |
| Ithaka Group LLC | $15.9 Mil | 3.3% | 38 | Hold | 13F |
| SRS Investment Management, LLC | $293.5 Mil | 3.1% | 29 | TRIM -11.8% | 13F |
| FengHe Fund Management Pte. Ltd. | $21.6 Mil | 3.0% | 31 | New | 13F |
| Bender Robert & Associates | $12.4 Mil | 3.0% | 45 | Hold | 13F |
| Milestones Administradora de Recursos Ltda. | $10.4 Mil | 2.7% | 17 | ADD +15.6% | 13F |
| Nishkama Capital, LLC | $19.0 Mil | 2.7% | 39 | New | 13F |
| KADENSA CAPITAL Ltd | $18.9 Mil | 2.6% | 39 | New | 13F |
| Kinetic Partners Management, LP | $47.0 Mil | 2.6% | 49 | ADD +133.8% | 13F |
| Active Manager | Value | % of Portfolio | Total Positions | QoQ | Filing |
|---|---|---|---|---|---|
| Evergreen Quality Fund GP, Ltd. | $107.2 Mil | 2.5% | 40 | New | 13F |
| Dream Peak Capital Ltd | $91.5 Mil | 13.6% | 6 | New | 13F |
| Tairen Capital Ltd | $32.6 Mil | 3.5% | 44 | New | 13F |
| CTC LLC | $32.2 Mil | 2.6% | 25 | New | 13F |
| FengHe Fund Management Pte. Ltd. | $21.6 Mil | 3.0% | 31 | New | 13F |
| Nishkama Capital, LLC | $19.0 Mil | 2.7% | 39 | New | 13F |
| ADAPT Investment Managers SA | $19.0 Mil | 6.5% | 34 | New | 13F |
| KADENSA CAPITAL Ltd | $18.9 Mil | 2.6% | 39 | New | 13F |
| Kinetic Partners Management, LP | $47.0 Mil | 2.6% | 49 | ADD +133.8% | 13F |
| Glenview Capital Management, LLC | $132.4 Mil | 3.6% | 41 | ADD +65.1% | 13F |
| Southpoint Capital Advisors LP | $183.1 Mil | 3.8% | 41 | ADD +50.0% | 13F |
| Columbus Hill Capital Management, L.P. | $36.5 Mil | 6.2% | 21 | ADD +42.8% | 13F |
| Ossiam | $808.3 Mil | 14.2% | 388 | ADD +39.7% | 13F |
| Eminence Capital, LP | $239.4 Mil | 5.5% | 33 | ADD +21.5% | 13F |
| Milestones Administradora de Recursos Ltda. | $10.4 Mil | 2.7% | 17 | ADD +15.6% | 13F |
| Active Manager | Value | % of Portfolio | Total Positions | QoQ | As Of | Filing |
|---|---|---|---|---|---|---|
| RK Capital Management, LLC/FL | $77.1 Mil | 4.8% | 20 | Exited | Dec 31, 2025 | 13F |
| Appaloosa LP | $69.6 Mil | 1.0% | 38 | Exited | Dec 31, 2025 | 13F |
| Long Walk Management LP | $28.8 Mil | 6.4% | 10 | Exited | Dec 31, 2025 | 13F |
| Fund 1 Investments, LLC | $18.7 Mil | 2.7% | 49 | Exited | Dec 31, 2025 | 13F |
| Nationale-Nederlanden Powszechne Towarzystwo Emerytalne S.A. | $10.9 Mil | 1.0% | 48 | Exited | Dec 31, 2025 | 13F |
| Benchstone Capital Management LP | $10.0 Mil | 1.1% | 43 | Exited | Dec 31, 2025 | 13F |
| Proem Advisors LLC | $7.5 Mil | 2.5% | 28 | Exited | Dec 31, 2025 | 13F |
| M & L Capital Management Ltd | $5.5 Mil | 1.2% | 25 | Exited | Dec 31, 2025 | 13F |
| Paloma Partners Management Co | $5.0 Mil | 1.7% | 47 | Exited | Dec 31, 2025 | 13F |
| Vienna Powszechne Towarzystwo Emerytalne S.A. Vienna Insurance Group | $12.4 Mil | 4.7% | 28 | TRIM -42.0% | Mar 31, 2026 | 13F |
| Boothe Investment Group, Inc. | $6.2 Mil | 2.0% | 40 | TRIM -39.5% | Mar 31, 2026 | 13F |
| BSN CAPITAL PARTNERS Ltd | $51.8 Mil | 2.4% | 41 | TRIM -33.5% | Mar 31, 2026 | 13F |
| Soma Equity Partners LP | $79.1 Mil | 5.8% | 20 | TRIM -25.3% | Mar 31, 2026 | 13F |
| SRS Investment Management, LLC | $293.5 Mil | 3.1% | 29 | TRIM -11.8% | Mar 31, 2026 | 13F |
| Ratan Capital Management LP | $5.4 Mil | 2.0% | 37 | TRIM -11.0% | Mar 31, 2026 | 13F |
| Active Manager | Value | % of Portfolio | Total Positions | QoQ | Filing |
|---|---|---|---|---|---|
| Ossiam | $808.3 Mil | 14.2% | 388 | ADD +39.7% | 13F |
| SRS Investment Management, LLC | $293.5 Mil | 3.1% | 29 | TRIM -11.8% | 13F |
| Eminence Capital, LP | $239.4 Mil | 5.5% | 33 | ADD +21.5% | 13F |
| Southpoint Capital Advisors LP | $183.1 Mil | 3.8% | 41 | ADD +50.0% | 13F |
| Glenview Capital Management, LLC | $132.4 Mil | 3.6% | 41 | ADD +65.1% | 13F |
| Evergreen Quality Fund GP, Ltd. | $107.2 Mil | 2.5% | 40 | New | 13F |
| Dream Peak Capital Ltd | $91.5 Mil | 13.6% | 6 | New | 13F |
| Soma Equity Partners LP | $79.1 Mil | 5.8% | 20 | TRIM -25.3% | 13F |
| BSN CAPITAL PARTNERS Ltd | $51.8 Mil | 2.4% | 41 | TRIM -33.5% | 13F |
| Kinetic Partners Management, LP | $47.0 Mil | 2.6% | 49 | ADD +133.8% | 13F |
| Light Street Capital Management, LLC | $44.6 Mil | 9.0% | 23 | Hold | 13F |
| Columbus Hill Capital Management, L.P. | $36.5 Mil | 6.2% | 21 | ADD +42.8% | 13F |
| Estuary Capital Management LP | $34.5 Mil | 5.8% | 22 | Hold | 13F |
| Tairen Capital Ltd | $32.6 Mil | 3.5% | 44 | New | 13F |
| CTC LLC | $32.2 Mil | 2.6% | 25 | New | 13F |
| Generali Powszechne Towarzystwo Emerytalne | $28.5 Mil | 5.0% | 28 | Hold | 13F |
| Once Capital Management, LLC | $25.5 Mil | 6.8% | 22 | Hold | 13F |
| FengHe Fund Management Pte. Ltd. | $21.6 Mil | 3.0% | 31 | New | 13F |
| Nishkama Capital, LLC | $19.0 Mil | 2.7% | 39 | New | 13F |
| ADAPT Investment Managers SA | $19.0 Mil | 6.5% | 34 | New | 13F |
| KADENSA CAPITAL Ltd | $18.9 Mil | 2.6% | 39 | New | 13F |
| Ithaka Group LLC | $15.9 Mil | 3.3% | 38 | Hold | 13F |
| Nepsis Inc. | $15.7 Mil | 5.3% | 29 | Hold | 13F |
| Firetrail Investments PTY LTD | $15.5 Mil | 5.3% | 28 | Hold | 13F |
| Melqart Asset Management (UK) Ltd | $14.2 Mil | 1.4% | 41 | Hold | 13F |
AMD Trade Sentinel
High Conviction
CONVICTION RATIONALE
Conviction is high, anchored by management's guidance for revenue to grow more than 80% in 2027. This extraordinary outlook is supported by a flawless record of exceeding ambitious targets and accelerating demand in the Data Center segment, where revenue grew 97% year-over-year. The primary risk is the sheer scale of execution required to deliver on this plan.
STOCK ARCHETYPE
Cyclical Hardware / Capital EquipmentVolume of units sold per segment multiplied by the Average Selling Price (ASP) of those units. The mix shift towards high-margin Data Center products (EPYC CPUs and Instinct GPUs), which carry significantly higher profitability than the company's other segments.
INVESTMENT THESIS
Evidence suggests a profound business model transformation is successfully underway, with accelerating demand and strong execution.
- Management expects total revenue to grow more than 80% in 2027.
- Data Center segment revenue grew 97% year-over-year to $8.5 billion in Q3.
- The Data Center segment now comprises 64% of total revenue, up from 47% a year ago.
- In Q3, both cloud and enterprise server sales more than doubled year-over-year.
PRIMARY RISK
The company must execute a massive supply chain ramp to meet its ambitious 2027 targets while facing a dominant, entrenched competitor in the AI accelerator market.
- Management stated in Q3 that 'demand is higher than supply'.
- Inventory grew 56.7% year-over-year, outpacing revenue growth of 44.7%.
- Q4 gross margin is guided to decline sequentially to approximately 55%.
| KPI | Status | Rationale |
|---|---|---|
| Data Center Segment Revenue Growth | 97% year-over-year growth in Q3 2026 - Accelerating | The Data Center segment's growth has shown massive year-over-year acceleration throughout 2026, inflecting from 57% in Q1 to triple-digits in Q2 and maintaining a near-triple-digit pace in Q3. This highlights a structural shift in the business, with the segment now contributing 64% of total revenue. |
| Server CPU Revenue Growth | More than doubled year-over-year in Q3 2026 - Accelerating | Server CPU revenue growth has consistently accelerated through each quarter of 2026, with cloud and enterprise sales each growing more than 70% year-over-year in the latest period. Management attributes this to expanding deployments in cloud for AI workloads and record sell-through in the enterprise market. |
| Embedded Segment Design Wins | On track to close more than $18 billion (Full Year 2026) | Market rewards Achieving a third consecutive record year of design wins.. This KPI indicates future revenue potential for the Embedded segment, as design wins typically ramp into production over several years, providing long-term visibility. |
| Inventory vs. Revenue Growth Divergence | 12 percentage points (Q3 2026) | Inventory grew 56.7% YoY while revenue grew 44.7% YoY. A positive divergence indicates inventory is growing faster than sales, which can be a leading indicator of future margin pressure if demand falters, or can reflect a strategic build to support a large product ramp. |
Credible 2027 Guidance vs. Massive Execution Risk
BULL VIEW
Bulls believe management's flawless 'say-do' record of over-delivering on aggressive growth targets makes the outlook for over 80% growth in 2027 not just aspirational, but achievable.
CORE TENSION
Can management's execution, which drove server sales to double YoY, deliver on its >80% 2027 growth guide, or will supply constraints and competitive pressure prove insurmountable?
PREVAILING SENTIMENT
The latest evidence favors the bulls. Management has consistently exceeded its own ambitious, multi-quarter growth targets, lending significant credibility to its long-range forecast.
BEAR VIEW
Bears argue the 2027 guidance is too aggressive given supply constraints, a powerful incumbent competitor, and the financial strain of a massive inventory build to support the ramp.
| Timeline | Event & Metric To Watch |
|---|---|
this quarter | Venice CPU Systems Launch Watch: First OEM systems featuring EPYC Venice processors are on track for availability this quarter. |
this quarter | a recently discussed product Rack Systems Ship Watch: The first a recently discussed product systems are scheduled to ship this quarter. |
1/20/2027 | PC Market Weakness Watch: Intel's Q4 client results and Q1 outlook for an early read on PC market health and inventory levels. |
2/1/2027 | Gross Margin Disappointment Watch: Whether reported Q4 gross margin meets the lowered 55% guide and the direction of Q1 2027 guidance. |
2/2/2027 | Peer Qualcomm Earnings Report Watch: Peer Qualcomm (QCOM) is scheduled to report earnings. |
2/23/2027 | Competitive AI Headwinds Watch: NVIDIA's data center results, commentary on supply constraints, and outlook for its next-gen Vera Rubin platform. |
early 2027 | Venice Cloud Instances Rollout Watch: Cloud providers are planning instance rollouts for Venice processors. |
No set date | Growth Execution Failure Watch: News of supply chain disruptions, component shortages, or any downward revision to the aggressive 2027 growth targets. |
| Date | Event | Stock Impact |
|---|---|---|
2026-11-03 | Q4 Guidance Changes Disclosed Details: Company guidance for Q4 2026 Revenue was raised, but guidance for Q4 2026 Non-GAAP Gross Margin was lowered. | +4.7% $466.84 -> $488.78 |
2026-10-27 | Meta Strategic Partnership Advanced Details: AMD announced its Helios rackscale solutions are running at Meta and that AMD EPYC processors power Meta's Muse AI agent. | +8.9% $531.28 -> $578.44 |
2026-09-15 | ROCm on RISC-V Collaboration Details: | +3.9% $493.41 -> $512.50 |
2026-08-04 | Negative Post-Earnings Reaction Details: The stock had a two-day reaction of -1.0% around the earnings call dated 2026-08-04, versus 2.0% for the S&P 500. | -0.5% $484.64 -> $482.05 |
2026-07-23 | Helios Reference Design Released Details: Schneider Electric and AMD released the first Helios platform reference design to provide a blueprint for deploying high-density AI clusters, supporting 246 kW AI racks. | -5.5% $552.33 -> $521.95 |
2026-06-02 | Helios Platform Expansion Details: Supermicro expanded its rack-scale AI offerings with the AMD Helios platform, featuring a 72-GPU double-width rack powered by AMD Instinct MI455X GPUs. | +6.3% $510.13 -> $542.52 |
2026-05-21 | Venice CPU Production Ramp Details: AMD announced it began the production ramp of its 6th Gen AMD EPYC CPUs, codenamed “Venice,” on TSMC's 2nm process technology. | +4.5% $447.58 -> $467.51 |
Position Sizing
1% - 2%
MINIMAL POSITION
Sizing is volatility-based: AMD trades at roughly 60% annualized realized (three-month) volatility versus about 10% for the S&P 500 (6.1x the market). A 1% - 2% position keeps a single-name swing of that size within a diversified portfolio's risk budget.
Diversification Alternatives
NVDA - NVIDIA
AI Market LeaderNVIDIA has a dominant market position in AI accelerators, supported by its mature and proprietary CUDA software ecosystem which creates high switching costs. It also operates at a much higher gross margin of 55%.
INTC - Intel
Incumbent TurnaroundIntel offers exposure to a potential turnaround in the server and PC CPU markets from a much larger historical revenue base. The company is also investing heavily in its own manufacturing capabilities.
AMD is a data center-first company whose growth is now primarily driven by the AI infrastructure buildout, capitalizing on its leadership EPYC server CPUs and a rapidly scaling Instinct AI accelerator business.
The company has successfully transitioned from a PC/gaming-centric business to a dominant force in the data center. Its primary growth vectors are gaining share in the server CPU market, fueled by 'agentic AI' workloads, and capturing a significant portion of the AI accelerator market with its MI-series GPUs and Helios rack-scale systems. The PC and Embedded businesses provide diversification, but the investment thesis hinges on continued data center execution and scaling supply to meet demand.
Announcements of new multi-gigawatt scale customer deployments for Instinct GPUs and Helios systems; data showing continued server CPU market share gains against competitors; evidence of broader adoption for the ROCm open software stack.
Loss of a key hyperscale customer to a competitor or to in-house silicon; significant delays in the next-generation MI GPU roadmap; evidence that competitors are closing the performance-per-watt gap in server CPUs.
Short-term fluctuations in the consumer PC or gaming console markets, which are now a smaller part of the overall business.
Repricing Catalyst
The successful at-scale ramp of the Helios rack systems and MI-series GPUs through Q4 2026 and into 2027, which is expected to drive a significant acceleration in Data Center AI revenue.
Data Center
$16.6B TTM (48% of Total)What It Is
Sells AI accelerators (Instinct GPUs), server CPUs (EPYC), data processing units (DPUs), AI Network Interface Cards (AI NICs), and FPGAs to hyperscale data centers, cloud providers, original equipment manufacturers (OEMs), and enterprises.
Who Pays & How
Hyperscale cloud providers and large enterprises write the checks to power their infrastructure for AI, cloud services, and internal workloads. They choose AMD's EPYC CPUs for their performance and efficiency, especially for emerging 'agentic AI' workloads, and its Instinct GPUs as a competitive alternative for AI training and inference.
Competition
Client and Gaming
$10.6B TTM (31% of Total)What It Is
Sells CPUs (Ryzen) and chipsets for desktop and notebook PCs to OEMs and distributors. Sells discrete GPUs (Radeon) to add-in-board partners and OEMs. Sells semi-custom SoCs for game consoles to manufacturers like Sony and Microsoft.
Who Pays & How
PC OEMs (like HP and a business partner), distributors, and game console manufacturers pay for processors and graphics chips. End consumers indirectly drive demand. They choose AMD for performance in gaming and content creation, and increasingly for AI capabilities in commercial PCs.
Competition
Embedded
$3.5B TTM (10% of Total)What It Is
Sells embedded CPUs, APUs, FPGAs, and adaptive SoCs to a wide range of markets including aerospace and defense, automotive, industrial, communications, and healthcare.
Who Pays & How
Manufacturers of specialized equipment in various industries pay for highly reliable, and often low-power, processors for specific applications. They choose AMD for its broad portfolio of customizable and standard solutions that can speed time-to-market.
Competition
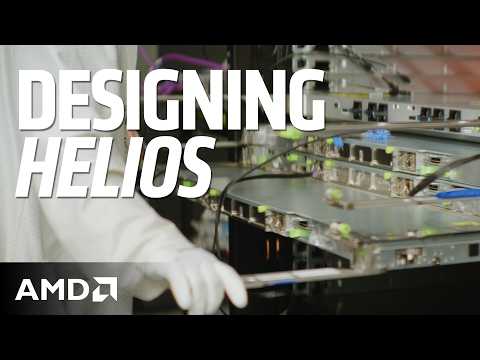
Advanced Micro Devices — Investor Video Playlist




Industry Resources
| Information Technology Resources |
| TechCrunch |
| Wired |
| CIO |
| MIT Technology Review |
| Gartner Insights |
| Ars Technica |
| Semiconductors Resources |
| EE Times |
| Semiconductor Engineering |
| Semiconductor Digest |
External Quote Links
| Y Finance | Barrons |
| TradingView | Morningstar |
| SeekingAlpha | ValueLine |
| Motley Fool | Robinhood |
| CNBC | Etrade |
| MarketWatch | Unusual Whales |
| YCharts | Perplexity Finance |
| FinViz |
Prefer one of these to Trefis? Tell us why.