
Astera Labs (ALAB)
Market Price (11/8/2026): $191.11 | Market Cap: $33.4 BilSector: Information Technology | Industry: Semiconductors
Astera Labs (ALAB)
Market Price (11/8/2026): $191.11Market Cap: $33.4 BilSector: Information TechnologyIndustry: Semiconductors
Investment Highlights Why It Matters Detailed financial logic regarding cash flow yields vs trend-riding momentum.
Strong revenue growthRev Chg LTMRevenue Change % Last Twelve Months (LTM) is 115% Attractive operating marginsOp Mgn LTMOperating Margin = Operating Income / Revenue Reflects profitability before taxes and before impact of capital structure (interest payments). is 26% Attractive cash flow generationCFO/Rev LTMCash Flow from Operations / Revenue (Sales), Last Twelve Months (LTM) is 28%, FCF/Rev LTMFree Cash Flow / Revenue (Sales), Last Twelve Months (LTM) is 22% Valuation becoming less expensiveP/S 6M Chg %Price/Sales change over 6 months. Declining P/S indicates valuation has become less expensive. is -69% Megatrend and thematic driversMegatrends include Artificial Intelligence. Themes include Data Centers & Infrastructure, and AI Chips. | Expensive valuation multiplesP/EBITPrice/EBIT or Price/(Operating Income) ratio is 84x, P/CFOPrice/(Cash Flow from Operations). CFO is cash before capital expenditures. is 76x, P/EPrice/Earnings or Price/(Net Income) is 72x Significant share based compensationSBC/Rev LTMShare Based Compensation / Revenue (Sales), Last Twelve Months (LTM) is 15% Yield minus risk free rate is negativeERPEquity Risk Premium (ERP) = Total Yield - Risk Free Rate, Reflects the premium above risk free assets offered by the investment. is -4.0% High stock price volatilityVol 12M is 101% Key risksALAB key risks include [1] a high concentration of major cloud and server OEM customers who could develop in-house or alternative solutions, Show more. |
| Strong revenue growthRev Chg LTMRevenue Change % Last Twelve Months (LTM) is 115% |
| Attractive operating marginsOp Mgn LTMOperating Margin = Operating Income / Revenue Reflects profitability before taxes and before impact of capital structure (interest payments). is 26% |
| Attractive cash flow generationCFO/Rev LTMCash Flow from Operations / Revenue (Sales), Last Twelve Months (LTM) is 28%, FCF/Rev LTMFree Cash Flow / Revenue (Sales), Last Twelve Months (LTM) is 22% |
| Valuation becoming less expensiveP/S 6M Chg %Price/Sales change over 6 months. Declining P/S indicates valuation has become less expensive. is -69% |
| Megatrend and thematic driversMegatrends include Artificial Intelligence. Themes include Data Centers & Infrastructure, and AI Chips. |
| Expensive valuation multiplesP/EBITPrice/EBIT or Price/(Operating Income) ratio is 84x, P/CFOPrice/(Cash Flow from Operations). CFO is cash before capital expenditures. is 76x, P/EPrice/Earnings or Price/(Net Income) is 72x |
| Significant share based compensationSBC/Rev LTMShare Based Compensation / Revenue (Sales), Last Twelve Months (LTM) is 15% |
| Yield minus risk free rate is negativeERPEquity Risk Premium (ERP) = Total Yield - Risk Free Rate, Reflects the premium above risk free assets offered by the investment. is -4.0% |
| High stock price volatilityVol 12M is 101% |
| Key risksALAB key risks include [1] a high concentration of major cloud and server OEM customers who could develop in-house or alternative solutions, Show more. |
Qualitative Assessment
AI Analysis | Feedback
Astera Labs (ALAB) stock has lost about 40% since 7/31/2026 because of the following key factors:
1. Analyst Downgrades and Price Target Reductions: Astera Labs experienced significant downward revisions from analysts, contributing to sharp stock declines. On November 5, 2026, TD Cowen lowered its price target from $300.00 to $225.00, maintaining a "hold" rating, which coincided with a 19.2% drop in shares. Other firms also adjusted their outlook, with Citigroup and Zacks Research cutting their ratings to "hold" in October 2026, and Susquehanna reducing its price objective from $310.00 to $258.00 with a "neutral" rating. Post-fiscal Q3 2026 earnings, Bank of America maintained a "Neutral" rating, citing valuation, customer concentration, competition, and potential growth normalization as concerns.
2. Valuation Concerns and Profit-Taking Amidst Broader Tech Sell-off: Despite reporting strong fiscal Q3 2026 results with revenue up 154% year-over-year to $584.9 million and adjusted EPS beating consensus, Astera Labs' shares, trading at a high forward price-to-earnings ratio of 54.59, were perceived as overvalued. This high valuation, coupled with the stock's 118% gain over the prior six months by August 2026, likely triggered substantial profit-taking. This trend was exacerbated by a "broad market pressure on technology stocks" and a general "AI Selloff" observed around November 2026, causing Astera Labs to drop 12.7% after hours on November 5, 2026, shedding approximately $4 billion in market value.
Show more
Astera Labs (ALAB) stock has lost about 40% since 7/31/2026 because of the following key factors:
1. Analyst Downgrades and Price Target Reductions: Astera Labs experienced significant downward revisions from analysts, contributing to sharp stock declines. On November 5, 2026, TD Cowen lowered its price target from $300.00 to $225.00, maintaining a "hold" rating, which coincided with a 19.2% drop in shares. Other firms also adjusted their outlook, with Citigroup and Zacks Research cutting their ratings to "hold" in October 2026, and Susquehanna reducing its price objective from $310.00 to $258.00 with a "neutral" rating. Post-fiscal Q3 2026 earnings, Bank of America maintained a "Neutral" rating, citing valuation, customer concentration, competition, and potential growth normalization as concerns.
2. Valuation Concerns and Profit-Taking Amidst Broader Tech Sell-off: Despite reporting strong fiscal Q3 2026 results with revenue up 154% year-over-year to $584.9 million and adjusted EPS beating consensus, Astera Labs' shares, trading at a high forward price-to-earnings ratio of 54.59, were perceived as overvalued. This high valuation, coupled with the stock's 118% gain over the prior six months by August 2026, likely triggered substantial profit-taking. This trend was exacerbated by a "broad market pressure on technology stocks" and a general "AI Selloff" observed around November 2026, causing Astera Labs to drop 12.7% after hours on November 5, 2026, shedding approximately $4 billion in market value.
3. Increased Operating Expenses and Competitive Headwinds: Astera Labs' fiscal Q3 2026 results indicated a 19% sequential increase in non-GAAP operating expenses, reaching $162 million, primarily driven by higher investments in research and development, workforce expansion, and variable compensation. The company also faced industry-wide challenges such as tight wafer capacity, power availability, and memory supply within the AI infrastructure sector. Additionally, analysts raised concerns about Astera Labs' customer concentration and the intensifying competition in its market.
4. Significant Insider Selling Activity: The period saw substantial insider selling, notably by CEO Jitendra Mohan, who sold approximately $30.8 million worth of common stock on August 17, 2026, as part of "sell to cover" transactions for tax obligations from vested restricted stock units. This large transaction contributed to a broader pattern where insiders collectively sold shares valued at $123.4 million over the last quarter, with total net insider selling over the past 90 days amounting to $76.0 million. Such significant insider divestment, even if pre-planned, can negatively influence market sentiment and increase selling pressure on the stock.
Show less
Stock Movement Drivers
Fundamental Drivers
The -38.7% change in ALAB stock from 7/31/2026 to 11/7/2026 was primarily driven by a -63.7% change in the company's P/E Multiple.| (LTM values as of) | 7312026 | 11072026 | Change |
|---|---|---|---|
| Stock Price ($) | 311.23 | 190.71 | -38.7% |
| Change Contribution By: | |||
| Total Revenues ($ Mil) | 1,001 | 1,556 | 55.4% |
| Net Income Margin (%) | 26.7% | 29.6% | 10.9% |
| P/E Multiple | 198.5 | 72.0 | -63.7% |
| Shares Outstanding (Mil) | 171 | 174 | -2.0% |
| Cumulative Contribution | -38.7% |
Market Drivers
7/31/2026 to 11/7/2026| Return | Correlation | |
|---|---|---|
| ALAB | -38.7% | |
| Market (SPY) | -1.6% | 66.6% |
| Sector (XLK) | -6.1% | 83.5% |
Fundamental Drivers
The -2.1% change in ALAB stock from 4/30/2026 to 11/7/2026 was primarily driven by a -52.2% change in the company's P/E Multiple.| (LTM values as of) | 4302026 | 11072026 | Change |
|---|---|---|---|
| Stock Price ($) | 194.74 | 190.71 | -2.1% |
| Change Contribution By: | |||
| Total Revenues ($ Mil) | 853 | 1,556 | 82.5% |
| Net Income Margin (%) | 25.7% | 29.6% | 15.3% |
| P/E Multiple | 150.7 | 72.0 | -52.2% |
| Shares Outstanding (Mil) | 170 | 174 | -2.6% |
| Cumulative Contribution | -2.1% |
Market Drivers
4/30/2026 to 11/7/2026| Return | Correlation | |
|---|---|---|
| ALAB | -2.1% | |
| Market (SPY) | 2.6% | 62.2% |
| Sector (XLK) | 3.4% | 77.7% |
Fundamental Drivers
The 2.2% change in ALAB stock from 10/31/2025 to 11/7/2026 was primarily driven by a 157.0% change in the company's Total Revenues ($ Mil).| (LTM values as of) | 10312025 | 11072026 | Change |
|---|---|---|---|
| Stock Price ($) | 186.68 | 190.71 | 2.2% |
| Change Contribution By: | |||
| Total Revenues ($ Mil) | 606 | 1,556 | 157.0% |
| Net Income Margin (%) | 16.5% | 29.6% | 79.2% |
| P/E Multiple | 308.3 | 72.0 | -76.7% |
| Shares Outstanding (Mil) | 165 | 174 | -5.0% |
| Cumulative Contribution | 2.2% |
Market Drivers
10/31/2025 to 11/7/2026| Return | Correlation | |
|---|---|---|
| ALAB | 2.2% | |
| Market (SPY) | 8.7% | 53.9% |
| Sector (XLK) | 10.0% | 69.8% |
Fundamental Drivers
nullnull
Market Drivers
10/31/2023 to 11/7/2026| Return | Correlation | |
|---|---|---|
| ALAB | ||
| Market (SPY) | 81.9% | 47.8% |
| Sector (XLK) | 104.5% | 59.8% |
Price Returns Compared
| 2021 | 2022 | 2023 | 2024 | 2025 | 2026 | Total [1] | |
|---|---|---|---|---|---|---|---|
| Returns | |||||||
| ALAB Return | - | - | - | 114% | 26% | 15% | 207% |
| Peers Return | 59% | -11% | 67% | 76% | 46% | 2% | 525% |
| S&P 500 Return | 27% | -19% | 24% | 23% | 16% | 12% | 105% |
Monthly Win Rates [3] | |||||||
| ALAB Win Rate | - | - | - | 60% | 50% | 36% | |
| Peers Win Rate | 67% | 48% | 62% | 57% | 52% | 40% | |
| S&P 500 Win Rate | 75% | 42% | 67% | 75% | 67% | 45% | |
Max Drawdowns [4] | |||||||
| ALAB Max Drawdown | - | - | - | - | -63% | -63% | |
| Peers Max Drawdown | -19% | -42% | -31% | -37% | -49% | -52% | |
| S&P 500 Max Drawdown | -5% | -25% | -10% | -8% | -19% | -9% | |
[1] Cumulative total returns since the beginning of 2021
[2] Peers: AVGO, MRVL, CRDO, MCHP, RMBS.
[3] Win Rate = % of calendar months in which monthly returns were positive
[4] Max drawdown represents maximum peak-to-trough decline within a year
[5] 2026 data is for the year up to 11/6/2026 (YTD)
How Low Can It Go
| Event | ALAB | S&P 500 |
|---|---|---|
| 2025 US Tariff Shock | ||
| % Loss | -41.1% | -18.8% |
| % Gain to Breakeven | 69.8% | 23.1% |
| Time to Breakeven | 40 days | 79 days |
| 2024 Yen Carry Trade Unwind | ||
| % Loss | -36.1% | -7.8% |
| % Gain to Breakeven | 56.4% | 8.5% |
| Time to Breakeven | 63 days | 18 days |
In The Past
Astera Labs's stock fell -41.1% during the 2025 US Tariff Shock. Such a loss loss requires a 69.8% gain to breakeven.
Preserve Wealth
Limiting losses and compounding gains is essential to preserving wealth.
Asset Allocation
Actively managed asset allocation strategies protect wealth. Learn more.
| Event | ALAB | S&P 500 |
|---|---|---|
| 2025 US Tariff Shock | ||
| % Loss | -41.1% | -18.8% |
| % Gain to Breakeven | 69.8% | 23.1% |
| Time to Breakeven | 40 days | 79 days |
| 2024 Yen Carry Trade Unwind | ||
| % Loss | -36.1% | -7.8% |
| % Gain to Breakeven | 56.4% | 8.5% |
| Time to Breakeven | 63 days | 18 days |
In The Past
Astera Labs's stock fell -41.1% during the 2025 US Tariff Shock. Such a loss loss requires a 69.8% gain to breakeven.
Preserve Wealth
Limiting losses and compounding gains is essential to preserving wealth.
Asset Allocation
Actively managed asset allocation strategies protect wealth. Learn more.
About Astera Labs (ALAB)
Astera Labs (ALAB) is a technology company specializing in semiconductor-based connectivity solutions for high-performance cloud and artificial intelligence (AI) infrastructure. The company's mission is to overcome critical data, network, and memory bottlenecks that arise in data-centric systems, enabling the efficient deployment and operation of large-scale AI and cloud computing environments. Astera Labs employs a patented software-defined platform approach to deliver robust connectivity performance, flexibility, observability, and predictive analytics, which is crucial for modern heterogeneous computing architectures incorporating GPUs and other AI accelerators.
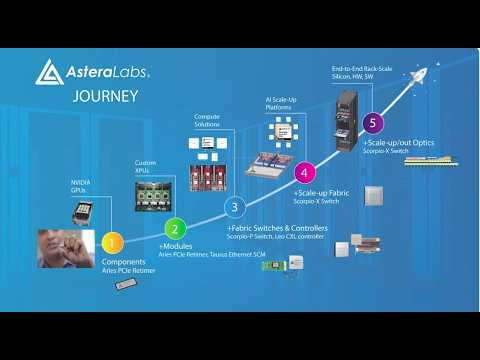
The core offering is the "Intelligent Connectivity Platform," which comprises two main components: high-speed, mixed-signal connectivity products and the COSMOS software suite. The connectivity products are supplied in various form factors, including integrated circuits (ICs), boards, and modules. Key product families include Aries PCIe®/CXL™ Smart DSP Retimers, Taurus Ethernet Smart Cable Modules™, and Leo CXL Memory Connectivity Controllers, all built upon industry-standard protocols such as PCIe, Ethernet, and CXL. The COSMOS software suite is embedded within these products, allowing customers to seamlessly configure, manage, monitor, optimize, and customize their connectivity solutions.
Astera Labs primarily serves leading hyperscalers and system OEM customers, providing the essential connectivity backbone for major AI platforms deployed worldwide. The company's solutions address the global wired connectivity market, including PCIe and Ethernet, and the CXL memory connectivity controller market. With a significant number of design wins, Astera Labs is positioned to capture an increasing share of a total addressable market estimated to reach $27.4 billion by 2027, driven by the accelerating shift towards cloud-scale AI workloads and compute-intensive applications.
AI Analysis | Feedback
Astera Labs is like Mellanox (now part of NVIDIA), but specialized in the ultra-high-speed internal data and memory connections within AI and cloud data centers.
Alternatively, think of them as Rambus, but focused on next-generation PCIe and CXL memory and data connectivity controllers crucial for advanced AI and cloud infrastructure.
AI Analysis | Feedback
Astera Labs (ALAB) provides the following major products:
- Aries PCIe®/CXL™ Smart DSP Retimers: These semiconductor products enhance signal integrity and extend the reach of PCIe and CXL interfaces in cloud and AI infrastructure.
- Taurus Ethernet Smart Cable Modules™: These modules provide advanced Ethernet connectivity solutions, resolving network bottlenecks in high-performance cloud and AI data centers.
- Leo CXL Memory Connectivity Controllers: These controllers manage and optimize CXL (Compute Express Link) memory connectivity, addressing memory bottlenecks within cloud and AI infrastructure.
- COSMOS software suite: This software enables customers to configure, manage, monitor, and optimize the functions of Astera Labs' connectivity IC, board, and module products.
AI Analysis | Feedback
Astera Labs (ALAB) sells primarily to other companies. Its major customers can be categorized as:
- Hyperscalers: These are large cloud service providers that deploy and operate high-performance cloud and AI infrastructure at scale. While no specific names of hyperscaler customers are provided, Astera Labs states it ships millions of devices across "all of the major hyperscalers."
- System OEM (Original Equipment Manufacturer) customers: These are companies that build and supply systems for data centers.
Astera Labs also emphasizes "trusted relationships" and "collaboration" with leading data center infrastructure suppliers. This indicates these companies are either direct customers, integrating Astera Labs' connectivity solutions into their own offerings, or critical partners whose platforms incorporate Astera Labs' technology which is then sold to hyperscalers and system OEMs. These named companies include:
- NVIDIA (NASDAQ: NVDA)
- Advanced Micro Devices (NASDAQ: AMD)
- Intel (NASDAQ: INTC)
AI Analysis | Feedback
AI Analysis | Feedback
Jitendra Mohan, Chief Executive Officer
Jitendra Mohan is a co-founder of Astera Labs, establishing the company in 2017, and has served as its Chief Executive Officer and a member of the board of directors since November 2017. He led Astera Labs through a successful IPO in March 2024. Prior to co-founding Astera Labs, Mr. Mohan was the Product Line (General) Manager at Texas Instruments Inc. from March 2012 to October 2017. Before that, he held various technical leadership roles, including Design Director, at National Semiconductor Corporation from June 1996 to March 2012. He holds over 35 patents. Mr. Mohan co-founded Astera Labs with Sanjay Gajendra and Casey Morrison, having previously worked together at Texas Instruments.
Desmond Lynch, Chief Financial Officer
Desmond Lynch was appointed as Chief Financial Officer of Astera Labs, effective March 2, 2026. Before joining Astera Labs, he served as Senior Vice President, Finance and Chief Financial Officer of Rambus Inc. from August 2022 to February 2026. His experience also includes roles as Vice President of Finance and Investor Relations at Rambus from 2020 to 2022, and Vice President, Finance at Knowles Corporation from 2019 to 2020. Mr. Lynch also held financial leadership positions at Renesas Electronics Corporation/Integrated Device Technology, Inc. from 2016 to 2019, and was Director, Financial Planning and Analysis at Atmel Corporation from 2010 to 2016 before its acquisition by Microchip Technology. He is a Chartered Accountant with the Institute of Chartered Accountants of Scotland and holds a bachelor's degree in Accounting and Finance from the University of Glasgow, Scotland.
Sanjay Gajendra, President and Chief Operating Officer
Sanjay Gajendra is a co-founder of Astera Labs and has served as Chief Operating Officer and a member of the board of directors since November 2017, taking on the role of President in November 2023. He previously served as Chief Financial Officer and Treasurer of the company from November 2017 to July 2020. Prior to co-founding Astera Labs, Mr. Gajendra was a Product Line (General) Manager at Texas Instruments Inc. from July 2014 to October 2017. His background also includes various roles at National Semiconductor Corporation, including Product Manager, Principal Software Engineer, and Senior Software Engineer, as well as a Senior Software Engineer at Wipro Limited. Mr. Gajendra holds a Master of Engineering degree in Engineering Management from the University of Colorado Boulder. He co-founded Astera Labs with Jitendra Mohan and Casey Morrison, having worked together at Texas Instruments.
Casey Morrison, Chief Product Officer
Casey Morrison is a co-founder of Astera Labs. As Chief Product Officer, he is responsible for leading the product organization, which includes defining products and ensuring their seamless integration into customer systems. He co-founded Astera Labs with Jitendra Mohan and Sanjay Gajendra after their time working together at Texas Instruments.
Philip Mazzara, General Counsel & Secretary
Philip Mazzara serves as the General Counsel and Secretary for Astera Labs, where he oversees the company's legal and compliance functions. Before joining Astera Labs, he held the position of General Counsel and Secretary at Innovium, Inc., a company specializing in network switch silicon for the data center market. Mr. Mazzara earned both a JD and an MBA from Stanford Law School and the Stanford Graduate School of Business.
AI Analysis | Feedback
- Reliance on a rapidly evolving cloud and AI infrastructure market: Astera Labs' core business is purpose-built around providing semiconductor-based connectivity solutions specifically for cloud and AI infrastructure. While this market is experiencing significant growth, it is also highly dynamic with continuous technological advancements and architectural shifts. A slowdown in AI or cloud infrastructure investment, a shift in dominant computing paradigms, or the emergence of new technologies that address connectivity bottlenecks differently could significantly impact the demand for Astera Labs' specialized solutions.
- Customer concentration with leading hyperscalers and reliance on strategic partnerships: The company's success is deeply intertwined with its "trusted relationships with the leading hyperscalers" and collaborations with major data center infrastructure suppliers like NVIDIA, AMD, and Intel. While Astera Labs has achieved "more than 300 design wins" and ships to "all of the major hyperscalers," the number of these "major" customers is relatively limited. The loss of a significant hyperscaler customer or a shift in their technology preferences, procurement strategies, or preferred partners could have a substantial adverse effect on Astera Labs' revenue and market position.
- Intense competition and the need for continuous innovation: Astera Labs operates in the highly competitive semiconductor industry, focusing on critical connectivity components like PCIe, Ethernet, and CXL. While the company has introduced "first-to-market" products and employs a "patented software-defined platform," it faces competition from both established semiconductor giants and other innovative startups. The ability to maintain technological leadership, continuously innovate, and bring new products to market rapidly to address evolving customer needs and industry standards is crucial for sustained growth and market share against well-resourced competitors.
AI Analysis | Feedback
The clear emerging threat for Astera Labs is the potential for their major hyperscaler customers to vertically integrate and develop their own custom connectivity ASICs.
The company description states that hyperscalers "have adopted heterogeneous, 'accelerated computing' system architectures within their data centers, which include GPUs and other AI accelerators, such as TPUs, AI processors, custom ASICs, and FPGAs, to target specific workloads." This demonstrates that Astera Labs' primary customers possess the capability and strategic intent to design and deploy their own specialized silicon for critical data center functions. Should these hyperscalers extend this in-house chip design capability to the core connectivity components (such as PCIe/CXL retimers or CXL memory controllers) that Astera Labs currently supplies, it could directly reduce or eliminate the need for Astera Labs' products, similar to how major tech companies like Apple developed their own processors or how hyperscalers develop their own AI accelerators, diminishing reliance on third-party suppliers.
AI Analysis | Feedback
Astera Labs' Intelligent Connectivity Platform targets a global total addressable market (TAM) of $17.2 billion. This market includes the global wired connectivity market (PCIe and Ethernet) and the CXL memory connectivity controller market. Astera Labs anticipates this TAM will grow to $27.4 billion by 2027.
AI Analysis | Feedback
Astera Labs (ALAB) is poised for significant revenue growth over the next 2-3 years, driven by several key factors in the rapidly evolving data center and AI infrastructure markets:
- Surging Demand for AI and Cloud Infrastructure: Astera Labs is a critical enabler of high-performance AI and cloud infrastructure. The explosion in AI-related spending by major hyperscalers such as Google, AWS, and Microsoft is creating robust and structural demand for Astera Labs' connectivity solutions. The company's Q4 2025 results highlighted accelerating demand from U.S. hyperscalers for AI and cloud infrastructure solutions, with substantial new design wins and diversification across multiple customers. Analysts expect Astera Labs to grow substantially faster than its industry, with forecasted annualized revenue growth of 58% to the end of 2026.
- Expansion of Product Portfolio and Technology Leadership: The company is continuously expanding its Intelligent Connectivity Platform with new and advanced semiconductor-based solutions. This includes a focus on next-generation PCIe (e.g., PCIe 6.0), CXL (Compute Express Link), and advanced smart fabric switches like the Scorpio X-Series. Astera Labs is the first to market with a complete PCIe 6.0 solution set, including retimers, gearboxes, smart fabric switches, and optical modules. The shift from Aries retimers to Scorpio scale-up fabrics is expected to materially increase the dollar content per rack and enhance system lock-in. The expanded Scorpio X-Series roadmap includes new capabilities such as increased radix support, platform-specific protocols, in-network computing, Hypercast technology, and optical connectivity to enable multi-rack deployments for complex AI workloads.
- Growing Adoption of Advanced Connectivity Standards and Strategic Partnerships: Astera Labs is actively involved in the adoption and implementation of critical new industry standards such as CXL, PCIe 6.0, and Ultra Accelerator (UA) Link. The company's platform integrates these technologies along with Ethernet and NVLink. Its strategic partnerships and collaborations with leading data center infrastructure suppliers like NVIDIA, Advanced Micro Devices, Intel, and its involvement in the Arm Total Design ecosystem are crucial for driving the adoption of its solutions in next-generation AI platforms. These collaborations and first-to-market products have resulted in over 300 design wins.
AI Analysis | Feedback
Capital Allocation Decisions (Last 3-5 Years)
1. Share Repurchases
- No significant share repurchases were reported; as of September 2025, Astera Labs had a 6-Month Share Buyback Ratio of -2.42%, indicating no buybacks or potential share issuance.
2. Share Issuance
- Astera Labs completed its Initial Public Offering (IPO) in March 2024, selling 19,758,903 shares of common stock at $36.00 per share.
- The IPO generated gross proceeds of approximately $819.7 million for the company.
- Certain existing stockholders also sold 3,011,097 shares in the IPO.
3. Inbound Investments
- Astera Labs raised $819.7 million in gross proceeds from its IPO in March 2024.
- Prior to its public offering, Astera Labs had a private valuation of $3.15 billion in November 2022.
- Institutional investors, including Vanguard Group Inc., State Street Corp, Geode Capital Management LLC, and Swiss National Bank, significantly increased their holdings in Astera Labs during 2025.
4. Outbound Investments
- Astera Labs entered into a definitive agreement to acquire aiXscale Photonics GmbH.
- The company utilized recent funding to establish two new international research and development centers in Canada, expand its workforce, and broaden its product lines.
5. Capital Expenditures
- Capital expenditures for the fourth quarter of 2025 totaled $18.7 million, following $12.3 million in the third quarter of 2025, demonstrating ongoing investments in facilities or equipment.
- Net cash used in investing activities was substantial in 2025, with figures of -$72.8 million in Q4, -$101.0 million in Q3, -$63.7 million in Q2, and -$3.97 million in Q1.
Peer Outperformance in Semiconductors
null| Industry | Names | 1Y med | 3Y med | 5Y med | Top 3 by 5Y |
|---|---|---|---|---|---|
| Electronic Manufacturing Services | 10 | 5.5% | 93.6% | 163.4% | FLEX 421% · TTMI 365% · JBL 272% |
| Technology Distributors | 9 | 43.9% | 52.8% | 52.9% | AVT 122% · SNX 104% · PLUS 53% |
| Semiconductor Materials & Equipment | 28 | 26.7% | 40.7% | 33.2% | AXTI 322% · KLAC 249% · LRCX 245% |
| Electronic Components | 24 | 13.8% | 61.0% | 21.1% | CLS 1777% · BELFA 985% · APH 283% |
| Communications Equipment | 36 | 1.6% | 71.8% | 17.8% | AAOI 755% · LITE 477% · ANET 415% |
| Electronic Equipment & Instruments | 27 | -6.4% | 27.4% | 1.7% | PI 120% · OSIS 105% · MIR 60% |
| Semiconductors ← | 55 | 6.4% | 37.8% | -12.6% | MU 869% · NVDA 530% · AVGO 474% |
| Technology Hardware, Storage & Peripherals | 21 | 12.4% | 51.8% | -20.2% | DELL 543% · WDC 531% · SMCI 517% |
| Internet Services & Infrastructure | 6 | -7.1% | 42.2% | -26.0% | GDDY 57% · VRSN 35% · AKAM -23% |
| IT Consulting & Other Services | 30 | -17.8% | -9.2% | -28.2% | APLD 253% · IBM 140% · GIB -8% |
| Application Software | 125 | -12.3% | -12.0% | -54.5% | PLTR 517% · FROG 159% · AGYS 143% |
| Systems Software | 70 | -10.7% | 13.7% | -54.6% | ZETA 237% · CRWD 217% · CVLT 133% |
Latest Trefis Analyses
Research & Analysis
Invest in Strategies
Wealth Management
Peer Comparisons
| Peers to compare with: |
Financials
| Median | |
|---|---|
| Name | |
| Mkt Price | 131.55 |
| Mkt Cap | 32.5 |
| Rev LTM | 3,597 |
| Op Inc LTM | 857 |
| FCF LTM | 947 |
| FCF 3Y Avg | 755 |
| CFO LTM | 1,015 |
| CFO 3Y Avg | 828 |
Growth & Margins
| Median | |
|---|---|
| Name | |
| Rev Chg LTM | 40.9% |
| Rev Chg 3Y Avg | 20.5% |
| Rev Chg Q | 63.8% |
| QoQ Delta Rev Chg LTM | 13.7% |
| Op Inc Chg LTM | 268.7% |
| Op Inc Chg 3Y Avg | 96.3% |
| Op Mgn LTM | 28.6% |
| Op Mgn 3Y Avg | 13.2% |
| QoQ Delta Op Mgn LTM | 1.8% |
| CFO/Rev LTM | 29.8% |
| CFO/Rev 3Y Avg | 30.3% |
| FCF/Rev LTM | 26.8% |
| FCF/Rev 3Y Avg | 25.8% |
Valuation
| Median | |
|---|---|
| Name | |
| Mkt Cap | 32.5 |
| P/S | 13.8 |
| P/Op Inc | 38.6 |
| P/EBIT | 34.4 |
| P/E | 39.9 |
| P/CFO | 39.8 |
| Total Yield | 2.9% |
| Dividend Yield | 0.1% |
| FCF Yield 3Y Avg | 1.9% |
| D/E | 0.0 |
| Net D/E | -0.0 |
Price Behavior
| Market Price | $190.71 | |
| Market Cap ($ Bil) | 33.2 | |
| First Trading Date | 03/20/2024 | |
| Distance from 52W High | -60.5% | |
| 50 Days | 200 Days | |
| DMA Price | $300.46 | $256.06 |
| DMA Trend | down | up |
| Distance from DMA | -36.5% | -25.5% |
| 3M | 1YR | |
| Volatility | 91.7% | 100.9% |
| Downside Capture | 527.81 | 400.41 |
| Upside Capture | 359.56 | 373.91 |
| Correlation (S&P 500) | 67.3% | 53.6% |
| 1M | 2M | 3M | 6M | 1Y | 3Y | |
|---|---|---|---|---|---|---|
| Beta | 5.96 | 5.52 | 5.17 | 5.07 | 4.03 | 0.01 |
| Up Beta | 2.26 | 7.72 | 6.61 | 7.94 | 5.16 | 0.12 |
| Down Beta | 5.36 | 7.96 | 6.39 | 3.51 | 3.07 | -0.67 |
| Up Capture | 449% | 521% | 526% | 1201% | 2045% | 16007% |
| Bmk +ve Days | 12 | 18 | 28 | 62 | 130 | 427 |
| Stock +ve Days | 10 | 22 | 33 | 65 | 133 | 340 |
| Down Capture | 651% | 384% | 384% | 274% | 184% | 113% |
| Bmk -ve Days | 10 | 25 | 36 | 64 | 121 | 325 |
| Stock -ve Days | 12 | 21 | 31 | 61 | 118 | 313 |
[1] Upside and downside betas calculated using positive and negative benchmark daily returns respectively
Based On 1-Year Data
| Annualized Return | Annualized Volatility | Sharpe Ratio | Correlation with ALAB | |
|---|---|---|---|---|
| ALAB | 4.8% | 100.9% | 0.51 | - |
| Sector ETF (XLK) | 12.1% | 28.4% | 0.39 | 69.6% |
| Equity (SPY) | 9.5% | 13.6% | 0.40 | 53.6% |
| Gold (GLD) | 1.6% | 28.7% | 0.05 | 18.6% |
| Commodities (DBC) | 38.4% | 21.2% | 1.42 | -4.0% |
| Real Estate (VNQ) | 11.3% | 14.2% | 0.51 | -6.3% |
| Bitcoin (BTCUSD) | -27.2% | 43.6% | -0.61 | 27.3% |
Smart multi-asset allocation framework can stack odds in your favor. Learn How
Based On 5-Year Data
| Annualized Return | Annualized Volatility | Sharpe Ratio | Correlation with ALAB | |
|---|---|---|---|---|
| ALAB | 24.9% | 94.9% | 0.87 | - |
| Sector ETF (XLK) | 16.2% | 26.4% | 0.55 | 59.9% |
| Equity (SPY) | 11.3% | 17.3% | 0.48 | 47.8% |
| Gold (GLD) | 17.5% | 19.1% | 0.74 | 11.5% |
| Commodities (DBC) | 8.1% | 19.6% | 0.30 | 9.6% |
| Real Estate (VNQ) | 1.3% | 18.9% | -0.04 | 2.6% |
| Bitcoin (BTCUSD) | 4.0% | 51.6% | 0.26 | 22.5% |
Smart multi-asset allocation framework can stack odds in your favor. Learn How
Based On 10-Year Data
| Annualized Return | Annualized Volatility | Sharpe Ratio | Correlation with ALAB | |
|---|---|---|---|---|
| ALAB | 11.8% | 94.9% | 0.87 | - |
| Sector ETF (XLK) | 22.6% | 25.3% | 0.82 | 59.9% |
| Equity (SPY) | 15.0% | 18.0% | 0.70 | 47.8% |
| Gold (GLD) | 11.9% | 16.5% | 0.59 | 11.5% |
| Commodities (DBC) | 7.5% | 18.1% | 0.33 | 9.6% |
| Real Estate (VNQ) | 5.9% | 20.7% | 0.24 | 2.6% |
| Bitcoin (BTCUSD) | 60.0% | 66.3% | 1.00 | 22.5% |
Smart multi-asset allocation framework can stack odds in your favor. Learn How
Earnings Returns History
Updated 11/6/2026| Forward Returns | |||
|---|---|---|---|
| Earnings Date | 1D Returns | 5D Returns | 21D Returns |
| 11/3/2026 | -4.4% | ||
| 8/4/2026 | -12.0% | -13.7% | -24.2% |
| 5/5/2026 | -0.8% | -5.2% | 66.0% |
| 2/10/2026 | -21.4% | -29.1% | -34.4% |
| 11/4/2025 | 1.5% | -6.6% | -10.1% |
| 8/5/2025 | 28.7% | 41.7% | 38.7% |
| 5/6/2025 | -0.4% | 23.0% | 27.1% |
| 2/10/2025 | -10.9% | -9.7% | -33.4% |
| ... | |||
| SUMMARY STATS | |||
| # Positive | 3 | 3 | 4 |
| # Negative | 8 | 7 | 6 |
| Median Positive | 28.7% | 32.4% | 52.1% |
| Median Negative | -10.0% | -6.6% | -20.8% |
| Max Positive | 37.7% | 41.7% | 66.0% |
| Max Negative | -21.4% | -29.1% | -34.4% |
| Forward Returns | |||
|---|---|---|---|
| Earnings Date | 1D Returns | 5D Returns | 21D Returns |
| 11/3/2026 | -4.4% | ||
| 8/4/2026 | -12.0% | -13.7% | -24.2% |
| 5/5/2026 | -0.8% | -5.2% | 66.0% |
| 2/10/2026 | -21.4% | -29.1% | -34.4% |
| 11/4/2025 | 1.5% | -6.6% | -10.1% |
| 8/5/2025 | 28.7% | 41.7% | 38.7% |
| 5/6/2025 | -0.4% | 23.0% | 27.1% |
| 2/10/2025 | -10.9% | -9.7% | -33.4% |
| 11/4/2024 | 37.7% | 32.4% | 65.5% |
| 8/6/2024 | -14.4% | -4.9% | -1.9% |
| 5/7/2024 | -9.1% | -5.1% | -17.3% |
| SUMMARY STATS | |||
| # Positive | 3 | 3 | 4 |
| # Negative | 8 | 7 | 6 |
| Median Positive | 28.7% | 32.4% | 52.1% |
| Median Negative | -10.0% | -6.6% | -20.8% |
| Max Positive | 37.7% | 41.7% | 66.0% |
| Max Negative | -21.4% | -29.1% | -34.4% |
SEC Filings
Expand for More| Report Date | Filing Date | Filing |
|---|---|---|
| 09/30/2026 | 11/04/2026 | 10-Q |
| 06/30/2026 | 08/05/2026 | 10-Q |
| 03/31/2026 | 05/06/2026 | 10-Q |
| 12/31/2025 | 02/20/2026 | 10-K |
| 09/30/2025 | 11/05/2025 | 10-Q |
| 06/30/2025 | 08/06/2025 | 10-Q |
| 03/31/2025 | 05/07/2025 | 10-Q |
| 12/31/2024 | 02/14/2025 | 10-K |
| 09/30/2024 | 11/05/2024 | 10-Q |
| 06/30/2024 | 08/07/2024 | 10-Q |
| 03/31/2024 | 05/08/2024 | 10-Q |
| 12/31/2023 | 03/21/2024 | 424B4 |
| Report Date | Filing Date | Filing |
|---|---|---|
| 09/30/2026 | 11/04/2026 | 10-Q |
| 06/30/2026 | 08/05/2026 | 10-Q |
| 03/31/2026 | 05/06/2026 | 10-Q |
| 12/31/2025 | 02/20/2026 | 10-K |
| 09/30/2025 | 11/05/2025 | 10-Q |
| 06/30/2025 | 08/06/2025 | 10-Q |
| 03/31/2025 | 05/07/2025 | 10-Q |
| 12/31/2024 | 02/14/2025 | 10-K |
| 09/30/2024 | 11/05/2024 | 10-Q |
| 06/30/2024 | 08/07/2024 | 10-Q |
| 03/31/2024 | 05/08/2024 | 10-Q |
| 12/31/2023 | 03/21/2024 | 424B4 |
Insider Activity
Updated 10/9/2026| # | Owner | Title | Holding | Action | Filing Date | Price | Shares | Transacted Value | Value of Held Shares | Form |
|---|---|---|---|---|---|---|---|---|---|---|
| 1 | Dyckerhoff, Stefan A | Direct | Sell | 10092026 | 376.06 | 3,505 | 1,318,090 | 17,681,965 | Form | |
| 2 | Dyckerhoff, Stefan A | Trust | Sell | 10092026 | 376.06 | 8,333 | 3,133,708 | 107,703,584 | Form | |
| 3 | Dyckerhoff, Stefan A | Limited Partnership (TF) | Sell | 10092026 | 376.06 | 661 | 248,576 | 995,807 | Form | |
| 4 | Dyckerhoff, Stefan A | Direct | Sell | 9032026 | 274.96 | 3,505 | 963,744 | 13,873,518 | Form | |
| 5 | Dyckerhoff, Stefan A | Trust | Sell | 9032026 | 274.96 | 8,333 | 2,291,260 | 81,040,427 | Form |
| # | Owner | Title | Holding | Action | Filing Date | Price | Shares | Transacted Value | Value of Held Shares | Form |
|---|---|---|---|---|---|---|---|---|---|---|
| 1 | Dyckerhoff, Stefan A | Direct | Sell | 10092026 | 376.06 | 3,505 | 1,318,090 | 17,681,965 | Form | |
| 2 | Dyckerhoff, Stefan A | Trust | Sell | 10092026 | 376.06 | 8,333 | 3,133,708 | 107,703,584 | Form | |
| 3 | Dyckerhoff, Stefan A | Limited Partnership (TF) | Sell | 10092026 | 376.06 | 661 | 248,576 | 995,807 | Form | |
| 4 | Dyckerhoff, Stefan A | Direct | Sell | 9032026 | 274.96 | 3,505 | 963,744 | 13,873,518 | Form | |
| 5 | Dyckerhoff, Stefan A | Trust | Sell | 9032026 | 274.96 | 8,333 | 2,291,260 | 81,040,427 | Form | |
| 6 | Dyckerhoff, Stefan A | Limited Partnership (TF) | Sell | 9032026 | 274.96 | 661 | 181,749 | 909,844 | Form | |
| 7 | Alba, Manuel | Alba Trust | Sell | 9032026 | 280.13 | 150,000 | 42,019,449 | 315,005,239 | Form | |
| 8 | Alba, Manuel | Casa Alameda 2007, LLC | Sell | 9032026 | 280.13 | 33,000 | 9,244,247 | 71,114,310 | Form | |
| 9 | Gajendra, Sanjay | President and COO | Direct | Sell | 8192026 | 340.35 | 90,630 | 30,846,356 | 380,869,961 | Form |
| 10 | Mazzara, Philip | General Counsel and Secretary | Direct | Sell | 8192026 | 340.50 | 6,801 | 2,315,754 | 32,872,741 | Form |
| 11 | Mohan, Jitendra | Chief Executive Officer | Direct | Sell | 8192026 | 340.35 | 90,630 | 30,846,356 | 431,115,520 | Form |
| 12 | Dyckerhoff, Stefan A | Direct | Sell | 8102026 | 311.83 | 3,505 | 1,092,972 | 16,826,776 | Form | |
| 13 | Dyckerhoff, Stefan A | Trust | Sell | 8102026 | 311.83 | 8,333 | 2,598,494 | 94,505,619 | Form | |
| 14 | Dyckerhoff, Stefan A | Limited Partnership (TF) | Sell | 8102026 | 311.83 | 661 | 206,121 | 1,237,972 | Form | |
| 15 | Alba, Manuel | Casa Alameda 2007, LLC | Sell | 7062026 | 458.38 | 8,491 | 3,892,091 | 131,491,807 | Form | |
| 16 | Alba, Manuel | Alba Trust | Sell | 7062026 | 463.47 | 13,026 | 6,037,135 | 590,689,122 | Form | |
| 17 | Alba, Manuel | Casa Alameda 2007, LLC | Sell | 7062026 | 438.84 | 24,509 | 10,755,607 | 129,614,077 | Form | |
| 18 | Alba, Manuel | Alba Trust | Sell | 7062026 | 442.01 | 136,974 | 60,543,455 | 569,094,511 | Form | |
| 19 | Dyckerhoff, Stefan A | Direct | Sell | 7022026 | 450.00 | 3,505 | 1,577,250 | 25,859,700 | Form | |
| 20 | Dyckerhoff, Stefan A | Trust | Sell | 7022026 | 450.00 | 8,333 | 3,749,850 | 140,129,550 | Form | |
| 21 | Dyckerhoff, Stefan A | Limited Partnership (TF) | Sell | 7022026 | 450.00 | 661 | 297,450 | 2,083,950 | Form | |
| 22 | Mayer, Bethany | Direct | Sell | 6262026 | 395.04 | 686 | 270,999 | 2,192,484 | Form | |
| 23 | Lazar, Jack R | Direct | Sell | 6082026 | 355.17 | 10,000 | 3,551,679 | 26,881,945 | Form | |
| 24 | Dyckerhoff, Stefan A | Direct | Sell | 6052026 | 364.35 | 3,505 | 1,277,042 | 21,909,744 | Form | |
| 25 | Dyckerhoff, Stefan A | Trust | Sell | 6052026 | 364.35 | 8,333 | 3,036,119 | 116,493,984 | Form | |
| 26 | Dyckerhoff, Stefan A | Limited Partnership (TF) | Sell | 6052026 | 364.35 | 661 | 240,835 | 1,928,135 | Form | |
| 27 | Gajendra, Sanjay | President and COO | Trust 1 | Sell | 5262026 | 290.30 | 400,000 | 116,119,966 | 1,470,140,610 | Form |
| 28 | Mazzara, Philip | General Counsel and Secretary | Direct | Sell | 5262026 | 291.03 | 796 | 231,656 | 30,075,407 | Form |
| 29 | Mohan, Jitendra | Chief Executive Officer | Living Trust | Sell | 5202026 | 249.62 | 28,737 | 7,173,408 | 945,878,391 | Form |
| 30 | Gajendra, Sanjay | President and COO | Direct | Sell | 5202026 | 225.02 | 95,444 | 21,476,949 | 323,098,644 | Form |
| 31 | Mazzara, Philip | General Counsel and Secretary | Direct | Sell | 5202026 | 231.78 | 14,076 | 3,262,540 | 24,137,370 | Form |
| 32 | Mohan, Jitendra | Chief Executive Officer | Direct | Sell | 5202026 | 225.02 | 95,444 | 21,476,949 | 305,420,508 | Form |
| 33 | Mohan, Jitendra | Chief Executive Officer | Living Trust | Sell | 5202026 | 216.89 | 111,214 | 24,121,604 | 828,093,005 | Form |
| 34 | Gajendra, Sanjay | President and COO | Trust 2 | Sell | 5112026 | 202.71 | 9,361 | 1,897,590 | 132,776,598 | Form |
| 35 | Gajendra, Sanjay | President and COO | Trust 3 | Sell | 5112026 | 198.39 | 40,000 | 7,935,704 | 129,947,156 | Form |
| 36 | Gajendra, Sanjay | President and COO | Trust 1 | Sell | 5112026 | 198.39 | 200,000 | 39,678,605 | 1,123,740,339 | Form |
| 37 | Gajendra, Sanjay | President and COO | Trust 2 | Sell | 5112026 | 197.07 | 30,639 | 6,038,126 | 130,927,750 | Form |
| 38 | Mohan, Jitendra | Chief Executive Officer | Living Trust | Sell | 5112026 | 200.16 | 139,951 | 28,013,250 | 786,483,738 | Form |
| 39 | Dyckerhoff, Stefan A | Direct | Sell | 5112026 | 200.03 | 3,505 | 701,115 | 12,729,882 | Form | |
| 40 | Dyckerhoff, Stefan A | Trust | Sell | 5112026 | 200.03 | 8,333 | 1,666,875 | 65,623,814 | Form | |
| 41 | Dyckerhoff, Stefan A | Limited Partnership (TF) | Sell | 5112026 | 200.03 | 661 | 132,222 | 1,190,799 | Form | |
| 42 | Mohan, Jitendra | Chief Executive Officer | Living Trust | Sell | 4212026 | 175.45 | 10,188 | 1,787,442 | 713,912,416 | Form |
| 43 | Dyckerhoff, Stefan A | Direct | Sell | 4212026 | 175.12 | 3,757 | 657,926 | 11,758,257 | Form | |
| 44 | Dyckerhoff, Stefan A | Trust | Sell | 4212026 | 175.12 | 8,933 | 1,564,347 | 58,910,018 | Form | |
| 45 | Dyckerhoff, Stefan A | Limited Partnership (TF) | Sell | 4212026 | 175.12 | 709 | 124,160 | 1,158,244 | Form | |
| 46 | Mohan, Jitendra | Chief Executive Officer | Living Trust | Sell | 4212026 | 172.14 | 325,693 | 56,065,343 | 702,221,382 | Form |
| 47 | Dyckerhoff, Stefan A | Direct | Sell | 4212026 | 175.00 | 3,253 | 569,275 | 12,407,675 | Form | |
| 48 | Dyckerhoff, Stefan A | Trust | Sell | 4212026 | 175.00 | 7,733 | 1,353,275 | 60,432,925 | Form | |
| 49 | Dyckerhoff, Stefan A | Limited Partnership (TF) | Sell | 4212026 | 175.00 | 613 | 107,275 | 1,281,525 | Form | |
| 50 | Mohan, Jitendra | Chief Executive Officer | Living Trust | Sell | 4162026 | 174.60 | 2,967 | 518,036 | 769,112,664 | Form |
| 51 | Mohan, Jitendra | Chief Executive Officer | Living Trust | Sell | 4142026 | 149.68 | 123,750 | 18,522,445 | 659,770,551 | Form |
| 52 | Alba, Manuel | Alba Trust | Sell | 4032026 | 107.61 | 150,000 | 16,142,131 | 153,296,226 | Form | |
| 53 | Alba, Manuel | Casa Alameda 2007, LLC | Sell | 4032026 | 107.61 | 33,000 | 3,551,265 | 34,421,769 | Form | |
| 54 | Mazzara, Philip | General Counsel and Secretary | Direct | Sell | 4032026 | 107.77 | 10,000 | 1,077,663 | 12,725,474 | Form |
| 55 | Lazar, Jack R | Direct | Sell | 3172026 | 130.00 | 2,500 | 325,000 | 11,030,630 | Form | |
| 56 | Lazar, Jack R | Direct | Sell | 3092026 | 119.80 | 7,500 | 898,472 | 10,464,319 | Form | |
| 57 | Mazzara, Philip | General Counsel and Secretary | Direct | Sell | 3042026 | 117.47 | 10,000 | 1,174,741 | 15,046,547 | Form |
| 58 | Gajendra, Sanjay | President and COO | Direct | Sell | 2192026 | 123.81 | 94,971 | 11,758,146 | 189,586,932 | Form |
| 59 | Mohan, Jitendra | Chief Executive Officer | Direct | Sell | 2192026 | 123.81 | 94,971 | 11,758,146 | 179,860,348 | Form |
| 60 | Tate, Michael Truett | Chief Financial Officer | Direct | Sell | 2192026 | 123.81 | 12,001 | 1,485,784 | 23,780,846 | Form |
| 61 | Mazzara, Philip | General Counsel and Secretary | Direct | Sell | 2192026 | 123.80 | 4,849 | 600,328 | 17,095,409 | Form |
| 62 | Mazzara, Philip | General Counsel and Secretary | Direct | Sell | 1062026 | 178.41 | 10,000 | 1,784,071 | 24,448,909 | Form |
| 63 | Alba, Manuel | Casa Alameda 2007, LLC | Sell | 12032025 | 166.18 | 33,000 | 5,483,981 | 58,639,207 | Form | |
| 64 | Alba, Manuel | Alba Trust | Sell | 12032025 | 166.18 | 150,000 | 24,927,221 | 261,652,401 | Form | |
| 65 | Lazar, Jack R | Direct | Sell | 11212025 | 149.55 | 2,500 | 373,873 | 14,184,902 | Form | |
| 66 | Mazzara, Philip | General Counsel and Secretary | Direct | Sell | 11192025 | 144.69 | 4,620 | 668,477 | 21,275,497 | Form |
| 67 | Tate, Michael Truett | Chief Financial Officer | Direct | Sell | 11192025 | 144.69 | 11,430 | 1,653,859 | 27,824,336 | Form |
| 68 | Gajendra, Sanjay | President and COO | Direct | Sell | 11192025 | 144.69 | 90,459 | 13,088,904 | 231,474,746 | Form |
| 69 | Mohan, Jitendra | Chief Executive Officer | Direct | Sell | 11192025 | 144.69 | 90,459 | 13,088,904 | 301,024,677 | Form |
| 70 | Mazzara, Philip | General Counsel and Secretary | Direct | Sell | 10032025 | 192.16 | 10,000 | 1,921,572 | 29,125,846 | Form |
Investor Activity (13F)
Updated Nov 8, 2026Active managers (13F portfolio over $250M, at least 3 holdings) with a position over $5M that is either over 10% of their portfolio or held in a concentrated book of 50 or fewer total positions. Index/ETF, sovereign, bank, community-bank and charitable/donor-advised filers are excluded.
| Active Manager | Value | % of Portfolio | Total Positions | QoQ | Filing |
|---|---|---|---|---|---|
| Tensor Edge Capital, LLC | $25.0 Mil | 4.3% | 17 | ADD +246.1% | 13F |
| Strategy Capital LLC | $38.6 Mil | 3.2% | 11 | New | 13F |
| Estuary Capital Management LP | $18.7 Mil | 3.1% | 22 | New | 13F |
| E20 Capital Ltd | $33.3 Mil | 3.1% | 22 | New | 13F |
| Analog Century Management LP | $55.3 Mil | 2.6% | 25 | ADD +63.2% | 13F |
| Greenhouse Funds LLLP | $38.9 Mil | 1.8% | 28 | ADD +13.0% | 13F |
| KADENSA CAPITAL Ltd | $12.8 Mil | 1.8% | 39 | TRIM -5.1% | 13F |
| Amazon Com Inc | $30.4 Mil | 1.2% | 5 | Hold | 13F |
| FengHe Fund Management Pte. Ltd. | $8.1 Mil | 1.1% | 31 | TRIM -38.6% | 13F |
| Shannon River Fund Management LLC | $5.2 Mil | 1.0% | 28 | TRIM -71.7% | 13F |
| Anther Capital Ltd | $25.3 Mil | 0.7% | 31 | New | 13F |
| Active Manager | Value | % of Portfolio | Total Positions | QoQ | Filing |
|---|---|---|---|---|---|
| Strategy Capital LLC | $38.6 Mil | 3.2% | 11 | New | 13F |
| E20 Capital Ltd | $33.3 Mil | 3.1% | 22 | New | 13F |
| Anther Capital Ltd | $25.3 Mil | 0.7% | 31 | New | 13F |
| Estuary Capital Management LP | $18.7 Mil | 3.1% | 22 | New | 13F |
| Tensor Edge Capital, LLC | $25.0 Mil | 4.3% | 17 | ADD +246.1% | 13F |
| Analog Century Management LP | $55.3 Mil | 2.6% | 25 | ADD +63.2% | 13F |
| Greenhouse Funds LLLP | $38.9 Mil | 1.8% | 28 | ADD +13.0% | 13F |
| Active Manager | Value | % of Portfolio | Total Positions | QoQ | As Of | Filing |
|---|---|---|---|---|---|---|
| WT Asset Management Ltd | $15.4 Mil | 0.6% | 42 | Exited | Dec 31, 2025 | 13F |
| Deepwater Asset Management, LLC | $8.6 Mil | 2.5% | 46 | Exited | Dec 31, 2025 | 13F |
| Shannon River Fund Management LLC | $5.2 Mil | 1.0% | 28 | TRIM -71.7% | Mar 31, 2026 | 13F |
| FengHe Fund Management Pte. Ltd. | $8.1 Mil | 1.1% | 31 | TRIM -38.6% | Mar 31, 2026 | 13F |
| KADENSA CAPITAL Ltd | $12.8 Mil | 1.8% | 39 | TRIM -5.1% | Mar 31, 2026 | 13F |
| Active Manager | Value | % of Portfolio | Total Positions | QoQ | Filing |
|---|---|---|---|---|---|
| Analog Century Management LP | $55.3 Mil | 2.6% | 25 | ADD +63.2% | 13F |
| Greenhouse Funds LLLP | $38.9 Mil | 1.8% | 28 | ADD +13.0% | 13F |
| Strategy Capital LLC | $38.6 Mil | 3.2% | 11 | New | 13F |
| E20 Capital Ltd | $33.3 Mil | 3.1% | 22 | New | 13F |
| Amazon Com Inc | $30.4 Mil | 1.2% | 5 | Hold | 13F |
| Anther Capital Ltd | $25.3 Mil | 0.7% | 31 | New | 13F |
| Tensor Edge Capital, LLC | $25.0 Mil | 4.3% | 17 | ADD +246.1% | 13F |
| Estuary Capital Management LP | $18.7 Mil | 3.1% | 22 | New | 13F |
| KADENSA CAPITAL Ltd | $12.8 Mil | 1.8% | 39 | TRIM -5.1% | 13F |
| FengHe Fund Management Pte. Ltd. | $8.1 Mil | 1.1% | 31 | TRIM -38.6% | 13F |
| Shannon River Fund Management LLC | $5.2 Mil | 1.0% | 28 | TRIM -71.7% | 13F |
Astera Labs — Investor Video Playlist





Industry Resources
| Information Technology Resources |
| TechCrunch |
| Wired |
| CIO |
| MIT Technology Review |
| Gartner Insights |
| Ars Technica |
| Semiconductors Resources |
| EE Times |
| Semiconductor Engineering |
| Semiconductor Digest |
External Quote Links
| Y Finance | Barrons |
| TradingView | Morningstar |
| SeekingAlpha | ValueLine |
| Motley Fool | Robinhood |
| CNBC | Etrade |
| MarketWatch | Unusual Whales |
| YCharts | Perplexity Finance |
| FinViz |
Prefer one of these to Trefis? Tell us why.