
Zeta Global (ZETA)
Market Price (9/27/2026): $29.43 | Market Cap: $7.2 BilSector: Information Technology | Industry: Systems Software
Zeta Global (ZETA)
Market Price (9/27/2026): $29.43Market Cap: $7.2 BilSector: Information TechnologyIndustry: Systems Software
Investment Highlights Why It Matters Detailed financial logic regarding cash flow yields vs trend-riding momentum.
Strong revenue growthRev Chg LTMRevenue Change % Last Twelve Months (LTM) is 36% Attractive cash flow generationCFO/Rev LTMCash Flow from Operations / Revenue (Sales), Last Twelve Months (LTM) is 15%, FCF/Rev LTMFree Cash Flow / Revenue (Sales), Last Twelve Months (LTM) is 13% Megatrend and thematic driversMegatrends include Digital Advertising, Artificial Intelligence, and E-commerce & Digital Retail. Themes include Ad-Tech Platforms, Show more. | Weak multi-year price returns2Y Excs Rtn is -34% | Stock price has recently run up significantly6M Rtn6 month market price return is 102% Significant share based compensationSBC/Rev LTMShare Based Compensation / Revenue (Sales), Last Twelve Months (LTM) is 12% Valuation getting more expensiveP/S 6M Chg %Price/Sales change over 6 months. Declining P/S indicates valuation has become less expensive. is 74% Yield minus risk free rate is negativeERPEquity Risk Premium (ERP) = Total Yield - Risk Free Rate, Reflects the premium above risk free assets offered by the investment. is -4.0% Key risksZETA key risks include [1] an ongoing class action lawsuit alleging financial manipulation through "round trip transactions" and [2] claims of using "predatory consent farms" for user data collection. |
| Strong revenue growthRev Chg LTMRevenue Change % Last Twelve Months (LTM) is 36% |
| Attractive cash flow generationCFO/Rev LTMCash Flow from Operations / Revenue (Sales), Last Twelve Months (LTM) is 15%, FCF/Rev LTMFree Cash Flow / Revenue (Sales), Last Twelve Months (LTM) is 13% |
| Megatrend and thematic driversMegatrends include Digital Advertising, Artificial Intelligence, and E-commerce & Digital Retail. Themes include Ad-Tech Platforms, Show more. |
| Weak multi-year price returns2Y Excs Rtn is -34% |
| Stock price has recently run up significantly6M Rtn6 month market price return is 102% |
| Significant share based compensationSBC/Rev LTMShare Based Compensation / Revenue (Sales), Last Twelve Months (LTM) is 12% |
| Valuation getting more expensiveP/S 6M Chg %Price/Sales change over 6 months. Declining P/S indicates valuation has become less expensive. is 74% |
| Yield minus risk free rate is negativeERPEquity Risk Premium (ERP) = Total Yield - Risk Free Rate, Reflects the premium above risk free assets offered by the investment. is -4.0% |
| Key risksZETA key risks include [1] an ongoing class action lawsuit alleging financial manipulation through "round trip transactions" and [2] claims of using "predatory consent farms" for user data collection. |
Qualitative Assessment
AI Analysis | Feedback
Zeta Global (ZETA) stock has gained about 30% since 5/31/2026 because of the following key factors:
1. Strong Fiscal Q2 2026 Revenue Beat and Raised Full-Year Guidance. Zeta Global reported fiscal Q2 2026 (ended June 30, 2026) revenue of $443 million, which represented a 44% year-over-year increase and exceeded analyst consensus estimates of $420.61 million by approximately 5%. This marked the company's 20th consecutive "beat and raise" quarter. Following these results, Zeta Global raised its full-year 2026 revenue guidance to a midpoint of $1.818 billion, reflecting an anticipated 39% year-over-year growth. The company also increased its fiscal Q3 2026 revenue guidance to a midpoint of $471 million, surpassing the analyst consensus of $461 million.
2. Improved Profitability and Positive GAAP Net Income. For fiscal Q2 2026, Zeta Global achieved a positive GAAP net income of $8.2 million, or $0.03 per share, after reporting a loss in the previous quarter. Although the reported adjusted EPS of $0.03 fell short of some analyst consensus estimates, the company's adjusted EBITDA increased by 56% year-over-year to $92 million. Furthermore, Zeta Global raised its full-year 2026 GAAP EPS guidance to a midpoint of $0.10, a significant increase of over 300% from its prior guidance.
Show more
Zeta Global (ZETA) stock has gained about 30% since 5/31/2026 because of the following key factors:
1. Strong Fiscal Q2 2026 Revenue Beat and Raised Full-Year Guidance. Zeta Global reported fiscal Q2 2026 (ended June 30, 2026) revenue of $443 million, which represented a 44% year-over-year increase and exceeded analyst consensus estimates of $420.61 million by approximately 5%. This marked the company's 20th consecutive "beat and raise" quarter. Following these results, Zeta Global raised its full-year 2026 revenue guidance to a midpoint of $1.818 billion, reflecting an anticipated 39% year-over-year growth. The company also increased its fiscal Q3 2026 revenue guidance to a midpoint of $471 million, surpassing the analyst consensus of $461 million.
2. Improved Profitability and Positive GAAP Net Income. For fiscal Q2 2026, Zeta Global achieved a positive GAAP net income of $8.2 million, or $0.03 per share, after reporting a loss in the previous quarter. Although the reported adjusted EPS of $0.03 fell short of some analyst consensus estimates, the company's adjusted EBITDA increased by 56% year-over-year to $92 million. Furthermore, Zeta Global raised its full-year 2026 GAAP EPS guidance to a midpoint of $0.10, a significant increase of over 300% from its prior guidance.
3. Accelerated AI Infrastructure Focus and Strategic Partnerships. Zeta Global reinforced its positioning as an "intelligent AI infrastructure company," leveraging its Zeta Data Cloud and Athena by Zeta™ platform. Key growth catalysts included strategic partnerships announced with OpenAI, which powers Athena's personalization layer, and Palantir, whose Foundry platform was integrated with Zeta's data cloud as of July 31, 2026, with initial deals already signed. The expansion of the Athena AI marketing agent to advertising and media agencies also contributed to an over 60% year-over-year growth in the sales pipeline.
4. Positive Analyst Sentiment and Upgraded Price Targets. Following the robust fiscal Q2 2026 earnings and strategic advancements, analyst sentiment remained largely positive. Several research firms maintained or upgraded their ratings and raised price targets for Zeta Global. For instance, DA Davidson increased its price target from $30.00 to $32.00 in August 2026. As of September 11, 2026, the stock held a "Buy" consensus rating from 12 analysts, with 67% recommending "Strong Buy" and an average price target of $30.77.
Show less
Stock Movement Drivers
Fundamental Drivers
The 28.7% change in ZETA stock from 5/31/2026 to 9/26/2026 was primarily driven by a 21.0% change in the company's P/S Multiple.| (LTM values as of) | 5312026 | 9262026 | Change |
|---|---|---|---|
| Stock Price ($) | 22.89 | 29.45 | 28.7% |
| Change Contribution By: | |||
| Total Revenues ($ Mil) | 1,437 | 1,571 | 9.4% |
| P/S Multiple | 3.8 | 4.6 | 21.0% |
| Shares Outstanding (Mil) | 239 | 245 | -2.8% |
| Cumulative Contribution | 28.7% |
Market Drivers
5/31/2026 to 9/26/2026| Return | Correlation | |
|---|---|---|
| ZETA | 28.7% | |
| Market (SPY) | 2.2% | 30.5% |
| Sector (XLK) | 2.9% | 12.2% |
Fundamental Drivers
The 73.7% change in ZETA stock from 2/28/2026 to 9/26/2026 was primarily driven by a 53.6% change in the company's P/S Multiple.| (LTM values as of) | 2282026 | 9262026 | Change |
|---|---|---|---|
| Stock Price ($) | 16.95 | 29.45 | 73.7% |
| Change Contribution By: | |||
| Total Revenues ($ Mil) | 1,305 | 1,571 | 20.4% |
| P/S Multiple | 3.0 | 4.6 | 53.6% |
| Shares Outstanding (Mil) | 231 | 245 | -6.0% |
| Cumulative Contribution | 73.7% |
Market Drivers
2/28/2026 to 9/26/2026| Return | Correlation | |
|---|---|---|
| ZETA | 73.7% | |
| Market (SPY) | 13.0% | 34.5% |
| Sector (XLK) | 41.8% | 23.0% |
Fundamental Drivers
The 49.9% change in ZETA stock from 8/31/2025 to 9/26/2026 was primarily driven by a 35.9% change in the company's Total Revenues ($ Mil).| (LTM values as of) | 8312025 | 9262026 | Change |
|---|---|---|---|
| Stock Price ($) | 19.64 | 29.45 | 49.9% |
| Change Contribution By: | |||
| Total Revenues ($ Mil) | 1,156 | 1,571 | 35.9% |
| P/S Multiple | 3.7 | 4.6 | 24.6% |
| Shares Outstanding (Mil) | 217 | 245 | -11.4% |
| Cumulative Contribution | 49.9% |
Market Drivers
8/31/2025 to 9/26/2026| Return | Correlation | |
|---|---|---|
| ZETA | 49.9% | |
| Market (SPY) | 20.9% | 44.1% |
| Sector (XLK) | 50.4% | 33.7% |
Fundamental Drivers
The 262.2% change in ZETA stock from 8/31/2023 to 9/26/2026 was primarily driven by a 140.4% change in the company's P/S Multiple.| (LTM values as of) | 8312023 | 9262026 | Change |
|---|---|---|---|
| Stock Price ($) | 8.13 | 29.45 | 262.2% |
| Change Contribution By: | |||
| Total Revenues ($ Mil) | 657 | 1,571 | 139.2% |
| P/S Multiple | 1.9 | 4.6 | 140.4% |
| Shares Outstanding (Mil) | 155 | 245 | -37.0% |
| Cumulative Contribution | 262.2% |
Market Drivers
8/31/2023 to 9/26/2026| Return | Correlation | |
|---|---|---|
| ZETA | 262.2% | |
| Market (SPY) | 77.8% | 42.7% |
| Sector (XLK) | 127.9% | 36.8% |
Price Returns Compared
| 2021 | 2022 | 2023 | 2024 | 2025 | 2026 | Total [1] | |
|---|---|---|---|---|---|---|---|
| Returns | |||||||
| ZETA Return | -5% | -3% | 8% | 104% | 13% | 45% | 233% |
| Peers Return | 23% | -67% | 96% | 140% | 35% | -15% | 118% |
| S&P 500 Return | 27% | -19% | 24% | 23% | 16% | 13% | 105% |
Monthly Win Rates [3] | |||||||
| ZETA Win Rate | 57% | 50% | 58% | 75% | 67% | 44% | |
| Peers Win Rate | 53% | 27% | 65% | 62% | 47% | 36% | |
| S&P 500 Win Rate | 75% | 42% | 67% | 75% | 67% | 56% | |
Max Drawdowns [4] | |||||||
| ZETA Max Drawdown | - | -68% | -34% | -53% | -55% | -40% | |
| Peers Max Drawdown | -40% | -72% | -38% | -42% | -60% | -57% | |
| S&P 500 Max Drawdown | -5% | -25% | -10% | -8% | -19% | -9% | |
[1] Cumulative total returns since the beginning of 2021
[2] Peers: HUBS, BRZE, TTD, APP, APPS.
[3] Win Rate = % of calendar months in which monthly returns were positive
[4] Max drawdown represents maximum peak-to-trough decline within a year
[5] 2026 data is for the year up to 9/25/2026 (YTD)
How Low Can It Go
| Event | ZETA | S&P 500 |
|---|---|---|
| 2025 US Tariff Shock | ||
| % Loss | -52.3% | -18.8% |
| % Gain to Breakeven | 109.4% | 23.1% |
| Time to Breakeven | 260 days | 79 days |
| Summer-Fall 2023 Five Percent Yield Shock | ||
| % Loss | -17.7% | -9.5% |
| % Gain to Breakeven | 21.6% | 10.5% |
| Time to Breakeven | 57 days | 24 days |
| 2023 SVB Regional Banking Crisis | ||
| % Loss | -17.0% | -6.7% |
| % Gain to Breakeven | 20.6% | 7.1% |
| Time to Breakeven | 190 days | 31 days |
| 2022 Inflation Shock & Fed Tightening | ||
| % Loss | -50.7% | -24.5% |
| % Gain to Breakeven | 102.8% | 32.4% |
| Time to Breakeven | 133 days | 427 days |
In The Past
Zeta Global's stock fell -52.3% during the 2025 US Tariff Shock. Such a loss loss requires a 109.4% gain to breakeven.
Preserve Wealth
Limiting losses and compounding gains is essential to preserving wealth.
Asset Allocation
Actively managed asset allocation strategies protect wealth. Learn more.
| Event | ZETA | S&P 500 |
|---|---|---|
| 2025 US Tariff Shock | ||
| % Loss | -52.3% | -18.8% |
| % Gain to Breakeven | 109.4% | 23.1% |
| Time to Breakeven | 260 days | 79 days |
| 2022 Inflation Shock & Fed Tightening | ||
| % Loss | -50.7% | -24.5% |
| % Gain to Breakeven | 102.8% | 32.4% |
| Time to Breakeven | 133 days | 427 days |
In The Past
Zeta Global's stock fell -52.3% during the 2025 US Tariff Shock. Such a loss loss requires a 109.4% gain to breakeven.
Preserve Wealth
Limiting losses and compounding gains is essential to preserving wealth.
Asset Allocation
Actively managed asset allocation strategies protect wealth. Learn more.
About Zeta Global (ZETA)
Zeta Global (ZETA) operates a comprehensive, data-driven cloud platform that provides enterprises with advanced consumer intelligence and marketing automation software. At its core, the company analyzes billions of structured and unstructured data points, leveraging sophisticated machine learning algorithms and an extensive opted-in data set to predict consumer intent and behavior. Its main offerings include the Zeta Marketing Platform (ZMP), which facilitates omnichannel marketing based on these predictions, and a powerful Consumer Data Platform (CDP) designed to ingest and distill disparate data into a single, unified view of each consumer, detailing their identity, profile, behaviors, and purchase intent.
In addition to its core platforms, Zeta Global offers product suites such as Opportunity Explorer and CDP+, which assist enterprises in consolidating and organizing multiple databases and data feeds according to specific needs and performance metrics. The company primarily serves a broad range of enterprises, helping them enhance their marketing effectiveness and customer engagement across both the United States and international markets. Essentially, Zeta Global empowers businesses to understand their customers more deeply and automate personalized marketing campaigns.
AI Analysis | Feedback
Here are 1-3 brief analogies for Zeta Global:
Adobe Experience Cloud for predicting consumer intent.
Salesforce Marketing Cloud for AI-driven consumer intelligence.
AI Analysis | Feedback
- Zeta Marketing Platform: Analyzes data to predict consumer intent and provides marketing automation software for omnichannel marketing.
- Consumer Data Platform (CDP): Ingests and analyzes disparate data to generate a single, comprehensive view of a consumer.
- Opportunity Explorer: A product suite designed to help enterprises identify and explore various business opportunities.
- CDP+: A product suite that consolidates and organizes multiple internal and external data feeds based on specific needs and performance metrics.
AI Analysis | Feedback
Zeta Global (symbol: ZETA) sells primarily to other companies (B2B), providing its omnichannel data-driven cloud platform for consumer intelligence and marketing automation software to enterprises.
While specific major customer names are not publicly disclosed due to client confidentiality and Zeta Global's diversified customer base (its SEC filings confirm no single customer accounts for more than 10% of its revenue for the years ended December 31, 2022, 2021, and 2020), their clientele typically consists of large organizations across various sectors that rely heavily on consumer data and sophisticated marketing strategies. These often include companies in industries such as:
- Financial Services (e.g., banks, insurance providers, credit card companies)
- Retail and E-commerce (large brick-and-mortar retailers, online brands)
- Telecommunications (e.g., mobile carriers, internet service providers)
- Automotive (manufacturers and dealerships)
- Media and Entertainment (publishers, streaming services)
AI Analysis | Feedback
- Amazon.com, Inc. (AMZN)
- Microsoft Corporation (MSFT)
AI Analysis | Feedback
David A. Steinberg, Co-Founder, Chairman & CEO
David A. Steinberg co-founded Zeta Global in 2007 and has served as its Chairman and CEO. A serial entrepreneur with over 30 years of experience, he has founded seven companies, sold four, and taken two public. Prior to Zeta, he founded and was CEO of InPhonic, an online seller of wireless phones and services which went public, and Sterling Cellular, where he sold off its retail and telemarketing operations. He also serves as Chairman of CAIVIS Acquisition Corp. While a direct pattern of managing private equity-backed companies isn't explicitly stated as a core strategy, Zeta Global did raise $125 million from Blackstone's GSO Capital Partners in 2015 to fund acquisitions.
Christopher Greiner, Chief Financial Officer
Christopher Greiner joined Zeta Global as Chief Financial Officer in 2020, bringing over 20 years of experience in the technology industry. Before his role at Zeta, he served as CFO of LivePerson Inc. from 2018 to 2020. He also spent five years at Inovalon, a cloud-based healthcare and life sciences analytics company, where he initially served as Chief Product and Operations Officer before becoming CFO. Earlier in his career, Mr. Greiner held various executive roles at IBM from 1999 to 2012 and at Computer Sciences Corporation (CSC) from 2012 to 2013.
Steven Gerber, President
Steven Gerber has been a leader at Zeta Global since 2009 and currently serves as President, overseeing the company's day-to-day management, including product development, business development, customer success, and operations. He possesses over 20 years of experience in data-driven digital technology. Previously, Mr. Gerber was a Senior Vice President at Tranzact LLC and held management positions at Bain & Company and Digitas LLC. He also served as President & COO of Active Response Group, which was subsequently sold and integrated into Caivis Acquisition Corp.
Christian Monberg, Chief Technology Officer and Head of Product
Christian Monberg has been a Zeta leader since 2017. He is responsible for overseeing the product and technical vision, with a primary focus on developing and acquiring key AI, data, and identity assets for the Zeta Marketing Platform. Prior to joining Zeta, Mr. Monberg co-founded Boomtrain, an AI-powered marketing platform that was acquired by Zeta Global.
Steve Vine, EVP of Mergers and Acquisitions and General Counsel
Steve Vine is the Executive Vice President of Mergers and Acquisitions and General Counsel at Zeta Global. Before his tenure at Zeta, he was the Senior Vice President of Corporate Development and General Counsel at PulsePoint, where he was instrumental in leading multiple acquisitions and transforming the company into a prominent Content Marketing platform.
AI Analysis | Feedback
The key risks to Zeta Global's business operations are primarily centered around intense market competition, evolving data privacy and regulatory landscapes, and the impact of macroeconomic conditions on marketing spending.
- Intense Competition: Zeta Global operates in a highly competitive digital marketing technology sector. The company faces significant competition from well-established and well-funded players such as Adobe and Salesforce, which possess extensive resources and broad product portfolios. Additionally, the emergence of innovative new startups in the marketing technology space could further disrupt the market and challenge Zeta's ability to maintain and expand its market share and growth rate.
- Data Privacy, Security, and Regulatory Challenges: As a data-driven platform that analyzes billions of data points, Zeta Global is continuously exposed to scrutiny and potential risks related to data collection, privacy, and security. Evolving global regulations concerning data protection and privacy, as well as the use of AI technologies, pose significant compliance challenges for the company. Non-compliance with these regulations could result in substantial fines, legal action, and significant damage to Zeta's reputation.
- Macroeconomic Conditions: Zeta Global's revenue is susceptible to broader economic downturns or uncertainties. During periods of economic slowdown, companies often reduce their marketing and advertising budgets, directly impacting the demand for Zeta's consumer intelligence and marketing automation software. This reliance on client marketing expenditures exposes the company to cyclical constraints, potentially leading to reduced revenue predictability.
AI Analysis | Feedback
AI Analysis | Feedback
Zeta Global (ZETA) operates within several significant addressable markets for its main products and services, including marketing automation software, customer data platforms (CDP), consumer intelligence platforms, and broader omnichannel marketing platforms.
Marketing Automation Software
The global marketing automation software market was valued at USD 11.42 billion in 2024 and is projected to reach USD 28.48 billion by 2032, exhibiting a compound annual growth rate (CAGR) of 12.10% during the forecast period. North America is a dominant region in this market, holding approximately 40% of the global market share.
Customer Data Platforms (CDP)
The global customer data platform (CDP) market size was estimated at USD 8.26 billion in 2025 and is projected to reach USD 58.41 billion by 2033, growing at a CAGR of 27.8% from 2026 to 2033. North America held the largest revenue share of 37.6% in the global CDP market in 2025.
Consumer Intelligence Platforms
The global customer intelligence platform market size was estimated at USD 3,092.7 million in 2024 and is projected to reach USD 13,812.8 million by 2030, growing at a CAGR of 29.2% from 2025 to 2030. North America was the largest revenue-generating market in 2024, accounting for 35.5% of the global market.
Omnichannel Automated Marketing Platforms
The global omnichannel automated marketing platform market was valued at USD 47.02 billion in 2025 and is projected to experience a robust Compound Annual Growth Rate (CAGR) of 11.5% from 2025 to 2033. North America accounts for approximately 40% of the global market share in this segment.
AI Analysis | Feedback
- AI Advancements and New Product Launches (Athena): Zeta Global is strategically investing in artificial intelligence and machine learning to drive future revenue. The company's AI platform, Athena, is expected to be a significant catalyst for growth, enhancing customer engagement and return on investment for clients by bringing generative AI capabilities to campaign optimization and automating marketing actions. Athena is planned for general availability to all customers by the end of Q1 2026.
- Growth in Scaled and Super-Scaled Customers: Zeta Global consistently emphasizes the expansion of its customer base, particularly those defined as "scaled customers" (spending over $100,000 annually) and "super-scaled customers" (spending over $1 million annually). The company has demonstrated a consistent increase in both the number of these high-value customers and their average revenue per user (ARPU).
- Expansion of Platform Use Cases and Customer Lifetime Value ("OneZeta"): A key driver is increasing the adoption of multiple use cases among existing clients through initiatives like "OneZeta." Customers who utilize more of Zeta's integrated platform services tend to spend significantly more, with multi-use case clients spending over three times the annual revenue of single-use case customers. This strategy focuses on deepening customer relationships and increasing their lifetime value.
- Strategic Acquisitions and Market Consolidation: Zeta Global has historically leveraged strategic acquisitions to expand its offerings and market presence. The integration of acquisitions, such as LiveIntent in 2025, has expanded Zeta's identity graph and presence in areas like email and retail media. The company aims to position itself as a consolidator in the fragmented marketing landscape.
- Geographic Expansion: While a majority of its sales are currently driven by the United States, Zeta Global is increasing investment in international markets, specifically EMEA and APAC, where digital transformation budgets are growing. This regional expansion aims to capture higher demand for marketing automation and personalized marketing at scale.
AI Analysis | Feedback
Share Repurchases
- Zeta Global's board of directors authorized a new stock repurchase program of up to $200 million in August 2025, which also included provisions for withholding shares to satisfy tax requirements upon vesting of restricted stock awards.
- For the full year 2025, Zeta Global repurchased 7.9 million shares for $120 million, including 1.9 million shares for $35 million in the fourth quarter of 2025.
- In October to December 2024, the company completed two buyback tranches, repurchasing over 1.5 million shares for $30.77 million.
Share Issuance
- As part of the acquisition of Marigold's enterprise software business in November 2025, Zeta Global issued 5,329,070 new shares of Class A common stock.
Outbound Investments
- Zeta Global completed the acquisition of Marigold's enterprise software business in November 2025 for an aggregate consideration of up to $325 million.
- The consideration for the Marigold acquisition included $100 million in cash, 5,329,070 newly issued shares of Class A common stock, and seller notes totaling up to $125 million, which could be paid in cash or additional shares at Zeta's discretion.
- This acquisition was strategic, expanding Zeta's global footprint and enhancing its AI-powered offerings across loyalty, omnichannel engagement, and personalization, while increasing its presence among Fortune 500 brands.
Capital Expenditures
- Zeta Global's capital expenditures coverage averaged 6.7x from fiscal years ending December 2020 to 2024.
- Capital expenditures coverage saw fluctuations, decreasing in 2021 (4.7x) and 2022 (3.5x), then increasing in 2023 (4.4x) and 2024 (5.2x).
- The company's capital expenditures are primarily financed through cash generated from operations and borrowings under credit facilities, with an estimated $8.2 million in capital expenditures in Q4 2025.
Peer Outperformance in Systems Software
| Industry | Names | 1Y med | 3Y med | 5Y med | Top 3 by 5Y |
|---|---|---|---|---|---|
| Electronic Manufacturing Services | 9 | 67.8% | 202.9% | 283.6% | TTMI 915% · FLEX 725% · SANM 466% |
| Semiconductor Materials & Equipment | 27 | 97.2% | 97.4% | 112.0% | AXTI 797% · AEHR 592% · KLAC 439% |
| Technology Distributors | 9 | 41.0% | 84.4% | 101.6% | CLMB 402% · AVT 204% · SNX 148% |
| Communications Equipment | 36 | 17.2% | 95.3% | 67.6% | AAOI 1301% · FEIM 1069% · LITE 995% |
| Electronic Components | 26 | 42.0% | 70.3% | 64.8% | CLS 3788% · BELFA 1333% · COHR 387% |
| Semiconductors | 55 | 34.9% | 42.6% | 39.9% | POET 1808% · MU 1376% · NVDA 944% |
| Technology Hardware, Storage & Peripherals | 20 | 19.0% | 131.3% | 29.5% | STX 1116% · DELL 1073% · SMCI 1042% |
| Internet Services & Infrastructure | 6 | 4.9% | 51.3% | 28.2% | DOCN 71% · VRSN 37% · GDDY 37% |
| Electronic Equipment & Instruments | 26 | -16.6% | 16.4% | -10.4% | PI 192% · OSIS 107% · KEYS 105% |
| IT Consulting & Other Services | 30 | -25.3% | -17.4% | -35.9% | CHRN 522268% · APLD 1174% · TSSI 797% |
| Application Software | 124 | -29.5% | -14.8% | -48.5% | VIDA 144067% · INLX 4910% · PLTR 590% |
| Systems Software ← | 72 | -20.9% | 9.9% | -62.8% | QNC 640% · ZETA 408% · PANW 363% |
Latest Trefis Analyses
Research & Analysis
Invest in Strategies
Wealth Management
Peer Comparisons
| Peers to compare with: |
Financials
| Median | |
|---|---|
| Name | |
| Mkt Price | 26.91 |
| Mkt Cap | 7.2 |
| Rev LTM | 2,990 |
| Op Inc LTM | 135 |
| FCF LTM | 658 |
| FCF 3Y Avg | 499 |
| CFO LTM | 856 |
| CFO 3Y Avg | 658 |
Growth & Margins
| Median | |
|---|---|
| Name | |
| Rev Chg LTM | 21.1% |
| Rev Chg 3Y Avg | 21.1% |
| Rev Chg Q | 26.8% |
| QoQ Delta Rev Chg LTM | 6.2% |
| Op Inc Chg LTM | 244.8% |
| Op Inc Chg 3Y Avg | 112.4% |
| Op Mgn LTM | 10.3% |
| Op Mgn 3Y Avg | -0.6% |
| QoQ Delta Op Mgn LTM | 1.2% |
| CFO/Rev LTM | 24.8% |
| CFO/Rev 3Y Avg | 22.3% |
| FCF/Rev LTM | 19.1% |
| FCF/Rev 3Y Avg | 16.9% |
Price Behavior
| Market Price | $29.45 | |
| Market Cap ($ Bil) | 7.2 | |
| First Trading Date | 06/10/2021 | |
| Distance from 52W High | -9.9% | |
| 50 Days | 200 Days | |
| DMA Price | $27.42 | $20.90 |
| DMA Trend | up | up |
| Distance from DMA | 7.4% | 40.9% |
| 3M | 1YR | |
| Volatility | 57.0% | 66.6% |
| Downside Capture | 57.63 | 251.82 |
| Upside Capture | 254.69 | 248.71 |
| Correlation (SPY) | 28.0% | 43.8% |
| 1M | 2M | 3M | 6M | 1Y | 3Y | |
|---|---|---|---|---|---|---|
| Beta | 3.25 | 1.72 | 1.48 | 1.61 | 2.36 | 1.95 |
| Up Beta | 3.96 | 0.71 | 0.29 | 0.61 | 1.29 | 1.64 |
| Down Beta | 7.09 | 1.14 | 1.59 | 1.57 | 2.55 | 2.05 |
| Up Capture | 523% | 424% | 301% | 362% | 647% | 2195% |
| Bmk +ve Days | 10 | 21 | 32 | 68 | 138 | 427 |
| Stock +ve Days | 13 | 23 | 32 | 67 | 133 | 407 |
| Down Capture | -183% | 63% | 116% | 142% | 171% | 112% |
| Bmk -ve Days | 11 | 21 | 32 | 59 | 113 | 324 |
| Stock -ve Days | 8 | 19 | 32 | 59 | 116 | 336 |
[1] Upside and downside betas calculated using positive and negative benchmark daily returns respectively
Based On 1-Year Data
| Annualized Return | Annualized Volatility | Sharpe Ratio | Correlation with ZETA | |
|---|---|---|---|---|
| ZETA | 43.4% | 66.3% | 0.80 | - |
| Sector ETF (XLK) | 41.7% | 26.4% | 1.28 | 33.6% |
| Equity (SPY) | 17.7% | 13.0% | 0.98 | 43.7% |
| Gold (GLD) | 14.7% | 29.3% | 0.46 | 13.5% |
| Commodities (DBC) | 44.3% | 20.7% | 1.66 | -2.7% |
| Real Estate (VNQ) | 4.5% | 13.6% | 0.07 | 11.3% |
| Bitcoin (BTCUSD) | -25.9% | 44.8% | -0.54 | 33.0% |
Smart multi-asset allocation framework can stack odds in your favor. Learn How
Based On 5-Year Data
| Annualized Return | Annualized Volatility | Sharpe Ratio | Correlation with ZETA | |
|---|---|---|---|---|
| ZETA | 36.6% | 71.8% | 0.74 | - |
| Sector ETF (XLK) | 21.3% | 26.0% | 0.73 | 41.8% |
| Equity (SPY) | 13.3% | 17.2% | 0.59 | 44.6% |
| Gold (GLD) | 19.2% | 18.8% | 0.83 | 7.6% |
| Commodities (DBC) | 10.8% | 19.6% | 0.43 | 6.1% |
| Real Estate (VNQ) | 0.9% | 18.9% | -0.06 | 28.5% |
| Bitcoin (BTCUSD) | 12.2% | 52.6% | 0.41 | 25.8% |
Smart multi-asset allocation framework can stack odds in your favor. Learn How
Based On 10-Year Data
| Annualized Return | Annualized Volatility | Sharpe Ratio | Correlation with ZETA | |
|---|---|---|---|---|
| ZETA | 12.9% | 71.5% | 0.63 | - |
| Sector ETF (XLK) | 24.8% | 25.0% | 0.90 | 40.6% |
| Equity (SPY) | 15.5% | 17.9% | 0.73 | 43.4% |
| Gold (GLD) | 12.1% | 16.4% | 0.61 | 7.7% |
| Commodities (DBC) | 8.5% | 18.1% | 0.38 | 6.6% |
| Real Estate (VNQ) | 4.8% | 20.7% | 0.19 | 27.6% |
| Bitcoin (BTCUSD) | 63.8% | 66.2% | 1.03 | 24.7% |
Smart multi-asset allocation framework can stack odds in your favor. Learn How
Returns Analyses
Earnings Returns History
Updated 9/4/2026| Forward Returns | |||
|---|---|---|---|
| Earnings Date | 1D Returns | 5D Returns | 21D Returns |
| 8/4/2026 | 11.6% | 20.2% | 25.5% |
| 4/30/2026 | 1.0% | -6.2% | 36.9% |
| 2/24/2026 | 5.1% | 6.2% | -3.7% |
| 11/4/2025 | 19.4% | 18.6% | 14.1% |
| 8/5/2025 | 27.5% | 16.8% | 17.7% |
| 5/1/2025 | 1.4% | -1.3% | -4.2% |
| 2/25/2025 | -13.7% | -18.2% | -26.7% |
| 11/12/2024 | -23.2% | -46.7% | -41.4% |
| ... | |||
| SUMMARY STATS | |||
| # Positive | 14 | 10 | 13 |
| # Negative | 7 | 11 | 8 |
| Median Positive | 11.8% | 14.8% | 14.1% |
| Median Negative | -9.2% | -6.2% | -9.3% |
| Max Positive | 27.5% | 21.4% | 36.9% |
| Max Negative | -23.2% | -46.7% | -41.4% |
| Forward Returns | |||
|---|---|---|---|
| Earnings Date | 1D Returns | 5D Returns | 21D Returns |
| 8/4/2026 | 11.6% | 20.2% | 25.5% |
| 4/30/2026 | 1.0% | -6.2% | 36.9% |
| 2/24/2026 | 5.1% | 6.2% | -3.7% |
| 11/4/2025 | 19.4% | 18.6% | 14.1% |
| 8/5/2025 | 27.5% | 16.8% | 17.7% |
| 5/1/2025 | 1.4% | -1.3% | -4.2% |
| 2/25/2025 | -13.7% | -18.2% | -26.7% |
| 11/12/2024 | -23.2% | -46.7% | -41.4% |
| 7/31/2024 | 12.0% | 5.3% | 21.1% |
| 5/6/2024 | 18.3% | 21.4% | 27.2% |
| 2/27/2024 | -1.5% | -6.6% | 1.6% |
| 11/1/2023 | 4.8% | 8.8% | 9.2% |
| 8/2/2023 | 13.6% | -5.4% | -2.8% |
| 5/4/2023 | -9.2% | -9.7% | -3.8% |
| 2/23/2023 | 18.1% | 15.6% | 13.1% |
| 11/1/2022 | -3.7% | -1.1% | 4.9% |
| 8/3/2022 | 7.7% | 14.0% | 1.1% |
| 5/10/2022 | -10.1% | -4.3% | -16.3% |
| 2/23/2022 | 18.0% | 9.0% | 8.4% |
| 11/9/2021 | 0.0% | -7.7% | -14.5% |
| 8/10/2021 | -7.3% | -2.4% | 14.9% |
| SUMMARY STATS | |||
| # Positive | 14 | 10 | 13 |
| # Negative | 7 | 11 | 8 |
| Median Positive | 11.8% | 14.8% | 14.1% |
| Median Negative | -9.2% | -6.2% | -9.3% |
| Max Positive | 27.5% | 21.4% | 36.9% |
| Max Negative | -23.2% | -46.7% | -41.4% |
SEC Filings
Expand for More| Report Date | Filing Date | Filing |
|---|---|---|
| 06/30/2026 | 08/05/2026 | 10-Q |
| 03/31/2026 | 05/01/2026 | 10-Q |
| 12/31/2025 | 02/25/2026 | 10-K |
| 09/30/2025 | 11/05/2025 | 10-Q |
| 06/30/2025 | 08/06/2025 | 10-Q |
| 03/31/2025 | 05/02/2025 | 10-Q |
| 12/31/2024 | 02/26/2025 | 10-K |
| 09/30/2024 | 11/12/2024 | 10-Q |
| 06/30/2024 | 08/01/2024 | 10-Q |
| 03/31/2024 | 05/07/2024 | 10-Q |
| 12/31/2023 | 02/28/2024 | 10-K |
| 09/30/2023 | 11/02/2023 | 10-Q |
| 06/30/2023 | 08/03/2023 | 10-Q |
| 03/31/2023 | 05/05/2023 | 10-Q |
| 12/31/2022 | 02/24/2023 | 10-K |
| 09/30/2022 | 11/02/2022 | 10-Q |
| Report Date | Filing Date | Filing |
|---|---|---|
| 06/30/2026 | 08/05/2026 | 10-Q |
| 03/31/2026 | 05/01/2026 | 10-Q |
| 12/31/2025 | 02/25/2026 | 10-K |
| 09/30/2025 | 11/05/2025 | 10-Q |
| 06/30/2025 | 08/06/2025 | 10-Q |
| 03/31/2025 | 05/02/2025 | 10-Q |
| 12/31/2024 | 02/26/2025 | 10-K |
| 09/30/2024 | 11/12/2024 | 10-Q |
| 06/30/2024 | 08/01/2024 | 10-Q |
| 03/31/2024 | 05/07/2024 | 10-Q |
| 12/31/2023 | 02/28/2024 | 10-K |
| 09/30/2023 | 11/02/2023 | 10-Q |
| 06/30/2023 | 08/03/2023 | 10-Q |
| 03/31/2023 | 05/05/2023 | 10-Q |
| 12/31/2022 | 02/24/2023 | 10-K |
| 09/30/2022 | 11/02/2022 | 10-Q |
| 06/30/2022 | 08/04/2022 | 10-Q |
| 03/31/2022 | 05/11/2022 | 10-Q |
| 12/31/2021 | 02/25/2022 | 10-K |
| 09/30/2021 | 11/10/2021 | 10-Q |
| 06/30/2021 | 08/11/2021 | 10-Q |
| 03/31/2021 | 06/14/2021 | 424B4 |
Recent Forward Guidance
Updated 8/5/2026Latest: Q2 2026 Earnings Reported 8/4/2026
| Forward Guidance | Guidance Change | |||||||
|---|---|---|---|---|---|---|---|---|
| Metric | Source | Low | Mid | High | % Chg | % Delta | Change | Prior |
| Q3 2026 Revenue | Reported | 469.00 Mil | 470.50 Mil | 472.00 Mil | ||||
| Q3 2026 Adjusted EBITDA | Reported | 115.00 Mil | 115.50 Mil | 116.00 Mil | ||||
| 2026 Revenue | Reported | 1.81 Bil | 1.82 Bil | 1.82 Bil | 1.8% | Raised | Guidance: 1.79 Bil for 2026 | |
| 2026 Adjusted EBITDA | Reported | 404.10 Mil | 405.20 Mil | 406.30 Mil | 2.0% | Raised | Guidance: 397.30 Mil for 2026 | |
| 2026 GAAP EPS | Reported | 0.09 | 0.1 | 0.11 | ||||
| 2026 Free Cash Flow | Reported | 254.80 Mil | 255.30 Mil | 255.80 Mil | 8.6% | Raised | Guidance: 235.00 Mil for 2026 | |
Prior: Q1 2026 Earnings Reported 4/30/2026
| Forward Guidance | Guidance Change | |||||||
|---|---|---|---|---|---|---|---|---|
| Metric | Source | Low | Mid | High | % Chg | % Delta | Change | Prior |
| Q2 2026 Revenue | Reported | 419.00 Mil | 420.50 Mil | 422.00 Mil | Raised | |||
| Q2 2026 Adjusted EBITDA | Reported | 86.20 Mil | 86.55 Mil | 86.90 Mil | Raised | |||
| 2026 Revenue | Reported | 1.78 Bil | 1.79 Bil | 1.79 Bil | 1.7% | Raised | Guidance: 1.76 Bil for 2026 | |
| 2026 Adjusted EBITDA | Reported | 396.20 Mil | 397.30 Mil | 398.40 Mil | 1.6% | Raised | Guidance: 391.00 Mil for 2026 | |
| 2026 Free Cash Flow | Reported | 234.50 Mil | 235.00 Mil | 235.50 Mil | 1.6% | Raised | Guidance: 231.20 Mil for 2026 | |
Q4 2025 Earnings Reported 2/24/2026
| Forward Guidance | Guidance Change | |||||||
|---|---|---|---|---|---|---|---|---|
| Metric | Source | Low | Mid | High | % Chg | % Delta | Change | Prior |
| Q1 2026 Revenue | Reported | 369.00 Mil | 370.00 Mil | 371.00 Mil | Raised | Guidance: 364.50 Mil for Q4 2025 | ||
| Q1 2026 Adjusted EBITDA | Reported | 61.20 Mil | 61.50 Mil | 61.80 Mil | Raised | Guidance: 90.10 Mil for Q4 2025 | ||
| 2026 Revenue | Reported | 1.75 Bil | 1.76 Bil | 1.76 Bil | Raised | Guidance: 1.54 Bil for 2026 | ||
| 2026 Adjusted EBITDA | Reported | 389.90 Mil | 391.00 Mil | 392.10 Mil | Raised | Guidance: 354.00 Mil for 2026 | ||
| 2026 Free Cash Flow | Reported | 230.70 Mil | 231.20 Mil | 231.70 Mil | Raised | Guidance: 209.00 Mil for 2026 | ||
| 2028 Revenue | Reported | 2.30 Bil | ||||||
| 2028 Adjusted EBITDA | Reported | 573.00 Mil | ||||||
| 2028 Free Cash Flow | Reported | 371.00 Mil | ||||||
Q3 2025 Earnings Reported 11/4/2025
| Forward Guidance | Guidance Change | |||||||
|---|---|---|---|---|---|---|---|---|
| Metric | Source | Low | Mid | High | % Chg | % Delta | Change | Prior |
| Q4 2025 Revenue | Reported | 363.00 Mil | 364.50 Mil | 366.00 Mil | 11.1% | Higher New | Actual: 328.00 Mil for Q3 2025 | |
| Q4 2025 Adjusted EBITDA | Reported | 89.70 Mil | 90.10 Mil | 90.50 Mil | 27.5% | Higher New | Actual: 70.65 Mil for Q3 2025 | |
| Q4 2025 Free Cash Flow | Reported | 48.50 Mil | ||||||
| 2025 Revenue | Reported | 1.27 Bil | 1.27 Bil | 1.28 Bil | 0.9% | Raised | Guidance: 1.26 Bil for 2025 | |
| 2025 Adjusted EBITDA | Reported | 273.20 Mil | 273.65 Mil | 274.10 Mil | 3.4% | Raised | Guidance: 264.60 Mil for 2025 | |
| 2025 Free Cash Flow | Reported | 156.90 Mil | 157.40 Mil | 157.90 Mil | 10.8% | Raised | Guidance: 142.00 Mil for 2025 | |
| 2026 Revenue | Reported | 1.54 Bil | ||||||
| 2026 Adjusted EBITDA | Reported | 354.00 Mil | ||||||
| 2026 Free Cash Flow | Reported | 209.00 Mil | ||||||
Investor Activity (13F)
Updated Sep 27, 2026Active managers (13F portfolio over $250M, at least 3 holdings) with a position over $5M that is either over 10% of their portfolio or held in a concentrated book of 50 or fewer total positions. Index/ETF, sovereign, bank, community-bank and charitable/donor-advised filers are excluded.
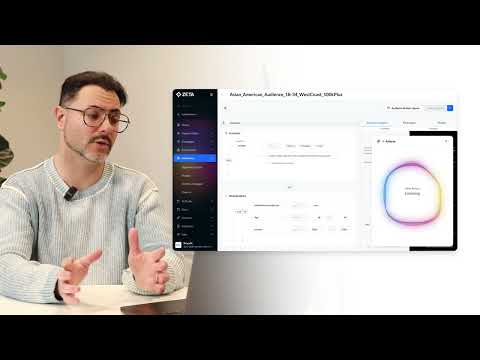
Zeta Global — Investor Video Playlist




Industry Resources
| Information Technology Resources |
| TechCrunch |
| Wired |
| CIO |
| MIT Technology Review |
| Gartner Insights |
| Ars Technica |
| Systems Software Resources |
| CNET |
| ZDNet |
| Gartner |
| Software Development Times |
External Quote Links
| Y Finance | Barrons |
| TradingView | Morningstar |
| SeekingAlpha | ValueLine |
| Motley Fool | Robinhood |
| CNBC | Etrade |
| MarketWatch | Unusual Whales |
| YCharts | Perplexity Finance |
| FinViz |
Prefer one of these to Trefis? Tell us why.