
Rayonier (RYN)
Market Price (11/13/2026): $21.31 | Market Cap: $6.3 BilSector: Real Estate | Industry: Timber REITs
Rayonier (RYN)
Market Price (11/13/2026): $21.31Market Cap: $6.3 BilSector: Real EstateIndustry: Timber REITs
Investment Highlights Why It Matters Detailed financial logic regarding cash flow yields vs trend-riding momentum.
Attractive yieldTotal YieldTotal Yield = Earnings Yield + Dividend Yield, Earnings Yield = Net Income / Market Cap Dividend Yield = Total Dividends / Market Cap is 7.8%, Dividend Yield is 5.3% Strong revenue growthRev Chg LTMRevenue Change % Last Twelve Months (LTM) is 33% Attractive cash flow generationCFO/Rev LTMCash Flow from Operations / Revenue (Sales), Last Twelve Months (LTM) is 22%, FCF/Rev LTMFree Cash Flow / Revenue (Sales), Last Twelve Months (LTM) is 16% Valuation becoming less expensiveP/S 6M Chg %Price/Sales change over 6 months. Declining P/S indicates valuation has become less expensive. is -29% Low stock price volatilityVol 12M is 27% Megatrend and thematic driversMegatrends include Sustainable Resource Management, and Sustainable Consumption. Themes include Green Building Materials, Resource Efficiency Solutions, Show more. | Weak multi-year price returns2Y Excs Rtn is -49%, 3Y Excs Rtn is -85% | Expensive valuation multiplesP/EBITPrice/EBIT or Price/(Operating Income) ratio is 35x Key risksRYN key risks include [1] unpredictable and lumpy real estate sales resulting from a lengthy, Show more. |
| Attractive yieldTotal YieldTotal Yield = Earnings Yield + Dividend Yield, Earnings Yield = Net Income / Market Cap Dividend Yield = Total Dividends / Market Cap is 7.8%, Dividend Yield is 5.3% |
| Strong revenue growthRev Chg LTMRevenue Change % Last Twelve Months (LTM) is 33% |
| Attractive cash flow generationCFO/Rev LTMCash Flow from Operations / Revenue (Sales), Last Twelve Months (LTM) is 22%, FCF/Rev LTMFree Cash Flow / Revenue (Sales), Last Twelve Months (LTM) is 16% |
| Valuation becoming less expensiveP/S 6M Chg %Price/Sales change over 6 months. Declining P/S indicates valuation has become less expensive. is -29% |
| Low stock price volatilityVol 12M is 27% |
| Megatrend and thematic driversMegatrends include Sustainable Resource Management, and Sustainable Consumption. Themes include Green Building Materials, Resource Efficiency Solutions, Show more. |
| Weak multi-year price returns2Y Excs Rtn is -49%, 3Y Excs Rtn is -85% |
| Expensive valuation multiplesP/EBITPrice/EBIT or Price/(Operating Income) ratio is 35x |
| Key risksRYN key risks include [1] unpredictable and lumpy real estate sales resulting from a lengthy, Show more. |
Qualitative Assessment
AI Analysis | Feedback
Nov 5: up 8.6% the day after its Nov 4 earnings report (S&P 500 down 4.4%)
The stock rose after Rayonier reported third quarter earnings and revenue that topped estimates. The company also announced a $300 million increase in its share repurchase authorization.
Up 21.8% from its Oct 7 low to Nov 5 (S&P 500 down 5.7%)
The run occurred largely without company news, with its biggest days on October 8 and November 2. The upward trend concluded on November 5 following the company's third quarter results and increased share repurchase authorization.
Nov 5: up 8.6% the day after its Nov 4 earnings report (S&P 500 down 4.4%)
The stock rose after Rayonier reported third quarter earnings and revenue that topped estimates. The company also announced a $300 million increase in its share repurchase authorization.
Up 21.8% from its Oct 7 low to Nov 5 (S&P 500 down 5.7%)
The run occurred largely without company news, with its biggest days on October 8 and November 2. The upward trend concluded on November 5 following the company's third quarter results and increased share repurchase authorization.
Show less
Stock Movement Drivers
Fundamental Drivers
The -0.9% change in RYN stock from 7/31/2026 to 11/12/2026 was primarily driven by a -83.2% change in the company's Net Income Margin (%).| (LTM values as of) | 7312026 | 11122026 | Change |
|---|---|---|---|
| Stock Price ($) | 21.50 | 21.31 | -0.9% |
| Change Contribution By: | |||
| Total Revenues ($ Mil) | 678 | 1,356 | 99.9% |
| Net Income Margin (%) | 68.6% | 11.5% | -83.2% |
| P/E Multiple | 11.8 | 40.7 | 244.1% |
| Shares Outstanding (Mil) | 256 | 298 | -14.0% |
| Cumulative Contribution | -0.9% |
Market Drivers
7/31/2026 to 11/12/2026| Return | Correlation | |
|---|---|---|
| RYN | -0.9% | |
| Market (SPY) | 1.4% | -25.0% |
| Sector (XLRE) | -1.6% | 36.0% |
Fundamental Drivers
The 3.0% change in RYN stock from 4/30/2026 to 11/12/2026 was primarily driven by a 500.1% change in the company's P/E Multiple.| (LTM values as of) | 4302026 | 11122026 | Change |
|---|---|---|---|
| Stock Price ($) | 20.69 | 21.31 | 3.0% |
| Change Contribution By: | |||
| Total Revenues ($ Mil) | 484 | 1,356 | 180.0% |
| Net Income Margin (%) | 97.9% | 11.5% | -88.3% |
| P/E Multiple | 6.8 | 40.7 | 500.1% |
| Shares Outstanding (Mil) | 156 | 298 | -47.8% |
| Cumulative Contribution | 3.0% |
Market Drivers
4/30/2026 to 11/12/2026| Return | Correlation | |
|---|---|---|
| RYN | 3.0% | |
| Market (SPY) | 5.6% | -9.4% |
| Sector (XLRE) | 0.8% | 46.2% |
Fundamental Drivers
The 1.6% change in RYN stock from 10/31/2025 to 11/12/2026 was primarily driven by a 849.3% change in the company's P/E Multiple.| (LTM values as of) | 10312025 | 11122026 | Change |
|---|---|---|---|
| Stock Price ($) | 20.98 | 21.31 | 1.6% |
| Change Contribution By: | |||
| Total Revenues ($ Mil) | 964 | 1,356 | 40.7% |
| Net Income Margin (%) | 79.0% | 11.5% | -85.4% |
| P/E Multiple | 4.3 | 40.7 | 849.3% |
| Shares Outstanding (Mil) | 156 | 298 | -47.8% |
| Cumulative Contribution | 1.6% |
Market Drivers
10/31/2025 to 11/12/2026| Return | Correlation | |
|---|---|---|
| RYN | 1.6% | |
| Market (SPY) | 11.9% | -0.4% |
| Sector (XLRE) | 11.4% | 45.3% |
Fundamental Drivers
The 2.8% change in RYN stock from 10/31/2023 to 11/12/2026 was primarily driven by a 63.7% change in the company's Total Revenues ($ Mil).| (LTM values as of) | 10312023 | 11122026 | Change |
|---|---|---|---|
| Stock Price ($) | 20.74 | 21.31 | 2.8% |
| Change Contribution By: | |||
| Total Revenues ($ Mil) | 829 | 1,356 | 63.7% |
| Net Income Margin (%) | 9.8% | 11.5% | 17.6% |
| P/E Multiple | 38.0 | 40.7 | 7.2% |
| Shares Outstanding (Mil) | 148 | 298 | -50.2% |
| Cumulative Contribution | 2.8% |
Market Drivers
10/31/2023 to 11/12/2026| Return | Correlation | |
|---|---|---|
| RYN | 2.8% | |
| Market (SPY) | 87.3% | 25.4% |
| Sector (XLRE) | 47.3% | 56.1% |
Price Returns Compared
| 2021 | 2022 | 2023 | 2024 | 2025 | 2026 | Total [1] | |
|---|---|---|---|---|---|---|---|
| Returns | |||||||
| RYN Return | 42% | -16% | 6% | -18% | -9% | 2% | -4% |
| Peers Return | 53% | -14% | 51% | -7% | -24% | -5% | 33% |
| S&P 500 Return | 27% | -19% | 24% | 23% | 16% | 11% | 103% |
Monthly Win Rates [3] | |||||||
| RYN Win Rate | 67% | 50% | 42% | 50% | 58% | 55% | |
| Peers Win Rate | 58% | 44% | 50% | 52% | 35% | 43% | |
| S&P 500 Win Rate | 75% | 42% | 67% | 75% | 67% | 45% | |
Max Drawdowns [4] | |||||||
| RYN Max Drawdown | -11% | -33% | -31% | -23% | -21% | -24% | |
| Peers Max Drawdown | -25% | -32% | -23% | -21% | -35% | -29% | |
| S&P 500 Max Drawdown | -5% | -25% | -10% | -8% | -19% | -9% | |
[1] Cumulative total returns since the beginning of 2021
[2] Peers: WY, BCC, WFG, UFPI.
[3] Win Rate = % of calendar months in which monthly returns were positive
[4] Max drawdown represents maximum peak-to-trough decline within a year
[5] 2026 data is for the year up to 11/12/2026 (YTD)
How Low Can It Go
| Event | RYN | S&P 500 |
|---|---|---|
| 2025 US Tariff Shock | ||
| % Loss | -10.1% | -18.8% |
| % Gain to Breakeven | 11.2% | 23.1% |
| Time to Breakeven | 93 days | 79 days |
| Summer-Fall 2023 Five Percent Yield Shock | ||
| % Loss | -22.7% | -9.5% |
| % Gain to Breakeven | 29.3% | 10.5% |
| Time to Breakeven | 49 days | 24 days |
| 2023 SVB Regional Banking Crisis | ||
| % Loss | -18.7% | -6.7% |
| % Gain to Breakeven | 23.0% | 7.1% |
| Time to Breakeven | 251 days | 31 days |
| 2020 COVID-19 Crash | ||
| % Loss | -35.8% | -33.7% |
| % Gain to Breakeven | 55.7% | 50.9% |
| Time to Breakeven | 137 days | 140 days |
| Q4 2018 Fed Policy Error / Growth Scare | ||
| % Loss | -15.2% | -19.2% |
| % Gain to Breakeven | 17.9% | 23.8% |
| Time to Breakeven | 94 days | 105 days |
| 2015-2016 China Devaluation / Global Growth Scare | ||
| % Loss | -21.2% | -12.2% |
| % Gain to Breakeven | 26.9% | 13.9% |
| Time to Breakeven | 61 days | 62 days |
In The Past
Rayonier's stock fell -10.1% during the 2025 US Tariff Shock. Such a loss loss requires a 11.2% gain to breakeven.
Preserve Wealth
Limiting losses and compounding gains is essential to preserving wealth.
Asset Allocation
Actively managed asset allocation strategies protect wealth. Learn more.
| Event | RYN | S&P 500 |
|---|---|---|
| Summer-Fall 2023 Five Percent Yield Shock | ||
| % Loss | -22.7% | -9.5% |
| % Gain to Breakeven | 29.3% | 10.5% |
| Time to Breakeven | 49 days | 24 days |
| 2020 COVID-19 Crash | ||
| % Loss | -35.8% | -33.7% |
| % Gain to Breakeven | 55.7% | 50.9% |
| Time to Breakeven | 137 days | 140 days |
| 2015-2016 China Devaluation / Global Growth Scare | ||
| % Loss | -21.2% | -12.2% |
| % Gain to Breakeven | 26.9% | 13.9% |
| Time to Breakeven | 61 days | 62 days |
| 2014-2016 Oil Price Collapse | ||
| % Loss | -42.3% | -6.8% |
| % Gain to Breakeven | 73.2% | 7.3% |
| Time to Breakeven | 652 days | 15 days |
| 2013 Taper Tantrum | ||
| % Loss | -27.6% | -0.2% |
| % Gain to Breakeven | 38.1% | 0.2% |
| Time to Breakeven | 1518 days | 1 days |
| 2008-2009 Global Financial Crisis | ||
| % Loss | -48.7% | -53.4% |
| % Gain to Breakeven | 95.1% | 114.4% |
| Time to Breakeven | 191 days | 1085 days |
| Summer 2007 Credit Crunch | ||
| % Loss | -20.3% | -8.6% |
| % Gain to Breakeven | 25.4% | 9.5% |
| Time to Breakeven | 43 days | 47 days |
In The Past
Rayonier's stock fell -10.1% during the 2025 US Tariff Shock. Such a loss loss requires a 11.2% gain to breakeven.
Preserve Wealth
Limiting losses and compounding gains is essential to preserving wealth.
Asset Allocation
Actively managed asset allocation strategies protect wealth. Learn more.
About Rayonier (RYN)
Rayonier (RYN) operates as a leading timberland real estate investment trust (REIT), primarily engaged in the ownership and management of large, productive forestlands. The company's core business is centered around growing and harvesting softwood timber from its extensive land holdings, which are strategically located to serve key markets.
As of December 2020, Rayonier's impressive portfolio included approximately 2.7 million acres of timberlands. These assets are diversified across the U.S. South, the U.S. Pacific Northwest, and New Zealand, providing exposure to varied timber markets and growing conditions. In addition to its directly owned or leased timberlands, Rayonier also acts as a managing member for private equity timber funds, expanding its overall timberland management footprint.
The company's main product is raw timber, which it supplies to industrial customers such as sawmills, pulp mills, and panel mills. These customers process the timber into a wide array of products including lumber for construction, pulp for paper and packaging, and various engineered wood products. By providing these essential raw materials, Rayonier serves critical segments of the global construction, manufacturing, and consumer goods industries.
AI Analysis | Feedback
Here are 1-3 brief analogies to describe Rayonier (RYN):
- Think of Rayonier as the McDonald's for forests, owning vast tracts of timberland instead of prime restaurant locations.
- It's like Realty Income (O) for timberland, operating as a real estate investment trust but focused on managing and deriving income from forests.
AI Analysis | Feedback
- Timber Harvesting & Sales: Rayonier grows and sells softwood timber harvested from its extensive timberland holdings in the U.S. and New Zealand.
- Timberland Real Estate Sales: The company sells timberland properties, often for higher and better use, to maximize value from its real estate portfolio.
- Timberland Investment Management: Rayonier acts as the managing member for private equity timber funds, providing management services for timberland investments.
AI Analysis | Feedback
Rayonier (RYN) sells primarily to other companies, not individuals. Due to the nature of the timberland industry and the diversification of buyers, Rayonier does not typically disclose a few major customer companies by name. Instead, its customer base consists of a broad array of businesses that process or utilize timber and land.
The primary categories of customers Rayonier serves include:
- Forest Products Mills: This broad category includes sawmills that convert logs into lumber, pulp and paper mills that process wood fiber into pulp and paper products, and manufacturers of panel products such as plywood, oriented strand board (OSB), and medium-density fiberboard (MDF).
- Wood Biomass and Energy Facilities: These facilities purchase lower-grade timber and wood residuals for energy production.
- Real Estate Developers and Investors: These customers acquire Rayonier's land, particularly parcels identified for "higher and better use" (HBU) development, conservation, or other investment purposes.
AI Analysis | Feedback
AI Analysis | Feedback
Mark D. McHugh, President and Chief Executive Officer
Mark D. McHugh was appointed President and Chief Executive Officer on April 1, 2024. He previously served as President and Chief Financial Officer from January 2023, and as Senior Vice President and Chief Financial Officer since joining Rayonier in December 2014. McHugh has over 20 years of experience in finance and capital markets, primarily focused on the forest products and REIT sectors. Before joining Rayonier, he was a Managing Director in Raymond James' Real Estate Investment Banking group, where he was responsible for the firm's timberland and agriculture sector coverage. He also worked in the Investment Banking Division of Credit Suisse from 2000 to 2008, focusing on the paper and forest products sectors. McHugh advised Rayonier on its conversion from a C-corp to a REIT in 2003 as an investment banker. His background is in finance and investment banking, with no explicit pattern of managing companies backed by private equity firms mentioned in the available information.
Wayne Wasechek, Executive Vice President and Chief Financial Officer
Wayne Wasechek assumed the role of Executive Vice President and Chief Financial Officer of the combined company following the merger with PotlatchDeltic Corporation, effective January 30, 2026. Further detailed background information regarding his prior roles, company involvements, or any pattern of managing private equity-backed companies was not immediately available in the search results.
Doug Long, Executive Vice President and Chief Resource Officer
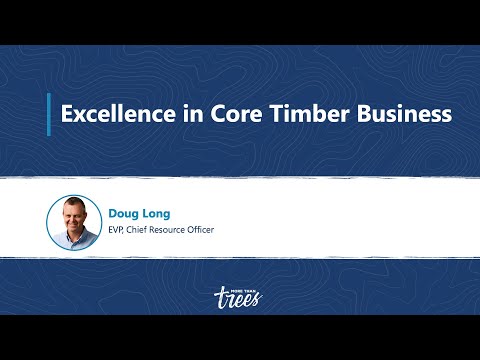
Doug Long was appointed Executive Vice President and Chief Resource Officer in January 2023, having previously served as Senior Vice President, Forest Resources since December 2015. He oversees Rayonier's global forestry operations as well as emerging business opportunities associated with Land-Based Solutions. Long joined Rayonier in 1995 and has held multiple positions of increasing responsibility within the forestry division.
Christopher T. Corr, Senior Vice President, Real Estate Development
Christopher T. Corr serves as Senior Vice President of Real Estate Development at Rayonier and is also the President of Raydient LLC, a subsidiary focused on real estate development. He joined Rayonier in 2013 as Senior Vice President of Real Estate and Public Affairs. Corr is a veteran real estate executive with over 25 years of experience, including leading more than 50 master-planned residential, commercial, and infrastructure projects. Prior to Rayonier, he held executive positions at AECOM, The St. Joe Company, and The Walt Disney Company. He also has experience as a former legislator and commissioner.
Mark R. Bridwell, Executive Vice President, General Counsel & Corporate Secretary
Mark R. Bridwell is the Executive Vice President, General Counsel & Corporate Secretary of the combined company following the merger, as of January 30, 2026.
AI Analysis | Feedback
Key Risks to Rayonier's Business
The primary risks to Rayonier's (RYN) business largely stem from the inherent characteristics of the timberland industry and broader environmental and economic factors.
- Market Cyclicality and Pricing Volatility: As a leading timberland real estate investment trust, Rayonier's core business is significantly impacted by the cyclical nature of the timber market. Fluctuations in timber prices and demand, particularly influenced by the housing market, can substantially affect the company's revenue and profitability. Recent periods have seen challenges in the Southern timber business with pricing headwinds and decreased harvest volumes.
- Environmental Regulations and Climate Risks: Rayonier's extensive timberland holdings are directly exposed to environmental and climate-related risks. Changes in environmental policies and regulations can lead to increased compliance costs or restrictions on timber harvesting and land development activities. Moreover, physical risks from climate change, such as more frequent and severe wildfires, storms, droughts, and pest infestations, pose direct threats to the health, productivity, and value of the company's timber assets.
- Operating Cost Pressures and Inflation: The company faces ongoing pressure on its operating income due to rising costs and expenses. Increases in the cost of labor, energy, and fuel, as well as broader inflationary pressures, can lead to compressed margins and impact harvest levels. Managing these fluctuating costs, which represent significant components of operating expenses, is crucial for maintaining profitability.
AI Analysis | Feedback
Accelerating and unpredictable climate change impacts (e.g., increased frequency and severity of wildfires, droughts, insect infestations, and extreme weather events) that disrupt timberland productivity, increase operational risks, and potentially reduce the long-term value and viability of timberland assets in key operating regions.
AI Analysis | Feedback
Rayonier's primary product is timber, derived from its extensive timberland holdings. The addressable markets for its main products are defined by the timber and wood product industries in the regions where it operates: the United States and New Zealand.
For the United States, the addressable market for Rayonier's timber products can be broadly represented by the U.S. sawmill & wood market. This market was valued at approximately USD 51.2 billion in 2024. It is projected to grow to USD 59.7 billion by 2032. This market encompasses the demand for lumber and other wood products that originate from raw timber.
In New Zealand, the addressable market for Rayonier's timber can be gauged by the country's forestry product exports. For the year ended December 2025, total exports of forestry products from New Zealand amounted to $6.28 billion NZD. A significant portion of this, 54%, or approximately $3.4 billion NZD, was derived from logs and poles.
AI Analysis | Feedback
Rayonier (RYN) is poised for future revenue growth over the next 2-3 years, driven by several strategic initiatives and anticipated market improvements. These key drivers include the realization of synergies from its recent merger, continued strong performance and expansion in its real estate segment, the growth of its land-based solutions, and an expected uptick in timber market pricing and demand.
Firstly, the completion of the merger with PotlatchDeltic on January 30, 2026, is a significant driver. This merger has created a combined timberland portfolio exceeding 4 million acres and expanded wood products operations. Rayonier anticipates approximately $40 million in annual run-rate synergies from this integration, which will directly contribute to financial performance and revenue growth.
Secondly, the company's Real Estate segment is expected to be a robust contributor to future revenue. This segment delivered record adjusted EBITDA in 2025 and is projected to achieve between $180 million and $200 million of EBITDA in 2026. Growth will be fueled by strong rural Highest and Best Use (HBU) markets and the ongoing expansion of real estate development businesses, such as Wildlight and Heartwood. Rayonier's strategy involves optimizing land use for higher-value purposes, with sales often achieving premiums of 50% to over 100% above timberland value.
Thirdly, Rayonier is advancing its "Land-Based Solutions" business, which represents a new and growing revenue stream. This includes significant efforts in solar development, with approximately 80,000 acres under option for solar projects, and carbon capture and storage, with over 154,000 acres leased for such opportunities. The monetization of carbon stored in standing timber inventory through carbon offset markets also presents a growth avenue, positioning the company to generate higher-margin revenue streams from environmental services.
Finally, a modest price uptick in the Southern timber market is anticipated in 2026, following a challenging 2025. Improved supply and demand dynamics, coupled with strong domestic demand for sawtimber and expected increases in softwood lumber duties on Canadian imports, are projected to enhance U.S. lumber production and timber pricing. Rayonier's Pacific Northwest timber operations also benefit from lumber-indexed pricing, further connecting revenue growth to a recovering lumber market.
AI Analysis | Feedback
Share Repurchases
- Rayonier approved a new $300 million share repurchase authorization on December 2, 2024, replacing an existing $100 million authorization.
- During Q2 2025, the company repurchased approximately $35 million of shares.
- Approximately $230 million remained authorized for future share repurchases as of year-end 2025.
Share Issuance
- Rayonier issued common shares as part of a one-time special dividend of $1.80 per common share declared in December 2024 and paid in January 2025, with the cash component limited to 25% and the remainder in common shares.
- During the fourth quarter of 2024, the company issued 23,203 common shares in exchange for units in the Operating Partnership.
- As part of the merger with PotlatchDeltic, announced in October 2025, PotlatchDeltic shareholders were to receive 1.7339 common shares of Rayonier for each of their shares.
Outbound Investments
- In November 2022, Rayonier acquired approximately 172,400 acres of timberlands in the U.S. South from Manulife Investment Management for about $474 million.
- On October 14, 2025, Rayonier announced an all-stock merger of equals with PotlatchDeltic Corporation, valued at $4.44 billion, which closed on January 30, 2026.
Capital Expenditures
- Rayonier revised its 2025 capital expenditures guidance downward from $72-77 million to $52-56 million.
- Lower capital expenditures contributed to increased cash available for distribution during Q2 2025 and for the full year 2025.
- Year-to-date Q3 2025, capital expenditures were $5.2 million lower than the prior year period.
Peer Outperformance in Timber REITs
null| Industry | Names | 1Y med | 3Y med | 5Y med | Top 3 by 5Y |
|---|---|---|---|---|---|
| Health Care REITs | 15 | 14.0% | 66.3% | 76.3% | WELL 224% · OHI 141% · CTRE 134% |
| Retail REITs | 23 | 15.5% | 43.4% | 35.3% | SKT 142% · SPG 85% · BRX 55% |
| Hotel & Resort REITs | 16 | 51.9% | 53.4% | 15.1% | HST 83% · RHP 77% · APLE 67% |
| Other Specialized REITs | 11 | 2.5% | 25.8% | 13.0% | IRM 191% · LAMR 75% · OUT 67% |
| Real Estate Development | 6 | -10.1% | 24.8% | 5.2% | JOE 39% |
| Industrial REITs | 11 | 12.4% | 37.6% | 0.1% | EGP 14% · STAG 6% · FR 5% |
| Single-Family Residential REITs | 4 | -3.6% | 3.0% | -19.1% | AMH -7% · ELS -16% · INVH -22% |
| Multi-Family Residential REITs | 12 | -6.4% | 21.3% | -29.0% | ESS -6% · VMRK -10% · UDR -21% |
| Diversified REITs | 12 | -0.7% | 14.6% | -29.7% | EPRT 19% · WPC 13% |
| Office REITs | 19 | -0.5% | 48.4% | -33.2% | CDP 45% · CUZ -6% · HIW -8% |
| Telecom Tower REITs | 3 | 0.7% | 10.3% | -36.4% | AMT -18% · CCI -36% · SBAC -41% |
| Real Estate Services | 28 | -22.7% | -14.7% | -38.1% | JLL 38% · CBRE 26% · COMP -12% |
Latest Trefis Analyses
| Title | |
|---|---|
| ARTICLES |
Research & Analysis
Invest in Strategies
Wealth Management
Peer Comparisons
| Peers to compare with: |
Financials
| Median | |
|---|---|
| Name | |
| Mkt Price | 65.82 |
| Mkt Cap | 5.2 |
| Rev LTM | 6,407 |
| Op Inc LTM | 247 |
| FCF LTM | 133 |
| FCF 3Y Avg | 109 |
| CFO LTM | 304 |
| CFO 3Y Avg | 335 |
Growth & Margins
| Median | |
|---|---|
| Name | |
| Rev Chg LTM | -0.7% |
| Rev Chg 3Y Avg | -3.2% |
| Rev Chg Q | 8.4% |
| QoQ Delta Rev Chg LTM | 2.1% |
| Op Inc Chg LTM | -29.4% |
| Op Inc Chg 3Y Avg | -26.8% |
| Op Mgn LTM | 4.5% |
| Op Mgn 3Y Avg | 6.2% |
| QoQ Delta Op Mgn LTM | 0.4% |
| CFO/Rev LTM | 5.9% |
| CFO/Rev 3Y Avg | 8.5% |
| FCF/Rev LTM | 2.0% |
| FCF/Rev 3Y Avg | 1.6% |
Valuation
| Median | |
|---|---|
| Name | |
| Mkt Cap | 5.2 |
| P/S | 1.0 |
| P/Op Inc | 14.4 |
| P/EBIT | 12.8 |
| P/E | 19.7 |
| P/CFO | 11.0 |
| Total Yield | 7.2% |
| Dividend Yield | 1.9% |
| FCF Yield 3Y Avg | 2.5% |
| D/E | 0.2 |
| Net D/E | 0.1 |
Segment Financials
Revenue by Segment| $ Mil | 2025 | 2024 | 2023 | 2022 | 2021 |
|---|---|---|---|---|---|
| Southern Timber | 228 | 252 | 265 | 264 | 204 |
| Real Estate | 173 | 628 | 390 | 138 | 190 |
| Northwest Timber | 84 | 108 | 133 | 162 | 143 |
| Corporate and other | -0 | ||||
| New Zealand Timber | 274 | 281 | |||
| Trading | 71 | 95 | |||
| Intersegment revenue | -4 | ||||
| Timber Funds | 199 | ||||
| Total | 484 | 988 | 788 | 909 | 1,110 |
| $ Mil | 2025 | 2024 | 2023 | 2022 | 2021 |
|---|---|---|---|---|---|
| Real Estate | 62 | 335 | 157 | 58 | 113 |
| Southern Timber | 61 | 78 | 76 | 97 | 66 |
| Northwest Timber | 2 | -6 | -9 | 15 | 7 |
| Corporate and other | -35 | -31 | |||
| New Zealand Timber | 31 | 52 | |||
| Trading | 0 | 0 | |||
| Timber Funds | 63 | ||||
| Total | 125 | 407 | 224 | 166 | 270 |
| $ Mil | 2013 | 2012 | 2011 | 2010 | 2009 |
|---|---|---|---|---|---|
| Forest Resources | 2,163 | 1,690 | 1,604 | ||
| Performance Fibers | 1,079 | 902 | 646 | 551 | 518 |
| Corporate and other | 258 | ||||
| Real Estate | 149 | 113 | 103 | 86 | 71 |
| Other Operations | 37 | 23 | 25 | 26 | 19 |
| Intersegment revenue | 377 | 170 | 421 | 363 | |
| Wood Products | 18 | 21 | 20 | 22 | |
| Timber | 1,260 | 1,260 | |||
| Total | 3,686 | 3,123 | 2,569 | 2,364 | 2,253 |
Price Behavior
| Market Price | $21.31 | |
| Market Cap ($ Bil) | 6.3 | |
| First Trading Date | 02/17/1994 | |
| Distance from 52W High | -10.2% | |
| 50 Days | 200 Days | |
| DMA Price | $19.51 | $20.45 |
| DMA Trend | down | down |
| Distance from DMA | 9.2% | 4.2% |
| 3M | 1YR | |
| Volatility | 30.6% | 26.9% |
| Downside Capture | -14.95 | 37.33 |
| Upside Capture | -10.32 | 34.05 |
| Correlation (S&P 500) | -31.8% | 1.1% |
| 1M | 2M | 3M | 6M | 1Y | 3Y | |
|---|---|---|---|---|---|---|
| Beta | -0.39 | -0.29 | 0.08 | 0.18 | 0.19 | 0.50 |
| Up Beta | 1.73 | 0.41 | 0.37 | -0.36 | -0.15 | 0.48 |
| Down Beta | -0.32 | -0.75 | -0.73 | 0.02 | 0.14 | 0.48 |
| Up Capture | -6% | -38% | -4% | 26% | 17% | 16% |
| Bmk +ve Days | 12 | 18 | 28 | 62 | 130 | 427 |
| Stock +ve Days | 11 | 19 | 28 | 67 | 127 | 370 |
| Down Capture | -90% | -3% | 59% | 54% | 50% | 81% |
| Bmk -ve Days | 10 | 25 | 36 | 64 | 121 | 325 |
| Stock -ve Days | 11 | 24 | 36 | 59 | 123 | 374 |
[1] Upside and downside betas calculated using positive and negative benchmark daily returns respectively
Based On 1-Year Data
| Annualized Return | Annualized Volatility | Sharpe Ratio | Correlation with RYN | |
|---|---|---|---|---|
| RYN | 0.2% | 26.9% | -0.03 | - |
| Sector ETF (XLRE) | 9.3% | 14.6% | 0.37 | 45.7% |
| Equity (SPY) | 11.8% | 13.7% | 0.55 | 0.9% |
| Gold (GLD) | -6.6% | 28.9% | -0.24 | 10.8% |
| Commodities (DBC) | 32.8% | 21.3% | 1.22 | -14.3% |
| Real Estate (VNQ) | 9.8% | 14.2% | 0.41 | 46.5% |
| Bitcoin (BTCUSD) | -28.5% | 43.4% | -0.66 | 2.7% |
Smart multi-asset allocation framework can stack odds in your favor. Learn How
Based On 5-Year Data
| Annualized Return | Annualized Volatility | Sharpe Ratio | Correlation with RYN | |
|---|---|---|---|---|
| RYN | -6.8% | 26.1% | -0.29 | - |
| Sector ETF (XLRE) | 1.6% | 19.2% | -0.02 | 61.5% |
| Equity (SPY) | 11.6% | 17.3% | 0.50 | 43.3% |
| Gold (GLD) | 16.2% | 19.2% | 0.68 | 15.1% |
| Commodities (DBC) | 8.2% | 19.6% | 0.30 | 10.0% |
| Real Estate (VNQ) | 1.4% | 18.9% | -0.04 | 63.3% |
| Bitcoin (BTCUSD) | 3.7% | 51.5% | 0.25 | 16.3% |
Smart multi-asset allocation framework can stack odds in your favor. Learn How
Based On 10-Year Data
| Annualized Return | Annualized Volatility | Sharpe Ratio | Correlation with RYN | |
|---|---|---|---|---|
| RYN | 2.4% | 28.9% | 0.13 | - |
| Sector ETF (XLRE) | 7.6% | 20.4% | 0.32 | 63.9% |
| Equity (SPY) | 15.5% | 18.0% | 0.73 | 55.8% |
| Gold (GLD) | 11.1% | 16.6% | 0.54 | 9.3% |
| Commodities (DBC) | 7.6% | 18.1% | 0.33 | 19.5% |
| Real Estate (VNQ) | 6.2% | 20.7% | 0.25 | 66.6% |
| Bitcoin (BTCUSD) | 58.4% | 66.3% | 0.98 | 16.7% |
Smart multi-asset allocation framework can stack odds in your favor. Learn How
Earnings Returns History
Updated 11/13/2026| Forward Returns | |||
|---|---|---|---|
| Earnings Date | 1D Returns | 5D Returns | 21D Returns |
| 11/4/2026 | 8.6% | 6.8% | |
| 8/5/2026 | -2.7% | -2.3% | -7.7% |
| 5/6/2026 | -3.7% | -5.5% | -1.0% |
| 2/11/2026 | 0.6% | 0.8% | -9.7% |
| 11/5/2025 | 1.6% | 0.3% | -1.0% |
| 8/6/2025 | 8.3% | 12.3% | 12.2% |
| 4/30/2025 | -3.6% | -4.0% | -3.1% |
| 2/5/2025 | 2.4% | -1.6% | 6.1% |
| ... | |||
| SUMMARY STATS | |||
| # Positive | 14 | 10 | 10 |
| # Negative | 10 | 14 | 13 |
| Median Positive | 1.8% | 6.1% | 9.1% |
| Median Negative | -3.4% | -2.4% | -3.9% |
| Max Positive | 13.6% | 13.4% | 25.0% |
| Max Negative | -6.7% | -13.7% | -9.7% |
| Forward Returns | |||
|---|---|---|---|
| Earnings Date | 1D Returns | 5D Returns | 21D Returns |
| 11/4/2026 | 8.6% | 6.8% | |
| 8/5/2026 | -2.7% | -2.3% | -7.7% |
| 5/6/2026 | -3.7% | -5.5% | -1.0% |
| 2/11/2026 | 0.6% | 0.8% | -9.7% |
| 11/5/2025 | 1.6% | 0.3% | -1.0% |
| 8/6/2025 | 8.3% | 12.3% | 12.2% |
| 4/30/2025 | -3.6% | -4.0% | -3.1% |
| 2/5/2025 | 2.4% | -1.6% | 6.1% |
| 11/6/2024 | 0.5% | -4.3% | -0.0% |
| 8/7/2024 | -4.1% | -5.2% | 0.5% |
| 5/1/2024 | -1.2% | -0.5% | 0.8% |
| 1/31/2024 | 6.8% | 8.5% | 13.9% |
| 11/1/2023 | 13.6% | 13.4% | 25.0% |
| 8/2/2023 | 0.9% | -0.8% | -7.2% |
| 5/3/2023 | -3.3% | -1.7% | -3.1% |
| 2/1/2023 | 1.0% | -3.6% | -8.3% |
| 11/2/2022 | -1.0% | 5.8% | 11.8% |
| 8/3/2022 | -4.1% | -2.1% | -5.8% |
| 5/4/2022 | -6.7% | -13.7% | -3.9% |
| 2/2/2022 | 2.1% | 6.5% | 11.0% |
| 11/3/2021 | -0.3% | -2.5% | -4.0% |
| 8/4/2021 | 4.0% | 5.3% | 7.1% |
| 5/5/2021 | 0.8% | -0.7% | -0.3% |
| 2/3/2021 | 0.0% | 4.3% | 0.5% |
| SUMMARY STATS | |||
| # Positive | 14 | 10 | 10 |
| # Negative | 10 | 14 | 13 |
| Median Positive | 1.8% | 6.1% | 9.1% |
| Median Negative | -3.4% | -2.4% | -3.9% |
| Max Positive | 13.6% | 13.4% | 25.0% |
| Max Negative | -6.7% | -13.7% | -9.7% |
SEC Filings
Expand for More| Report Date | Filing Date | Filing |
|---|---|---|
| 09/30/2026 | 11/06/2026 | 10-Q |
| 06/30/2026 | 08/07/2026 | 10-Q |
| 03/31/2026 | 05/08/2026 | 10-Q |
| 12/31/2025 | 02/23/2026 | 10-K |
| 09/30/2025 | 11/07/2025 | 10-Q |
| 06/30/2025 | 08/08/2025 | 10-Q |
| 03/31/2025 | 05/02/2025 | 10-Q |
| 12/31/2024 | 02/21/2025 | 10-K |
| 09/30/2024 | 11/08/2024 | 10-Q |
| 06/30/2024 | 08/08/2024 | 10-Q |
| 03/31/2024 | 05/03/2024 | 10-Q |
| 12/31/2023 | 02/23/2024 | 10-K |
| 09/30/2023 | 11/03/2023 | 10-Q |
| 06/30/2023 | 08/04/2023 | 10-Q |
| 03/31/2023 | 05/05/2023 | 10-Q |
| 12/31/2022 | 02/24/2023 | 10-K |
| Report Date | Filing Date | Filing |
|---|---|---|
| 09/30/2026 | 11/06/2026 | 10-Q |
| 06/30/2026 | 08/07/2026 | 10-Q |
| 03/31/2026 | 05/08/2026 | 10-Q |
| 12/31/2025 | 02/23/2026 | 10-K |
| 09/30/2025 | 11/07/2025 | 10-Q |
| 06/30/2025 | 08/08/2025 | 10-Q |
| 03/31/2025 | 05/02/2025 | 10-Q |
| 12/31/2024 | 02/21/2025 | 10-K |
| 09/30/2024 | 11/08/2024 | 10-Q |
| 06/30/2024 | 08/08/2024 | 10-Q |
| 03/31/2024 | 05/03/2024 | 10-Q |
| 12/31/2023 | 02/23/2024 | 10-K |
| 09/30/2023 | 11/03/2023 | 10-Q |
| 06/30/2023 | 08/04/2023 | 10-Q |
| 03/31/2023 | 05/05/2023 | 10-Q |
| 12/31/2022 | 02/24/2023 | 10-K |
| 09/30/2022 | 11/04/2022 | 10-Q |
| 06/30/2022 | 08/05/2022 | 10-Q |
| 03/31/2022 | 05/06/2022 | 10-Q |
| 12/31/2021 | 02/25/2022 | 10-K |
| 09/30/2021 | 11/05/2021 | 10-Q |
| 06/30/2021 | 08/06/2021 | 10-Q |
| 03/31/2021 | 05/06/2021 | 10-Q |
| 12/31/2020 | 02/22/2021 | 10-K |
| 09/30/2020 | 11/02/2020 | 10-Q |
| 06/30/2020 | 08/10/2020 | 10-Q |
| 03/31/2020 | 05/01/2020 | 10-Q |
| 12/31/2019 | 02/24/2020 | 10-K |
Recent Forward Guidance
Updated 11/5/2026Latest: Q3 2026 Earnings Reported 11/4/2026
| Forward Guidance | Guidance Change | |||||||
|---|---|---|---|---|---|---|---|---|
| Metric | Source | Low | Mid | High | % Chg | % Delta | Change | Prior |
| Q4 2026 Southern Timber Harvest Volume | Reported | 3.00 Mil | 3.10 Mil | 3.20 Mil | -3.1% | Lower New | Guidance: 3.20 Mil for Q3 2026 | |
| Q4 2026 Northwest Timber Harvest Volume | Reported | 0.50 Mil | 0.53 Mil | 0.55 Mil | -12.5% | Lower New | Guidance: 0.60 Mil for Q3 2026 | |
| Q4 2026 Wood Products Lumber Shipments | Reported | 295.00 Mil | 300.00 Mil | 305.00 Mil | ||||
| Q4 2026 Real Estate Adjusted EBITDA | Reported | 60.00 Mil | 65.00 Mil | 70.00 Mil | 116.7% | Higher New | Guidance: 30.00 Mil for Q3 2026 | |
| 2026 Southern Timber Harvest Volume | Reported | 12.20 Mil | 12.30 Mil | 12.40 Mil | -0.4% | Lowered | Guidance: 12.35 Mil for 2026 | |
| 2026 Northwest Timber Harvest Volume | Reported | 2.00 Mil | 2.05 Mil | 2.10 Mil | -2.4% | Lowered | Guidance: 2.10 Mil for 2026 | |
| 2026 Wood Products Lumber Shipments | Reported | 1.10 Bil | ||||||
Prior: Q2 2026 Earnings Reported 8/5/2026
| Forward Guidance | Guidance Change | |||||||
|---|---|---|---|---|---|---|---|---|
| Metric | Source | Low | Mid | High | % Chg | % Delta | Change | Prior |
| Q3 2026 Southern Timber Harvest Volume | Reported | 3.10 Mil | 3.20 Mil | 3.30 Mil | 6.7% | Higher New | Guidance: 3.00 Mil for Q2 2026 | |
| Q3 2026 Northwest Timber Harvest Volume | Reported | 0.60 Mil | 20.0% | Higher New | Guidance: 0.50 Mil for Q2 2026 | |||
| Q3 2026 Lumber Shipments | Reported | 320.00 Mil | 325.00 Mil | 330.00 Mil | 3.2% | Higher New | Guidance: 315.00 Mil for Q2 2026 | |
| Q3 2026 Real Estate Adjusted EBITDA | Reported | 25.00 Mil | 30.00 Mil | 35.00 Mil | 0 | Same New | Guidance: 30.00 Mil for Q2 2026 | |
| 2026 Southern Timber Harvest Volume | Reported | 12.20 Mil | 12.35 Mil | 12.50 Mil | 0 | Affirmed | Guidance: 12.35 Mil for 2026 | |
| 2026 Northwest Timber Harvest Volume | Reported | 2.00 Mil | 2.10 Mil | 2.20 Mil | -2.3% | Lowered | Guidance: 2.15 Mil for 2026 | |
| 2026 Lumber Shipments | Reported | 1.10 Bil | 0 | Affirmed | Guidance: 1.10 Bil for 2026 | |||
| 2026 Real Estate Adjusted EBITDA | Reported | 180.00 Mil | 190.00 Mil | 200.00 Mil | 0 | Affirmed | Guidance: 190.00 Mil for 2026 | |
Q1 2026 Earnings Reported 5/6/2026
| Forward Guidance | Guidance Change | |||||||
|---|---|---|---|---|---|---|---|---|
| Metric | Source | Low | Mid | High | % Chg | % Delta | Change | Prior |
| Q2 2026 Southern Timber Harvest Volume | Reported | 2.90 Mil | 3.00 Mil | 3.10 Mil | ||||
| Q2 2026 Northwest Timber Harvest Volume | Reported | 0.50 Mil | ||||||
| Q2 2026 Lumber Shipments | Reported | 310.00 Mil | 315.00 Mil | 320.00 Mil | ||||
| Q2 2026 Real Estate Adjusted EBITDA | Reported | 25.00 Mil | 30.00 Mil | 35.00 Mil | ||||
| 2026 Southern Timber Harvest Volume | Reported | 12.10 Mil | 12.35 Mil | 12.60 Mil | 0.0% | Affirmed | Guidance: 12.35 Mil for 2026 | |
| 2026 Northwest Timber Harvest Volume | Reported | 2.00 Mil | 2.15 Mil | 2.30 Mil | 0.0% | Affirmed | Guidance: 2.15 Mil for 2026 | |
| 2026 Lumber Shipments | Reported | 1.10 Bil | 0.0% | Affirmed | Guidance: 1.10 Bil for 2026 | |||
| 2026 Real Estate Adjusted EBITDA | Reported | 180.00 Mil | 190.00 Mil | 200.00 Mil | 0.0% | Affirmed | Guidance: 190.00 Mil for 2026 | |
Insider Activity
Updated 10/6/2026| # | Owner | Title | Holding | Action | Filing Date | Price | Shares | Transacted Value | Value of Held Shares | Form |
|---|---|---|---|---|---|---|---|---|---|---|
| 1 | Daniels, Ryan M | SVP, Wood Products | Direct | Sell | 10062026 | 18.22 | 14 | 255 | 978,396 | Form |
| 2 | Daniels, Ryan M | SVP, Wood Products | Direct | Sell | 10012026 | 18.56 | 887 | 16,463 | 996,913 | Form |
| 3 | Bridwell, Mark R | EVP, GC and Secretary | Direct | Sell | 9112026 | 20.19 | 5,318 | 107,370 | 2,658,236 | Form |
| 4 | Wasechek, Wayne | EVP and CFO | Direct | Sell | 4212026 | 21.17 | 2,920 | 61,816 | 2,445,770 | Form |
| 5 | Cremers, Eric J | Executive Chairman | Direct | Sell | 3022026 | 21.44 | 169,200 | 3,627,648 | 15,213,460 | Form |
| # | Owner | Title | Holding | Action | Filing Date | Price | Shares | Transacted Value | Value of Held Shares | Form |
|---|---|---|---|---|---|---|---|---|---|---|
| 1 | Daniels, Ryan M | SVP, Wood Products | Direct | Sell | 10062026 | 18.22 | 14 | 255 | 978,396 | Form |
| 2 | Daniels, Ryan M | SVP, Wood Products | Direct | Sell | 10012026 | 18.56 | 887 | 16,463 | 996,913 | Form |
| 3 | Bridwell, Mark R | EVP, GC and Secretary | Direct | Sell | 9112026 | 20.19 | 5,318 | 107,370 | 2,658,236 | Form |
| 4 | Wasechek, Wayne | EVP and CFO | Direct | Sell | 4212026 | 21.17 | 2,920 | 61,816 | 2,445,770 | Form |
| 5 | Cremers, Eric J | Executive Chairman | Direct | Sell | 3022026 | 21.44 | 169,200 | 3,627,648 | 15,213,460 | Form |
| 6 | Corr, Christopher T | SVP, Real Estate Development | Direct | Sell | 11212025 | 21.12 | 14,255 | 301,066 | 1,209,965 | Form |
Investor Activity (13F)
Updated Nov 13, 2026Active managers (13F portfolio over $250M, at least 3 holdings) with a position over $5M that is either over 10% of their portfolio or held in a concentrated book of 50 or fewer total positions. Index/ETF, sovereign, bank, community-bank and charitable/donor-advised filers are excluded.
| Active Manager | Value | % of Portfolio | Total Positions | QoQ | Filing |
|---|---|---|---|---|---|
| Southeastern Asset Management Inc/Tn/ | $221.9 Mil | 10.9% | 84 | ADD +89.5% | 13F |
| Kopernik Global Investors, LLC | $45.1 Mil | 3.1% | 27 | New | 13F |
| Central Securities Corp | $26.0 Mil | 2.1% | 30 | Hold | 13F |
| Troluce Capital Advisors LLC | $9.0 Mil | 0.9% | 46 | New | 13F |
| Atlas FRM LLC | $9.9 Mil | 0.6% | 41 | New | 13F |
| Active Manager |
|---|
| Active Manager | Value | % of Portfolio | Total Positions | QoQ | Filing |
|---|---|---|---|---|---|
| Southeastern Asset Management Inc/Tn/ | $221.9 Mil | 10.9% | 84 | ADD +89.5% | 13F |
| Kopernik Global Investors, LLC | $45.1 Mil | 3.1% | 27 | New | 13F |
| Central Securities Corp | $26.0 Mil | 2.1% | 30 | Hold | 13F |
| Atlas FRM LLC | $9.9 Mil | 0.6% | 41 | New | 13F |
| Troluce Capital Advisors LLC | $9.0 Mil | 0.9% | 46 | New | 13F |
Rayonier — Investor Video Playlist




Industry Resources
| Real Estate Resources |
| The Real Deal |
| Commercial Observer |
| Inman |
| Timber REITs Resources |
| Forest2Market |
| Fastmarkets RISI |
| TimberLine |
External Quote Links
| Y Finance | Barrons |
| TradingView | Morningstar |
| SeekingAlpha | ValueLine |
| Motley Fool | Robinhood |
| CNBC | Etrade |
| MarketWatch | Unusual Whales |
| YCharts | Perplexity Finance |
| FinViz |
Prefer one of these to Trefis? Tell us why.