
JFrog (FROG)
Market Price (9/19/2026): $92.48 | Market Cap: $11.3 BilSector: Information Technology | Industry: Application Software
JFrog (FROG)
Market Price (9/19/2026): $92.48Market Cap: $11.3 BilSector: Information TechnologyIndustry: Application Software
Investment Highlights Why It Matters Detailed financial logic regarding cash flow yields vs trend-riding momentum.
Attractive cash flow generationCFO/Rev LTMCash Flow from Operations / Revenue (Sales), Last Twelve Months (LTM) is 29%, FCF/Rev LTMFree Cash Flow / Revenue (Sales), Last Twelve Months (LTM) is 28% Megatrend and thematic driversMegatrends include Cybersecurity, Cloud Computing, and E-commerce & DTC Adoption. Themes include Software Security, Show more. | Not profitable at operating income levelOp Inc LTMOperating Income, Last Twelve Months is -67 Mil, Op Mgn LTMOperating Margin = Operating Income / Revenue Reflects profitability before taxes and before impact of capital structure (interest payments). is -11% Stock price has recently run up significantly6M Rtn6 month market price return is 120% Significant share based compensationSBC/Rev LTMShare Based Compensation / Revenue (Sales), Last Twelve Months (LTM) is 27% Valuation getting more expensiveP/S 6M Chg %Price/Sales change over 6 months. Declining P/S indicates valuation has become less expensive. is 88% Yield minus risk free rate is negativeERPEquity Risk Premium (ERP) = Total Yield - Risk Free Rate, Reflects the premium above risk free assets offered by the investment. is -4.5% Key risksFROG key risks include [1] intense competition from cloud hyperscalers (AWS, Show more. |
| Attractive cash flow generationCFO/Rev LTMCash Flow from Operations / Revenue (Sales), Last Twelve Months (LTM) is 29%, FCF/Rev LTMFree Cash Flow / Revenue (Sales), Last Twelve Months (LTM) is 28% |
| Megatrend and thematic driversMegatrends include Cybersecurity, Cloud Computing, and E-commerce & DTC Adoption. Themes include Software Security, Show more. |
| Not profitable at operating income levelOp Inc LTMOperating Income, Last Twelve Months is -67 Mil, Op Mgn LTMOperating Margin = Operating Income / Revenue Reflects profitability before taxes and before impact of capital structure (interest payments). is -11% |
| Stock price has recently run up significantly6M Rtn6 month market price return is 120% |
| Significant share based compensationSBC/Rev LTMShare Based Compensation / Revenue (Sales), Last Twelve Months (LTM) is 27% |
| Valuation getting more expensiveP/S 6M Chg %Price/Sales change over 6 months. Declining P/S indicates valuation has become less expensive. is 88% |
| Yield minus risk free rate is negativeERPEquity Risk Premium (ERP) = Total Yield - Risk Free Rate, Reflects the premium above risk free assets offered by the investment. is -4.5% |
| Key risksFROG key risks include [1] intense competition from cloud hyperscalers (AWS, Show more. |
Qualitative Assessment
AI Analysis | Feedback
JFrog (FROG) stock has gained about 15% since 5/31/2026 because of the following key factors:
1. Strong Fiscal Q2 2026 Financial Performance and Raised Full-Year Guidance.
JFrog reported robust results for its fiscal second quarter of 2026, which ended in June 2026. The company announced non-GAAP diluted earnings per share of $0.27, surpassing analysts' consensus estimates of $0.24 by $0.03. Additionally, revenue for the quarter increased by 28.7% year-over-year to $163.77 million, exceeding the consensus estimate of $155.63 million. Following this strong performance, JFrog raised its full-year 2026 revenue guidance to a range of $648 million to $652 million and its non-GAAP diluted EPS guidance to between $0.96 and $1.00, signaling confidence in sustained growth.
2. Accelerated Cloud Revenue Growth.
A significant factor contributing to the stock's positive trend was the accelerating growth in JFrog's cloud revenue. In fiscal Q2 2026, cloud sales surged by 53% year-over-year, reaching $87.5 million, and now constitute 53% of the company's total revenue. This strong performance in cloud adoption underscores the company's successful shift towards scalable, cloud-based solutions and its relevance in the evolving software supply chain security and AI/ML governance markets.
Show more
JFrog (FROG) stock has gained about 15% since 5/31/2026 because of the following key factors:
1. Strong Fiscal Q2 2026 Financial Performance and Raised Full-Year Guidance.
JFrog reported robust results for its fiscal second quarter of 2026, which ended in June 2026. The company announced non-GAAP diluted earnings per share of $0.27, surpassing analysts' consensus estimates of $0.24 by $0.03. Additionally, revenue for the quarter increased by 28.7% year-over-year to $163.77 million, exceeding the consensus estimate of $155.63 million. Following this strong performance, JFrog raised its full-year 2026 revenue guidance to a range of $648 million to $652 million and its non-GAAP diluted EPS guidance to between $0.96 and $1.00, signaling confidence in sustained growth.
2. Accelerated Cloud Revenue Growth.
A significant factor contributing to the stock's positive trend was the accelerating growth in JFrog's cloud revenue. In fiscal Q2 2026, cloud sales surged by 53% year-over-year, reaching $87.5 million, and now constitute 53% of the company's total revenue. This strong performance in cloud adoption underscores the company's successful shift towards scalable, cloud-based solutions and its relevance in the evolving software supply chain security and AI/ML governance markets.
3. Positive Analyst Sentiment and Increased Price Targets.
Following the announcement of the strong fiscal Q2 2026 results and an optimistic outlook, financial analysts largely maintained or upgraded their ratings for JFrog's stock. The consensus rating from analysts is "Strong Buy" or "Moderate Buy," with an average 12-month price target ranging from approximately $107 to $112. Several firms, including Oppenheimer and Needham & Company LLC, increased their price targets, and RBC Capital Markets initiated coverage with an "Outperform" rating and a $118 price target, emphasizing JFrog's role as a critical infrastructure provider in the artificial intelligence (AI) era.
4. Inclusion in Russell 3000 Index.
JFrog's inclusion in the Russell 3000® Index, which became effective after the U.S. market close on June 26, 2026, likely contributed to increased institutional investor interest and demand for the stock. This inclusion can lead to greater visibility and investment from passive funds that track the index.
Show less
Stock Movement Drivers
Fundamental Drivers
The 16.8% change in FROG stock from 5/31/2026 to 9/18/2026 was primarily driven by a 11.2% change in the company's P/S Multiple.| (LTM values as of) | 5312026 | 9182026 | Change |
|---|---|---|---|
| Stock Price ($) | 79.48 | 92.81 | 16.8% |
| Change Contribution By: | |||
| Total Revenues ($ Mil) | 563 | 600 | 6.5% |
| P/S Multiple | 17.0 | 18.8 | 11.2% |
| Shares Outstanding (Mil) | 120 | 122 | -1.4% |
| Cumulative Contribution | 16.8% |
Market Drivers
5/31/2026 to 9/18/2026| Return | Correlation | |
|---|---|---|
| FROG | 16.8% | |
| Market (SPY) | 0.9% | 30.7% |
| Sector (XLK) | -0.7% | 33.6% |
Fundamental Drivers
The 131.2% change in FROG stock from 2/28/2026 to 9/18/2026 was primarily driven by a 110.1% change in the company's P/S Multiple.| (LTM values as of) | 2282026 | 9182026 | Change |
|---|---|---|---|
| Stock Price ($) | 40.15 | 92.81 | 131.2% |
| Change Contribution By: | |||
| Total Revenues ($ Mil) | 532 | 600 | 12.8% |
| P/S Multiple | 9.0 | 18.8 | 110.1% |
| Shares Outstanding (Mil) | 119 | 122 | -2.5% |
| Cumulative Contribution | 131.2% |
Market Drivers
2/28/2026 to 9/18/2026| Return | Correlation | |
|---|---|---|
| FROG | 131.2% | |
| Market (SPY) | 11.6% | 26.5% |
| Sector (XLK) | 36.8% | 36.9% |
Fundamental Drivers
The 88.0% change in FROG stock from 8/31/2025 to 9/18/2026 was primarily driven by a 57.2% change in the company's P/S Multiple.| (LTM values as of) | 8312025 | 9182026 | Change |
|---|---|---|---|
| Stock Price ($) | 49.37 | 92.81 | 88.0% |
| Change Contribution By: | |||
| Total Revenues ($ Mil) | 475 | 600 | 26.4% |
| P/S Multiple | 12.0 | 18.8 | 57.2% |
| Shares Outstanding (Mil) | 115 | 122 | -5.4% |
| Cumulative Contribution | 88.0% |
Market Drivers
8/31/2025 to 9/18/2026| Return | Correlation | |
|---|---|---|
| FROG | 88.0% | |
| Market (SPY) | 19.4% | 24.1% |
| Sector (XLK) | 45.1% | 32.1% |
Fundamental Drivers
The 223.5% change in FROG stock from 8/31/2023 to 9/18/2026 was primarily driven by a 100.2% change in the company's P/S Multiple.| (LTM values as of) | 8312023 | 9182026 | Change |
|---|---|---|---|
| Stock Price ($) | 28.69 | 92.81 | 223.5% |
| Change Contribution By: | |||
| Total Revenues ($ Mil) | 313 | 600 | 92.0% |
| P/S Multiple | 9.4 | 18.8 | 100.2% |
| Shares Outstanding (Mil) | 103 | 122 | -15.8% |
| Cumulative Contribution | 223.5% |
Market Drivers
8/31/2023 to 9/18/2026| Return | Correlation | |
|---|---|---|
| FROG | 223.5% | |
| Market (SPY) | 75.6% | 33.3% |
| Sector (XLK) | 119.9% | 35.2% |
Price Returns Compared
| 2021 | 2022 | 2023 | 2024 | 2025 | 2026 | Total [1] | |
|---|---|---|---|---|---|---|---|
| Returns | |||||||
| FROG Return | -53% | -28% | 62% | -15% | 112% | 50% | 50% |
| Peers Return | 24% | -31% | 52% | 24% | 18% | 8% | 107% |
| S&P 500 Return | 27% | -19% | 24% | 23% | 16% | 12% | 103% |
Monthly Win Rates [3] | |||||||
| FROG Win Rate | 17% | 42% | 50% | 50% | 75% | 44% | |
| Peers Win Rate | 60% | 32% | 65% | 67% | 47% | 47% | |
| S&P 500 Win Rate | 75% | 42% | 67% | 75% | 67% | 44% | |
Max Drawdowns [4] | |||||||
| FROG Max Drawdown | -59% | -46% | -36% | -48% | -33% | -45% | |
| Peers Max Drawdown | -12% | -42% | -24% | -24% | -30% | -31% | |
| S&P 500 Max Drawdown | -5% | -25% | -10% | -8% | -19% | -9% | |
[1] Cumulative total returns since the beginning of 2021
[2] Peers: GTLB, MSFT, AMZN, GOOGL, IBM.
[3] Win Rate = % of calendar months in which monthly returns were positive
[4] Max drawdown represents maximum peak-to-trough decline within a year
[5] 2026 data is for the year up to 9/18/2026 (YTD)
How Low Can It Go
| Event | FROG | S&P 500 |
|---|---|---|
| 2025 US Tariff Shock | ||
| % Loss | -29.7% | -18.8% |
| % Gain to Breakeven | 42.3% | 23.1% |
| Time to Breakeven | 34 days | 79 days |
| 2024 Yen Carry Trade Unwind | ||
| % Loss | -30.0% | -7.8% |
| % Gain to Breakeven | 42.9% | 8.5% |
| Time to Breakeven | 173 days | 18 days |
| Summer-Fall 2023 Five Percent Yield Shock | ||
| % Loss | -27.6% | -9.5% |
| % Gain to Breakeven | 38.1% | 10.5% |
| Time to Breakeven | 39 days | 24 days |
| 2023 SVB Regional Banking Crisis | ||
| % Loss | -25.0% | -6.7% |
| % Gain to Breakeven | 33.3% | 7.1% |
| Time to Breakeven | 27 days | 31 days |
| 2022 Inflation Shock & Fed Tightening | ||
| % Loss | -46.0% | -24.5% |
| % Gain to Breakeven | 85.1% | 32.4% |
| Time to Breakeven | 583 days | 427 days |
In The Past
JFrog's stock fell -29.7% during the 2025 US Tariff Shock. Such a loss loss requires a 42.3% gain to breakeven.
Preserve Wealth
Limiting losses and compounding gains is essential to preserving wealth.
Asset Allocation
Actively managed asset allocation strategies protect wealth. Learn more.
| Event | FROG | S&P 500 |
|---|---|---|
| 2025 US Tariff Shock | ||
| % Loss | -29.7% | -18.8% |
| % Gain to Breakeven | 42.3% | 23.1% |
| Time to Breakeven | 34 days | 79 days |
| 2024 Yen Carry Trade Unwind | ||
| % Loss | -30.0% | -7.8% |
| % Gain to Breakeven | 42.9% | 8.5% |
| Time to Breakeven | 173 days | 18 days |
| Summer-Fall 2023 Five Percent Yield Shock | ||
| % Loss | -27.6% | -9.5% |
| % Gain to Breakeven | 38.1% | 10.5% |
| Time to Breakeven | 39 days | 24 days |
| 2023 SVB Regional Banking Crisis | ||
| % Loss | -25.0% | -6.7% |
| % Gain to Breakeven | 33.3% | 7.1% |
| Time to Breakeven | 27 days | 31 days |
| 2022 Inflation Shock & Fed Tightening | ||
| % Loss | -46.0% | -24.5% |
| % Gain to Breakeven | 85.1% | 32.4% |
| Time to Breakeven | 583 days | 427 days |
In The Past
JFrog's stock fell -29.7% during the 2025 US Tariff Shock. Such a loss loss requires a 42.3% gain to breakeven.
Preserve Wealth
Limiting losses and compounding gains is essential to preserving wealth.
Asset Allocation
Actively managed asset allocation strategies protect wealth. Learn more.
About JFrog (FROG)
JFrog Ltd. (FROG) offers a comprehensive DevOps platform designed to streamline and automate the entire software supply chain for organizations. Essentially, JFrog helps businesses manage, secure, and deliver their software applications more efficiently, from initial development through to deployment and updates. Its solutions are critical for companies looking to accelerate their software development cycles, ensure package integrity, and maintain a robust and secure software delivery pipeline.
At the core of JFrog's offering is JFrog Artifactory, a universal package repository that acts as a central hub for storing, updating, and managing all software components and packages. Complementing Artifactory are tools like JFrog Pipelines, which automates the continuous integration and delivery (CI/CD) process, and JFrog Xray, which scans packages for security vulnerabilities and compliance issues. The company also provides JFrog Distribution for enterprise-grade software delivery, including incremental updates, and JFrog Connect specifically for managing software updates and monitoring performance across fleets of IoT devices. These products are available across various tiers, from Pro to Enterprise Plus, offering features tailored to different organizational needs.
JFrog serves a wide array of large organizations across diverse industries that rely heavily on software development and deployment. Its primary customers include technology companies, financial services institutions, retail chains, healthcare providers, and telecommunications firms. Any enterprise that needs to manage a complex and secure software supply chain, accelerate its development processes, and ensure the reliable distribution of its software can benefit from JFrog's integrated platform.
AI Analysis | Feedback
GitHub for compiled software packages.
Amazon Logistics for software supply chains.
Tesla's automated factory for software development.
AI Analysis | Feedback
- JFrog Artifactory: A package repository that allows teams and organizations to store, update, and manage their software packages at any scale.
- JFrog Pipelines: An integration/continuous delivery tool for automating and orchestrating the movement of software packages.
- JFrog Xray: Scans JFrog Artifactory for security vulnerabilities and license compliance.
- JFrog Distribution: Provides software package distribution with enterprise-grade performance.
- JFrog Artifactory Edge: Utilizes and leverages metadata from JFrog Artifactory to facilitate the transfer of incremental changes in software packages.
- JFrog Mission Control: A platform control panel that provides a comprehensive view of an organization's software supply chain workflow.
- JFrog Insight: A DevOps intelligence tool for analytics and reporting.
- JFrog Connect: A device management solution that allows companies to manage software updates and monitor performance across IoT device fleets.
AI Analysis | Feedback
JFrog (FROG) sells its DevOps platform and related products primarily to other companies and organizations.
While the provided background does not list specific customer company names, it identifies its major customers as organizations within the following sectors:
- Technology organizations
- Financial services organizations
- Retail organizations
- Healthcare organizations
- Telecommunications organizations
AI Analysis | Feedback
Amazon.com, Inc. (AMZN)
Alphabet Inc. (GOOGL)
Microsoft Corporation (MSFT)
AI Analysis | Feedback
Shlomi Ben Haim, Co-Founder and CEO
Shlomi Ben Haim is a co-founder and has served as CEO of JFrog since April 2008 and Chairman of the board of directors since January 2020. He has over 20 years of experience building profitable, high-growth information technology companies. Prior to co-founding JFrog, he was the CEO of AlphaCSP Ltd. (AlphaCSP), a company implementing software applications that was acquired by Malam Group in 2005. He served as CEO of AlphaCSP from June 2006 to June 2009. He also served in the Israeli Air Force, reaching the rank of Major.
Ed Grabscheid, Chief Financial Officer
Ed Grabscheid is the Chief Financial Officer at JFrog, overseeing global finance, treasury, and investor relations. He is a seasoned finance leader with over 25 years of experience driving growth and value at high-performing technology companies. Prior to JFrog, Ed has experience leading both private and public company finance teams and has successfully guided organizations from startup to IPO.
Yoav Landman, Co-Founder and CTO
Yoav Landman is a co-founder and the CTO of JFrog. He is recognized as the visionary behind Artifactory, JFrog's universal artifact repository manager. Before co-founding JFrog in April 2008, he spent over a decade as a senior consultant specializing in Distributed Computing and Enterprise Build Systems. He also held various senior technical roles in global organizations, including senior consultant at AlphaCSP and senior developer at Attunity, Verve, and Sausage.
Gal Marder, Chief Strategy Officer
Gal Marder brings over 20 years of experience across various tech leadership positions. He joined JFrog in 2018 through the acquisition of Trainologic, a cutting-edge DevOps technology consulting company he co-founded and served as CEO. After the acquisition, Marder initially served as VP of DevOps Acceleration, scaling and leading the team providing solutions engineering and professional services. In his current role, he leads the company's strategic direction, including exploring new market opportunities, cultivating partnerships, and pursuing M&A initiatives.
Tali Notman, Chief Revenue Officer
Tali Notman has served as JFrog's Chief Revenue Officer since January 2019. She has been instrumental in running the Sales team at JFrog from the company's early days, developing the sales funnel, building a global sales team, and establishing customer and partner relationships. Before joining JFrog, she held executive Human Resources roles at companies including AlphaCSP, Malam, the Prime Minister's Office, and SQLink.
AI Analysis | Feedback
Key Risks to JFrog's Business
- Intense Competition, particularly from Cloud Hyperscalers and Version Control System (VCS) Providers: JFrog faces significant competition from major cloud providers, such as Amazon Web Services (AWS) with CodeArtifact and Google Cloud with Artifact Registry, which bundle repository services within their existing ecosystems and leverage established enterprise relationships. Additionally, strong competition comes from VCS providers like GitHub (owned by Microsoft) and GitLab, who represent a major entry point into the software release management pipeline and can up-sell into other functions like CI/CD, package storage, and code security. The market for DevOps and DevSecOps tools is also seeing consolidation, with larger entities directly competing with JFrog's offerings. This competitive landscape can impact JFrog's market position, pricing power, and ability to expand its customer base.
- Disruption from AI-native Tools and Evolving Software Security Paradigms: The emergence of AI-native tools for code security and vulnerability detection, such as Anthropic's Claude Code Security, poses a risk to JFrog's traditional security models. There is a concern that if AI can detect vulnerabilities earlier in the coding process, enterprises might perceive a reduced need for JFrog's downstream package-level controls and incremental security modules, potentially slowing their adoption. There's also a longer-term fear that AI platforms could expand into artifact scanning, directly overlapping with JFrog's core portfolio. While JFrog is actively integrating AI into its offerings, for example, through its acquisition of Qwak AI to embed MLOps into its platform, the rapid evolution and potential "platform creep" of AI tools present a significant challenge to JFrog's market position and product strategy.
- Dependence on Large Enterprise Contracts and Exposure to Macroeconomic Headwinds: JFrog's business model is significantly reliant on large enterprise customers and multi-year contracts, which introduces risks related to customer concentration and the timing of substantial deals. Delays, renegotiations, or the loss of these large contracts can adversely affect JFrog's financial performance. Furthermore, the company is susceptible to global economic conditions, such as inflation, recession, and rising interest rates, which can lead to enterprises tightening their IT budgets, extending cloud migration timelines, and scrutinizing investments in DevOps projects. Such macroeconomic pressures can negatively impact JFrog's revenue growth, customer expansion, and overall financial results.
AI Analysis | Feedback
The increasing maturity and comprehensive nature of native DevOps platform offerings from major cloud providers (such as AWS CodeArtifact, CodePipeline, Azure Artifacts, Azure Pipelines, Google Cloud Artifact Registry, and Cloud Build). These deeply integrated services directly compete with JFrog's core products like Artifactory and Pipelines, and present an alternative, cloud-native approach to managing the software supply chain. For organizations committed to a single cloud ecosystem, these native tools offer the potential for simplified procurement, tighter integration with other cloud services, and perceived cost efficiencies, potentially reducing the need for a specialized, cloud-agnostic platform.
AI Analysis | Feedback
AI Analysis | Feedback
1. Strong Cloud Growth and Migration: JFrog anticipates continued robust growth in its cloud business, driven by increasing customer usage and an ongoing trend of customers migrating from self-managed subscriptions to hybrid or multi-cloud environments. The company projects cloud growth of 30-32% for 2026.
2. Deepening Enterprise Adoption and Platform Consolidation: Large enterprises are increasingly adopting the comprehensive JFrog platform, recognizing its critical role in the software supply chain. Revenue from JFrog's premium Enterprise+ offering has steadily grown, representing over 56% of total revenue in Q3 FY2025, indicating deeper integration and consolidation of tools within customer environments.
3. Expansion into Security, Compliance, and Governance (DevSecOps/DevGovOps): JFrog has strategically expanded its platform to include security, compliance, and governance functionalities. Products like JFrog Advanced Security and JFrog Curation are expected to contribute materially to revenue. The company emphasizes its strong position in binary security and governance, which are crucial for deployed code.
4. Growth in AI/MLOps and Securing AI Models: JFrog is focusing on securing AI models and Machine Learning Operations (MLOps) development as a significant future growth area. The company's acquisition of Qwak AI in 2024 aims to unify DevOps, DevSecOps, and MLOps within a single platform, and a notable AI customer is already contributing over $1 million in Annual Recurring Revenue (ARR). MLOps is projected to be a rapidly expanding market, adding substantial potential to JFrog by 2030.
AI Analysis | Feedback
Share Repurchases
- On February 26, 2026, JFrog's Board of Directors authorized a share repurchase program of up to $300 million of its outstanding ordinary shares.
- The program is expected to be funded with existing cash on hand and future cash generated from operations.
- Repurchases may occur through various methods, including open market purchases or privately negotiated transactions, and the program is discretionary and can be suspended or discontinued.
Share Issuance
- JFrog's shares outstanding have shown an increasing trend, with 0.116 billion shares outstanding in 2025, a 5.93% increase from 2024.
- In 2024, shares outstanding were 0.11 billion, an increase of 6.17% from 2023, and in 2023, they were 0.103 billion, a 4.11% increase from 2022.
- Historically, JFrog has funded its operations and capital expenditures in part through equity issuances.
Outbound Investments
- In June 2024, JFrog acquired Qwak for $230 million to expand its capabilities in AI and MLOps (Machine Learning Operations).
- In September 2021, JFrog acquired Upswift to integrate connected device management and over-the-air (OTA) updates for IoT devices into its platform.
- In July 2021, JFrog completed the acquisition of Vdoo Connected Trust Ltd. for approximately $300 million, comprised of cash and JFrog ordinary shares, to enhance its security offerings and DevSecOps capabilities.
Capital Expenditures
- JFrog's capital expenditures for fiscal year 2025 totaled $4.33 million.
- Capital expenditures were $3.14 million in fiscal year 2024 and $1.98 million in fiscal year 2023.
- The company focuses on balancing these investments with growth, particularly in areas like R&D and sales.
Peer Outperformance in Application Software
| Industry | Names | 1Y med | 3Y med | 5Y med | Top 3 by 5Y |
|---|---|---|---|---|---|
| Electronic Manufacturing Services | 9 | 52.1% | 181.3% | 268.8% | TTMI 801% · FLEX 705% · SANM 419% |
| Technology Distributors | 9 | 28.9% | 72.0% | 93.7% | CLMB 332% · AVT 193% · SNX 146% |
| Semiconductor Materials & Equipment | 26 | 89.8% | 82.2% | 93.2% | AXTI 784% · AEHR 741% · KLAC 402% |
| Communications Equipment | 36 | 16.8% | 84.8% | 75.0% | AAOI 1310% · LITE 990% · FEIM 981% |
| Electronic Components | 26 | 32.0% | 62.1% | 64.5% | CLS 3836% · BELFA 1302% · COHR 425% |
| Technology Hardware, Storage & Peripherals | 20 | 33.3% | 77.5% | 50.2% | DELL 1135% · STX 1090% · SMCI 949% |
| Semiconductors | 55 | 20.4% | 28.8% | 38.4% | POET 1815% · MU 1302% · NVDA 919% |
| Internet Services & Infrastructure | 6 | 7.4% | 46.2% | 23.4% | DOCN 58% · VRSN 41% · GDDY 35% |
| Electronic Equipment & Instruments | 26 | -13.1% | 6.0% | -11.4% | PI 216% · ACFN 114% · OSIS 112% |
| IT Consulting & Other Services | 28 | -24.5% | -19.3% | -28.5% | CHRN 537268% · APLD 1258% · TSSI 669% |
| Application Software ← | 122 | -30.3% | -16.0% | -46.5% | VIDA 176264% · INLX 5435% · PLTR 519% |
| Systems Software | 68 | -17.7% | 7.9% | -55.7% | QNC 457% · ZETA 379% · PANW 358% |
Latest Trefis Analyses
| Title | Date | |
|---|---|---|
| DASHBOARDS | ||
| JFrog Stock Surges 14%, With A 5-Day Winning Spree | 05/21/2026 | |
| JFrog Stock (-7.2%): Executive Stock Sales Spook Investors | 03/05/2026 | |
| JFrog Stock vs Competition: Who Wins? | 02/27/2026 | |
| JFrog Stock Dips 25% In One Day, Wait For A Dip To Buy The Stock | 02/21/2026 | |
| Can JFrog Stock Recover If Markets Fall? | 02/21/2026 | |
| JFrog Earnings Notes | 12/29/2026 | |
| Why JFrog Stock Moved: FROG Stock Has Gained 213% Since 2022 Fiscal End, Primarily Due To Favorable Change In Price To Sales Multiple (P/S) | 08/08/2025 | |
| FROG Dip Buy Analysis | 07/10/2025 | |
| JFrog (FROG) Valuation Ratios Comparison | 05/15/2025 | |
| ARTICLES | ||
| Mid Cap Stocks Trading At 52-Week High | 07/07/2026 | |
| JFrog Stock 5-Day Winning Spree: Stock Climbs 14% | 05/21/2026 | |
| JFrog Stock To $27? | 02/21/2026 | |
| Small Cap Stocks Trading At 52-Week High | 12/08/2025 |
Research & Analysis
Invest in Strategies
Wealth Management
Peer Comparisons
| Peers to compare with: |
Financials
| Median | |
|---|---|
| Name | |
| Mkt Price | 241.63 |
| Mkt Cap | 1,474.1 |
| Rev LTM | 200,468 |
| Op Inc LTM | 53,208 |
| FCF LTM | 6,679 |
| FCF 3Y Avg | 14,514 |
| CFO LTM | 88,146 |
| CFO 3Y Avg | 72,069 |
Growth & Margins
| Median | |
|---|---|
| Name | |
| Rev Chg LTM | 18.9% |
| Rev Chg 3Y Avg | 15.8% |
| Rev Chg Q | 20.5% |
| QoQ Delta Rev Chg LTM | 4.7% |
| Op Inc Chg LTM | 21.2% |
| Op Inc Chg 3Y Avg | 22.4% |
| Op Mgn LTM | 15.2% |
| Op Mgn 3Y Avg | 13.9% |
| QoQ Delta Op Mgn LTM | 0.2% |
| CFO/Rev LTM | 25.5% |
| CFO/Rev 3Y Avg | 24.6% |
| FCF/Rev LTM | 19.6% |
| FCF/Rev 3Y Avg | 17.5% |
Price Behavior
| Market Price | $92.81 | |
| Market Cap ($ Bil) | 11.3 | |
| First Trading Date | 09/16/2020 | |
| Distance from 52W High | -10.8% | |
| 50 Days | 200 Days | |
| DMA Price | $88.76 | $66.78 |
| DMA Trend | up | up |
| Distance from DMA | 4.6% | 39.0% |
| 3M | 1YR | |
| Volatility | 65.7% | 72.9% |
| Downside Capture | 199.46 | 141.53 |
| Upside Capture | 241.11 | 189.49 |
| Correlation (SPY) | 32.9% | 24.6% |
| 1M | 2M | 3M | 6M | 1Y | 3Y | |
|---|---|---|---|---|---|---|
| Beta | 4.48 | 2.72 | 1.64 | 1.40 | 1.40 | 1.31 |
| Up Beta | 2.13 | 3.70 | 1.47 | 0.75 | 0.96 | 1.24 |
| Down Beta | 1.00 | -0.46 | -0.57 | 0.27 | 0.90 | 1.29 |
| Up Capture | 789% | 362% | 375% | 442% | 317% | 351% |
| Bmk +ve Days | 10 | 21 | 32 | 68 | 138 | 427 |
| Stock +ve Days | 9 | 20 | 30 | 68 | 130 | 382 |
| Down Capture | 477% | 273% | 185% | 108% | 126% | 105% |
| Bmk -ve Days | 11 | 21 | 32 | 59 | 113 | 324 |
| Stock -ve Days | 12 | 22 | 34 | 59 | 121 | 367 |
[1] Upside and downside betas calculated using positive and negative benchmark daily returns respectively
Based On 1-Year Data
| Annualized Return | Annualized Volatility | Sharpe Ratio | Correlation with FROG | |
|---|---|---|---|---|
| FROG | 94.0% | 72.9% | 1.21 | - |
| Sector ETF (XLK) | 40.5% | 26.4% | 1.25 | 32.4% |
| Equity (SPY) | 16.9% | 12.9% | 0.94 | 24.4% |
| Gold (GLD) | 19.1% | 29.3% | 0.60 | 3.2% |
| Commodities (DBC) | 46.9% | 20.6% | 1.76 | -3.0% |
| Real Estate (VNQ) | 4.9% | 13.6% | 0.10 | -1.6% |
| Bitcoin (BTCUSD) | -34.5% | 43.9% | -0.84 | 18.6% |
Smart multi-asset allocation framework can stack odds in your favor. Learn How
Based On 5-Year Data
| Annualized Return | Annualized Volatility | Sharpe Ratio | Correlation with FROG | |
|---|---|---|---|---|
| FROG | 19.9% | 57.4% | 0.54 | - |
| Sector ETF (XLK) | 20.2% | 25.9% | 0.69 | 42.3% |
| Equity (SPY) | 12.9% | 17.2% | 0.57 | 40.0% |
| Gold (GLD) | 19.1% | 18.8% | 0.83 | 3.8% |
| Commodities (DBC) | 11.3% | 19.5% | 0.45 | 5.6% |
| Real Estate (VNQ) | 1.1% | 18.8% | -0.05 | 25.6% |
| Bitcoin (BTCUSD) | 11.2% | 52.5% | 0.39 | 18.1% |
Smart multi-asset allocation framework can stack odds in your favor. Learn How
Based On 10-Year Data
| Annualized Return | Annualized Volatility | Sharpe Ratio | Correlation with FROG | |
|---|---|---|---|---|
| FROG | 3.4% | 57.9% | 0.33 | - |
| Sector ETF (XLK) | 24.4% | 25.0% | 0.88 | 40.7% |
| Equity (SPY) | 15.1% | 18.0% | 0.72 | 37.3% |
| Gold (GLD) | 12.1% | 16.4% | 0.61 | 4.7% |
| Commodities (DBC) | 8.3% | 18.1% | 0.37 | 6.0% |
| Real Estate (VNQ) | 4.4% | 20.7% | 0.18 | 23.3% |
| Bitcoin (BTCUSD) | 61.7% | 66.1% | 1.02 | 11.4% |
Smart multi-asset allocation framework can stack odds in your favor. Learn How
Returns Analyses
Earnings Returns History
Updated 9/9/2026| Forward Returns | |||
|---|---|---|---|
| Earnings Date | 1D Returns | 5D Returns | 21D Returns |
| 8/6/2026 | 7.8% | 14.6% | 5.5% |
| 5/7/2026 | 23.7% | 14.1% | 50.2% |
| 2/12/2026 | -3.0% | -29.2% | -19.2% |
| 11/6/2025 | 27.0% | 26.1% | 45.6% |
| 8/7/2025 | 12.5% | 10.2% | 30.0% |
| 5/8/2025 | 10.6% | 22.4% | 20.4% |
| 2/13/2025 | 5.5% | 2.2% | -8.9% |
| 11/7/2024 | -5.4% | -4.2% | -5.9% |
| ... | |||
| SUMMARY STATS | |||
| # Positive | 12 | 12 | 11 |
| # Negative | 12 | 12 | 13 |
| Median Positive | 11.5% | 14.4% | 20.4% |
| Median Negative | -6.2% | -13.7% | -18.2% |
| Max Positive | 28.4% | 28.6% | 50.2% |
| Max Negative | -27.5% | -29.2% | -22.6% |
| Forward Returns | |||
|---|---|---|---|
| Earnings Date | 1D Returns | 5D Returns | 21D Returns |
| 8/6/2026 | 7.8% | 14.6% | 5.5% |
| 5/7/2026 | 23.7% | 14.1% | 50.2% |
| 2/12/2026 | -3.0% | -29.2% | -19.2% |
| 11/6/2025 | 27.0% | 26.1% | 45.6% |
| 8/7/2025 | 12.5% | 10.2% | 30.0% |
| 5/8/2025 | 10.6% | 22.4% | 20.4% |
| 2/13/2025 | 5.5% | 2.2% | -8.9% |
| 11/7/2024 | -5.4% | -4.2% | -5.9% |
| 8/7/2024 | -27.5% | -23.9% | -19.6% |
| 5/9/2024 | -18.7% | -19.0% | -19.3% |
| 2/14/2024 | 28.4% | 18.1% | 13.8% |
| 11/1/2023 | 16.6% | 17.1% | 25.6% |
| 8/2/2023 | 3.4% | -3.6% | 1.1% |
| 5/3/2023 | 15.4% | 28.6% | 35.4% |
| 2/8/2023 | -1.8% | -1.9% | -22.6% |
| 11/2/2022 | -1.3% | -12.3% | -1.7% |
| 8/3/2022 | 2.2% | 8.6% | -18.2% |
| 5/9/2022 | -0.3% | -3.8% | 0.2% |
| 2/10/2022 | -7.1% | -7.9% | -19.5% |
| 11/4/2021 | 10.1% | 4.5% | -17.1% |
| 8/5/2021 | -13.3% | -16.1% | -17.8% |
| 5/6/2021 | -14.6% | -18.1% | 9.2% |
| 2/11/2021 | -0.2% | 1.4% | -22.5% |
| 11/4/2020 | -9.6% | -15.0% | -5.2% |
| SUMMARY STATS | |||
| # Positive | 12 | 12 | 11 |
| # Negative | 12 | 12 | 13 |
| Median Positive | 11.5% | 14.4% | 20.4% |
| Median Negative | -6.2% | -13.7% | -18.2% |
| Max Positive | 28.4% | 28.6% | 50.2% |
| Max Negative | -27.5% | -29.2% | -22.6% |
SEC Filings
Expand for More| Report Date | Filing Date | Filing |
|---|---|---|
| 06/30/2026 | 08/07/2026 | 10-Q |
| 03/31/2026 | 05/08/2026 | 10-Q |
| 12/31/2025 | 02/13/2026 | 10-K |
| 09/30/2025 | 11/07/2025 | 10-Q |
| 06/30/2025 | 08/08/2025 | 10-Q |
| 03/31/2025 | 05/09/2025 | 10-Q |
| 12/31/2024 | 02/14/2025 | 10-K |
| 09/30/2024 | 11/08/2024 | 10-Q |
| 06/30/2024 | 08/08/2024 | 10-Q |
| 03/31/2024 | 05/10/2024 | 10-Q |
| 12/31/2023 | 02/15/2024 | 10-K |
| 09/30/2023 | 11/02/2023 | 10-Q |
| 06/30/2023 | 08/03/2023 | 10-Q |
| 03/31/2023 | 05/04/2023 | 10-Q |
| 12/31/2022 | 02/09/2023 | 10-K |
| 09/30/2022 | 11/03/2022 | 10-Q |
| Report Date | Filing Date | Filing |
|---|---|---|
| 06/30/2026 | 08/07/2026 | 10-Q |
| 03/31/2026 | 05/08/2026 | 10-Q |
| 12/31/2025 | 02/13/2026 | 10-K |
| 09/30/2025 | 11/07/2025 | 10-Q |
| 06/30/2025 | 08/08/2025 | 10-Q |
| 03/31/2025 | 05/09/2025 | 10-Q |
| 12/31/2024 | 02/14/2025 | 10-K |
| 09/30/2024 | 11/08/2024 | 10-Q |
| 06/30/2024 | 08/08/2024 | 10-Q |
| 03/31/2024 | 05/10/2024 | 10-Q |
| 12/31/2023 | 02/15/2024 | 10-K |
| 09/30/2023 | 11/02/2023 | 10-Q |
| 06/30/2023 | 08/03/2023 | 10-Q |
| 03/31/2023 | 05/04/2023 | 10-Q |
| 12/31/2022 | 02/09/2023 | 10-K |
| 09/30/2022 | 11/03/2022 | 10-Q |
| 06/30/2022 | 08/04/2022 | 10-Q |
| 03/31/2022 | 05/09/2022 | 10-Q |
| 12/31/2021 | 02/11/2022 | 10-K |
| 09/30/2021 | 11/05/2021 | 10-Q |
| 06/30/2021 | 08/06/2021 | 10-Q |
| 03/31/2021 | 05/07/2021 | 10-Q |
| 12/31/2020 | 02/12/2021 | 10-K |
| 09/30/2020 | 11/05/2020 | 10-Q |
| 06/30/2020 | 09/16/2020 | 424B4 |
| 06/30/2019 | 08/24/2020 | S-1 |
Recent Forward Guidance
Updated 8/7/2026Latest: Q2 2026 Earnings Reported 8/6/2026
| Forward Guidance | Guidance Change | |||||||
|---|---|---|---|---|---|---|---|---|
| Metric | Source | Low | Mid | High | % Chg | % Delta | Change | Prior |
| Q3 2026 Revenue | Reported | 164.00 Mil | 165.00 Mil | 166.00 Mil | ||||
| Q3 2026 Non-GAAP Operating Income | Reported | 27.00 Mil | 28.00 Mil | 29.00 Mil | ||||
| Q3 2026 Non-GAAP EPS | Reported | 0.22 | 0.23 | 0.24 | ||||
| 2026 Revenue | Reported | 648.00 Mil | 650.00 Mil | 652.00 Mil | 3.2% | Raised | Guidance: 630.00 Mil for 2026 | |
| 2026 Non-GAAP Operating Income | Reported | 116.00 Mil | 118.00 Mil | 120.00 Mil | 3.5% | Raised | Guidance: 114.00 Mil for 2026 | |
| 2026 Non-GAAP EPS | Reported | 0.96 | 0.98 | 1 | 3.2% | Raised | Guidance: 0.95 for 2026 | |
Prior: Q1 2026 Earnings Reported 5/7/2026
| Forward Guidance | Guidance Change | |||||||
|---|---|---|---|---|---|---|---|---|
| Metric | Source | Low | Mid | High | % Chg | % Delta | Change | Prior |
| Q2 2026 Revenue | Reported | 154.00 Mil | 155.00 Mil | 156.00 Mil | ||||
| Q2 2026 Non-GAAP Operating Income | Reported | 28.00 Mil | 29.00 Mil | 30.00 Mil | ||||
| Q2 2026 Non-GAAP Net Income Per Diluted Share | Reported | 0.23 | 0.24 | 0.25 | ||||
| 2026 Revenue | Reported | 628.00 Mil | 630.00 Mil | 632.00 Mil | 0.7% | Raised | Guidance: 625.50 Mil for 2026 | |
| 2026 Non-GAAP Operating Income | Reported | 112.00 Mil | 114.00 Mil | 116.00 Mil | 6.5% | Raised | Guidance: 107.00 Mil for 2026 | |
| 2026 Non-GAAP Net Income Per Diluted Share | Reported | 0.93 | 0.95 | 0.97 | 5.6% | Raised | Guidance: 0.9 for 2026 | |
Q4 2025 Earnings Reported 2/12/2026
| Forward Guidance | Guidance Change | |||||||
|---|---|---|---|---|---|---|---|---|
| Metric | Source | Low | Mid | High | % Chg | % Delta | Change | Prior |
| Q1 2026 Revenue | Reported | 146.00 Mil | 147.00 Mil | 148.00 Mil | 6.9% | Higher New | Actual: 137.50 Mil for Q4 2025 | |
| Q1 2026 Non-GAAP Operating Income | Reported | 25.00 Mil | 25.50 Mil | 26.00 Mil | 18.6% | Higher New | Actual: 21.50 Mil for Q4 2025 | |
| Q1 2026 Non-GAAP Net Income Per Diluted Share | Reported | 0.2 | 0.21 | 0.22 | 10.5% | Higher New | Actual: 0.19 for Q4 2025 | |
| 2026 Revenue | Reported | 623.00 Mil | 625.50 Mil | 628.00 Mil | 19.4% | Higher New | Actual: 524.00 Mil for 2025 | |
| 2026 Non-GAAP Operating Income | Reported | 106.00 Mil | 107.00 Mil | 108.00 Mil | 21.9% | Higher New | Actual: 87.80 Mil for 2025 | |
| 2026 Non-GAAP Net Income Per Diluted Share | Reported | 0.88 | 0.9 | 0.92 | 13.9% | Higher New | Actual: 0.79 for 2025 | |
Q3 2025 Earnings Reported 11/6/2025
| Forward Guidance | Guidance Change | |||||||
|---|---|---|---|---|---|---|---|---|
| Metric | Source | Low | Mid | High | % Chg | % Delta | Change | Prior |
| Q4 2025 Revenue | Reported | 136.50 Mil | 137.50 Mil | 138.50 Mil | 7.4% | Higher New | Guidance: 128.00 Mil for Q3 2025 | |
| Q4 2025 Non-GAAP Operating Income | Reported | 21.00 Mil | 21.50 Mil | 22.00 Mil | 22.9% | Higher New | Guidance: 17.50 Mil for Q3 2025 | |
| Q4 2025 Non-GAAP Net Income Per Diluted Share | Reported | 0.18 | 0.19 | 0.2 | 18.8% | Higher New | Guidance: 0.16 for Q3 2025 | |
| 2025 Revenue | Reported | 523.00 Mil | 524.00 Mil | 525.00 Mil | 3.0% | Raised | Guidance: 508.50 Mil for 2025 | |
| 2025 Non-GAAP Operating Income | Reported | 87.30 Mil | 87.80 Mil | 88.30 Mil | 14.8% | Raised | Guidance: 76.50 Mil for 2025 | |
| 2025 Non-GAAP Net Income Per Diluted Share | Reported | 0.78 | 0.79 | 0.8 | 14.5% | Raised | Guidance: 0.69 for 2025 | |
Insider Activity
Updated 9/16/2026| # | Owner | Title | Holding | Action | Filing Date | Price | Shares | Transacted Value | Value of Held Shares | Form |
|---|---|---|---|---|---|---|---|---|---|---|
| 1 | Zwarenstein, Barry | Direct | Sell | 9162026 | 88.38 | 1,250 | 110,475 | 2,690,022 | Form | |
| 2 | Shlomi, Ben Haim | CHIEF EXECUTIVE OFFICER | Direct | Sell | 9102026 | 85.35 | 45,700 | 3,900,678 | 379,765,977 | Form |
| 3 | Notman, Tali | CHIEF REVENUE OFFICER | Direct | Sell | 9102026 | 86.98 | 18,794 | 1,634,660 | 58,160,120 | Form |
| 4 | Landman, Yoav | CHIEF TECHNOLOGY OFFICER | Direct | Sell | 9092026 | 89.27 | 45,000 | 4,016,997 | 460,083,470 | Form |
| 5 | Grabscheid, Eduard | CHIEF FINANCIAL OFFICER | Direct | Sell | 9042026 | 91.60 | 8,436 | 772,719 | 17,592,283 | Form |
| # | Owner | Title | Holding | Action | Filing Date | Price | Shares | Transacted Value | Value of Held Shares | Form |
|---|---|---|---|---|---|---|---|---|---|---|
| 1 | Zwarenstein, Barry | Direct | Sell | 9162026 | 88.38 | 1,250 | 110,475 | 2,690,022 | Form | |
| 2 | Shlomi, Ben Haim | CHIEF EXECUTIVE OFFICER | Direct | Sell | 9102026 | 85.35 | 45,700 | 3,900,678 | 379,765,977 | Form |
| 3 | Notman, Tali | CHIEF REVENUE OFFICER | Direct | Sell | 9102026 | 86.98 | 18,794 | 1,634,660 | 58,160,120 | Form |
| 4 | Landman, Yoav | CHIEF TECHNOLOGY OFFICER | Direct | Sell | 9092026 | 89.27 | 45,000 | 4,016,997 | 460,083,470 | Form |
| 5 | Grabscheid, Eduard | CHIEF FINANCIAL OFFICER | Direct | Sell | 9042026 | 91.60 | 8,436 | 772,719 | 17,592,283 | Form |
| 6 | Grabscheid, Eduard | CHIEF FINANCIAL OFFICER | Direct | Sell | 9042026 | 90.51 | 8,780 | 794,678 | 18,146,893 | Form |
| 7 | Notman, Tali | CHIEF REVENUE OFFICER | Direct | Sell | 9042026 | 90.51 | 19,157 | 1,733,900 | 62,223,091 | Form |
| 8 | Shlomi, Ben Haim | CHIEF EXECUTIVE OFFICER | Direct | Sell | 9032026 | 90.51 | 37,232 | 3,369,868 | 406,842,903 | Form |
| 9 | Simon, Frederic | Direct | Sell | 9032026 | 93.21 | 120,000 | 11,185,778 | 266,997,809 | Form | |
| 10 | Steele, Elisa | Direct | Sell | 9012026 | 103.41 | 554 | 57,289 | 2,455,988 | Form | |
| 11 | Landman, Yoav | CHIEF TECHNOLOGY OFFICER | Direct | Sell | 8312026 | 100.72 | 249,300 | 25,110,641 | 523,670,993 | Form |
| 12 | Simon, Frederic | Direct | Sell | 8172026 | 90.86 | 120,000 | 10,903,555 | 271,164,867 | Form | |
| 13 | Landman, Yoav | CHIEF TECHNOLOGY OFFICER | Direct | Sell | 8172026 | 90.86 | 45,000 | 4,088,726 | 495,039,103 | Form |
| 14 | Shlomi, Ben Haim | CHIEF EXECUTIVE OFFICER | Direct | Sell | 8112026 | 91.00 | 15,000 | 1,365,057 | 415,180,864 | Form |
| 15 | Zwarenstein, Barry | Direct | Sell | 7272026 | 80.10 | 1,250 | 100,125 | 2,538,129 | Form | |
| 16 | Sela, Yossi | Direct | Sell | 7202026 | 87.43 | 25,000 | 2,185,744 | 7,287,184 | Form | |
| 17 | Shlomi, Ben Haim | CHIEF EXECUTIVE OFFICER | Direct | Sell | 7102026 | 94.37 | 15,000 | 1,415,526 | 431,946,486 | Form |
| 18 | Landman, Yoav | CHIEF TECHNOLOGY OFFICER | Direct | Sell | 7092026 | 99.00 | 700 | 69,300 | 548,295,462 | Form |
| 19 | Shlomi, Ben Haim | CHIEF EXECUTIVE OFFICER | Direct | Sell | 7012026 | 90.03 | 65,999 | 5,941,890 | 413,439,097 | Form |
| 20 | Landman, Yoav | CHIEF TECHNOLOGY OFFICER | Direct | Sell | 7012026 | 89.99 | 150,000 | 13,498,500 | 498,458,030 | Form |
| 21 | Landman, Yoav | CHIEF TECHNOLOGY OFFICER | Direct | Sell | 6162026 | 78.11 | 45,000 | 3,514,800 | 444,351,824 | Form |
| 22 | Shlomi, Ben Haim | CHIEF EXECUTIVE OFFICER | Direct | Sell | 6102026 | 84.60 | 93,072 | 7,873,827 | 394,083,560 | Form |
| 23 | Zwarenstein, Barry | Direct | Sell | 6102026 | 84.35 | 1,250 | 105,438 | 2,778,236 | Form | |
| 24 | Notman, Tali | CHIEF REVENUE OFFICER | Direct | Sell | 6092026 | 83.95 | 22,015 | 1,848,247 | 59,324,334 | Form |
| 25 | Grabscheid, Eduard | CHIEF FINANCIAL OFFICER | Direct | Sell | 6042026 | 84.69 | 5,654 | 478,828 | 17,755,582 | Form |
| 26 | Grabscheid, Eduard | CHIEF FINANCIAL OFFICER | Direct | Sell | 6042026 | 86.54 | 9,484 | 820,745 | 18,633,100 | Form |
| 27 | Notman, Tali | CHIEF REVENUE OFFICER | Direct | Sell | 6042026 | 86.54 | 22,854 | 1,977,785 | 63,056,852 | Form |
| 28 | Shlomi, Ben Haim | CHIEF EXECUTIVE OFFICER | Direct | Sell | 6042026 | 86.54 | 43,056 | 3,726,066 | 411,178,194 | Form |
| 29 | Simon, Frederic | Direct | Sell | 6032026 | 85.84 | 120,000 | 10,300,767 | 276,775,422 | Form | |
| 30 | Landman, Yoav | CHIEF TECHNOLOGY OFFICER | Direct | Sell | 6032026 | 81.47 | 100,000 | 8,146,952 | 467,149,348 | Form |
| 31 | Shlomi, Ben Haim | CHIEF EXECUTIVE OFFICER | Direct | Sell | 6022026 | 75.02 | 51,237 | 3,843,800 | 359,673,187 | Form |
| 32 | Shlomi, Ben Haim | CHIEF EXECUTIVE OFFICER | Direct | Sell | 5282026 | 75.04 | 48,763 | 3,659,176 | 363,613,899 | Form |
| 33 | Wassenaar, Yvonne | Direct | Sell | 5222026 | 72.40 | 1,368 | 99,043 | 1,588,746 | Form | |
| 34 | Steele, Elisa | Direct | Sell | 5222026 | 72.40 | 684 | 49,522 | 1,759,610 | Form | |
| 35 | Simon, Frederic | Direct | Sell | 5182026 | 63.78 | 117,500 | 7,493,881 | 213,067,687 | Form | |
| 36 | Landman, Yoav | CHIEF TECHNOLOGY OFFICER | Direct | Sell | 5182026 | 64.22 | 75,000 | 4,816,295 | 369,469,961 | Form |
| 37 | Shlomi, Ben Haim | CHIEF EXECUTIVE OFFICER | Direct | Sell | 5082026 | 52.27 | 25,000 | 1,306,699 | 246,456,529 | Form |
| 38 | Zwarenstein, Barry | Direct | Sell | 5052026 | 49.00 | 1,250 | 61,250 | 1,458,240 | Form | |
| 39 | Landman, Yoav | CHIEF TECHNOLOGY OFFICER | Direct | Sell | 4142026 | 42.87 | 15,000 | 643,012 | 249,850,146 | Form |
| 40 | Shlomi, Ben Haim | CHIEF EXECUTIVE OFFICER | Direct | Sell | 4092026 | 48.88 | 25,000 | 1,221,886 | 231,681,761 | Form |
| 41 | Simon, Frederic | Direct | Sell | 4032026 | 50.35 | 25,000 | 1,258,750 | 174,124,700 | Form | |
| 42 | Simon, Frederic | Direct | Sell | 4032026 | 48.34 | 55,000 | 2,658,754 | 168,385,466 | Form | |
| 43 | Zwarenstein, Barry | Direct | Sell | 3302026 | 49.00 | 1,250 | 61,250 | 1,531,397 | Form | |
| 44 | Simon, Frederic | Direct | Sell | 3272026 | 48.17 | 9,600 | 462,432 | 170,439,237 | Form | |
| 45 | Grabscheid, Eduard | CHIEF FINANCIAL OFFICER | Direct | Sell | 3272026 | 45.00 | 9,043 | 406,935 | 10,115,820 | Form |
| 46 | Sela, Yossi | Direct | Sell | 3272026 | 45.20 | 25,000 | 1,130,000 | 4,697,274 | Form | |
| 47 | Shlomi, Ben Haim | CHIEF EXECUTIVE OFFICER | Direct | Sell | 3272026 | 45.07 | 25,000 | 1,126,750 | 214,769,772 | Form |
| 48 | Simon, Frederic | Direct | Sell | 3272026 | 46.10 | 10,400 | 479,400 | 163,543,899 | Form | |
| 49 | Shlomi, Ben Haim | CHIEF EXECUTIVE OFFICER | Direct | Sell | 3092026 | 41.50 | 25,363 | 1,052,661 | 198,813,495 | Form |
| 50 | Notman, Tali | CHIEF REVENUE OFFICER | Direct | Sell | 3092026 | 41.28 | 21,097 | 870,791 | 31,063,939 | Form |
| 51 | Simon, Frederic | Direct | Sell | 3042026 | 42.08 | 10,000 | 420,800 | 149,732,675 | Form | |
| 52 | Grabscheid, Eduard | CHIEF FINANCIAL OFFICER | Direct | Sell | 3042026 | 40.32 | 6,063 | 244,460 | 9,428,388 | Form |
| 53 | Notman, Tali | CHIEF REVENUE OFFICER | Direct | Sell | 3042026 | 4015.00 | 35,856 | 143,961,840 | 3,106,385,425 | Form |
| 54 | Shlomi, Ben Haim | CHIEF EXECUTIVE OFFICER | Direct | Sell | 3042026 | 40.15 | 71,841 | 2,884,416 | 193,346,822 | Form |
| 55 | Simon, Frederic | Direct | Sell | 3042026 | 40.18 | 25,000 | 1,004,500 | 143,373,731 | Form | |
| 56 | Grabscheid, Eduard | CHIEF FINANCIAL OFFICER | Direct | Sell | 3042026 | 40.15 | 15,639 | 627,906 | 9,632,065 | Form |
| 57 | Steele, Elisa | Direct | Sell | 2262026 | 34.79 | 684 | 23,796 | 715,317 | Form | |
| 58 | Wassenaar, Yvonne | Direct | Sell | 2262026 | 34.79 | 1,367 | 47,558 | 657,009 | Form | |
| 59 | Landman, Yoav | CHIEF TECHNOLOGY OFFICER | Direct | Sell | 2172026 | 55.86 | 30,000 | 1,675,800 | 326,414,391 | Form |
| 60 | Landman, Yoav | CHIEF TECHNOLOGY OFFICER | Direct | Sell | 2172026 | 53.19 | 15,000 | 797,794 | 312,386,089 | Form |
| 61 | Simon, Frederic | Direct | Sell | 2172026 | 53.20 | 67,500 | 3,590,730 | 191,148,442 | Form | |
| 62 | Shlomi, Ben Haim | CHIEF EXECUTIVE OFFICER | Direct | Sell | 2092026 | 51.92 | 25,000 | 1,298,058 | 246,210,086 | Form |
| 63 | Landman, Yoav | CHIEF TECHNOLOGY OFFICER | Direct | Sell | 1212026 | 57.71 | 45,000 | 2,596,950 | 338,679,230 | Form |
| 64 | Shlomi, Ben Haim | CHIEF EXECUTIVE OFFICER | Direct | Sell | 1092026 | 59.66 | 25,000 | 1,491,500 | 284,392,836 | Form |
| 65 | Simon, Frederic | Direct | Sell | 1062026 | 59.51 | 80,000 | 4,761,170 | 217,870,300 | Form | |
| 66 | Landman, Yoav | CHIEF TECHNOLOGY OFFICER | Direct | Sell | 12162025 | 68.79 | 45,000 | 3,095,756 | 406,826,383 | Form |
| 67 | Sela, Yossi | Direct | Sell | 12122025 | 70.00 | 25,000 | 1,750,000 | 9,041,550 | Form | |
| 68 | Landman, Yoav | CHIEF TECHNOLOGY OFFICER | Direct | Sell | 12122025 | 69.22 | 70,000 | 4,845,400 | 412,457,130 | Form |
| 69 | Notman, Tali | CHIEF REVENUE OFFICER | Direct | Sell | 12102025 | 64.80 | 13,357 | 865,582 | 40,912,134 | Form |
| 70 | Shlomi, Ben Haim | CHIEF EXECUTIVE OFFICER | Direct | Sell | 12092025 | 64.49 | 48,744 | 3,143,475 | 309,026,624 | Form |
| 71 | Sela, Yossi | Direct | Sell | 12092025 | 63.81 | 50,000 | 3,190,463 | 9,837,155 | Form | |
| 72 | Landman, Yoav | CHIEF TECHNOLOGY OFFICER | Direct | Sell | 12092025 | 64.98 | 50,000 | 3,249,000 | 391,741,092 | Form |
| 73 | Steele, Elisa | Direct | Sell | 12092025 | 63.43 | 5,460 | 346,327 | 1,362,982 | Form | |
| 74 | Grabscheid, Eduard | CHIEF FINANCIAL OFFICER | Direct | Sell | 12042025 | 60.80 | 3,439 | 209,091 | 7,847,699 | Form |
| 75 | Notman, Tali | CHIEF REVENUE OFFICER | Direct | Sell | 12042025 | 60.93 | 14,160 | 862,769 | 39,280,474 | Form |
| 76 | Shlomi, Ben Haim | CHIEF EXECUTIVE OFFICER | Direct | Sell | 12042025 | 60.93 | 28,515 | 1,737,419 | 294,940,012 | Form |
| 77 | Grabscheid, Eduard | CHIEF FINANCIAL OFFICER | Direct | Sell | 12042025 | 60.93 | 3,652 | 222,516 | 8,074,017 | Form |
| 78 | Simon, Frederic | Direct | Sell | 12042025 | 61.03 | 12,500 | 762,875 | 228,300,170 | Form | |
| 79 | Wassenaar, Yvonne | Direct | Sell | 12042025 | 60.09 | 1,368 | 82,203 | 1,349,141 | Form | |
| 80 | Landman, Yoav | CHIEF TECHNOLOGY OFFICER | Direct | Sell | 12032025 | 60.08 | 40,000 | 2,403,200 | 365,204,751 | Form |
| 81 | Simon, Frederic | Direct | Sell | 12012025 | 60.08 | 67,500 | 4,055,244 | 225,488,749 | Form | |
| 82 | Simon, Frederic | Direct | Sell | 11262025 | 61.76 | 80,000 | 4,940,562 | 238,862,952 | Form | |
| 83 | Vitus, Andrew L | See footnote | Sell | 11262025 | 62.17 | 5,982 | 371,901 | 315,451 | Form | |
| 84 | Simon, Frederic | Direct | Sell | 11122025 | 65.09 | 37,117 | 2,415,946 | 256,961,391 | Form | |
| 85 | Simon, Frederic | Direct | Sell | 11122025 | 58.84 | 100,000 | 5,883,599 | 234,455,729 | Form | |
| 86 | Shlomi, Ben Haim | CHIEF EXECUTIVE OFFICER | Direct | Sell | 11102025 | 46.01 | 15,000 | 690,115 | 224,018,348 | Form |
| 87 | Wassenaar, Yvonne | Direct | Sell | 10222025 | 47.94 | 1,372 | 65,774 | 1,404,978 | Form | |
| 88 | Simon, Frederic | Direct | Sell | 10162025 | 46.92 | 35,000 | 1,642,039 | 191,644,844 | Form | |
| 89 | Shlomi, Ben Haim | CHIEF EXECUTIVE OFFICER | Direct | Sell | 10092025 | 48.08 | 15,000 | 721,217 | 234,835,420 | Form |
| 90 | Notman, Tali | CHIEF REVENUE OFFICER | Direct | Sell | 10032025 | 47.20 | 1,693 | 79,913 | 31,098,654 | Form |
| 91 | Wassenaar, Yvonne | Direct | Sell | 10022025 | 49.90 | 1,372 | 68,463 | 1,530,882 | Form | |
| 92 | Simon, Frederic | Direct | Sell | 9112025 | 50.01 | 35,000 | 1,750,371 | 206,038,854 | Form | |
| 93 | Notman, Tali | CHIEF REVENUE OFFICER | Direct | Sell | 9102025 | 50.26 | 13,067 | 656,747 | 33,113,399 | Form |
| 94 | Shlomi, Ben Haim | CHIEF EXECUTIVE OFFICER | Direct | Sell | 9102025 | 50.32 | 38,159 | 1,920,131 | 246,539,574 | Form |
| 95 | Grabscheid, Eduard | CHIEF FINANCIAL OFFICER | Direct | Sell | 9042025 | 47.29 | 4,908 | 232,077 | 6,438,618 | Form |
| 96 | Grabscheid, Eduard | CHIEF FINANCIAL OFFICER | Direct | Sell | 9042025 | 47.78 | 2,695 | 128,767 | 6,740,468 | Form |
| 97 | Notman, Tali | CHIEF REVENUE OFFICER | Direct | Sell | 9042025 | 47.78 | 14,451 | 690,469 | 32,103,812 | Form |
| 98 | Shlomi, Ben Haim | CHIEF EXECUTIVE OFFICER | Direct | Sell | 9042025 | 47.78 | 29,101 | 1,390,446 | 235,904,720 | Form |
Investor Activity (13F)
Updated Sep 19, 2026Active managers (13F portfolio over $250M, at least 3 holdings) with a position over $5M that is either over 10% of their portfolio or held in a concentrated book of 50 or fewer total positions. Index/ETF, sovereign, bank, community-bank and charitable/donor-advised filers are excluded.
| Active Manager | Value | % of Portfolio | Total Positions | QoQ | Filing |
|---|---|---|---|---|---|
| Optimus Prime Fund Management Co., Ltd. | $220.6 Mil | 21.3% | 27 | Hold | 13F |
| Praesidium Investment Management Company, LLC | $47.6 Mil | 11.4% | 12 | TRIM -32.9% | 13F |
| Light Street Capital Management, LLC | $27.0 Mil | 5.4% | 23 | ADD +24.5% | 13F |
| Cypress Point Investment Management LP | $21.8 Mil | 5.1% | 32 | ADD +9.4% | 13F |
| Whale Rock Capital Management LLC | $282.5 Mil | 3.6% | 35 | ADD +13.6% | 13F |
| Dorsal Capital Management, LP | $54.0 Mil | 2.1% | 25 | New | 13F |
| Greenvale Capital LLP | $12.9 Mil | 1.4% | 12 | New | 13F |
| Kinetic Partners Management, LP | $21.1 Mil | 1.2% | 49 | TRIM -8.1% | 13F |
| Active Manager | Value | % of Portfolio | Total Positions | QoQ | Filing |
|---|---|---|---|---|---|
| Dorsal Capital Management, LP | $54.0 Mil | 2.1% | 25 | New | 13F |
| Greenvale Capital LLP | $12.9 Mil | 1.4% | 12 | New | 13F |
| Light Street Capital Management, LLC | $27.0 Mil | 5.4% | 23 | ADD +24.5% | 13F |
| Whale Rock Capital Management LLC | $282.5 Mil | 3.6% | 35 | ADD +13.6% | 13F |
| Cypress Point Investment Management LP | $21.8 Mil | 5.1% | 32 | ADD +9.4% | 13F |
| Active Manager | Value | % of Portfolio | Total Positions | QoQ | As Of | Filing |
|---|---|---|---|---|---|---|
| Anatole Investment Management Ltd | $86.6 Mil | 14.4% | 15 | Exited | Dec 31, 2025 | 13F |
| Grandeur Peak Global Advisors, LLC | $75.2 Mil | 10.1% | 102 | Exited | Dec 31, 2025 | 13F |
| Melqart Asset Management (UK) Ltd | $5.2 Mil | 0.5% | 44 | Exited | Dec 31, 2025 | 13F |
| Praesidium Investment Management Company, LLC | $47.6 Mil | 11.4% | 12 | TRIM -32.9% | Mar 31, 2026 | 13F |
| Kinetic Partners Management, LP | $21.1 Mil | 1.2% | 49 | TRIM -8.1% | Mar 31, 2026 | 13F |
| Active Manager | Value | % of Portfolio | Total Positions | QoQ | Filing |
|---|---|---|---|---|---|
| Whale Rock Capital Management LLC | $282.5 Mil | 3.6% | 35 | ADD +13.6% | 13F |
| Optimus Prime Fund Management Co., Ltd. | $220.6 Mil | 21.3% | 27 | Hold | 13F |
| Dorsal Capital Management, LP | $54.0 Mil | 2.1% | 25 | New | 13F |
| Praesidium Investment Management Company, LLC | $47.6 Mil | 11.4% | 12 | TRIM -32.9% | 13F |
| Light Street Capital Management, LLC | $27.0 Mil | 5.4% | 23 | ADD +24.5% | 13F |
| Cypress Point Investment Management LP | $21.8 Mil | 5.1% | 32 | ADD +9.4% | 13F |
| Kinetic Partners Management, LP | $21.1 Mil | 1.2% | 49 | TRIM -8.1% | 13F |
| Greenvale Capital LLP | $12.9 Mil | 1.4% | 12 | New | 13F |
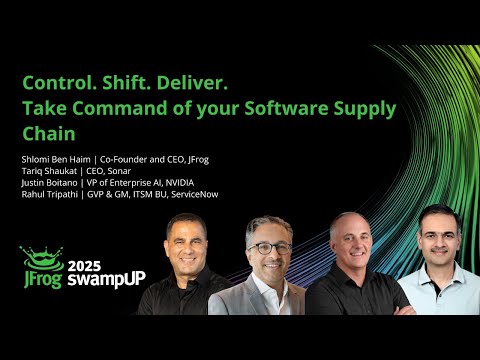
JFrog — Investor Video Playlist





Industry Resources
| Information Technology Resources |
| TechCrunch |
| Wired |
| CIO |
| MIT Technology Review |
| Gartner Insights |
| Ars Technica |
| Application Software Resources |
| Capterra |
| Software Advice |
| InfoWorld |
External Quote Links
| Y Finance | Barrons |
| TradingView | Morningstar |
| SeekingAlpha | ValueLine |
| Motley Fool | Robinhood |
| CNBC | Etrade |
| MarketWatch | Unusual Whales |
| YCharts | Perplexity Finance |
| FinViz |
Prefer one of these to Trefis? Tell us why.