
Microsoft (MSFT)
Market Price (9/19/2026): $493.885 | Market Cap: $3.7 TrilInvestor Relations Sector: Information Technology | Industry: Systems Software
Microsoft (MSFT)
Market Price (9/19/2026): $493.885Market Cap: $3.7 TrilSector: Information TechnologyIndustry: Systems Software
Investment Highlights Why It Matters Detailed financial logic regarding cash flow yields vs trend-riding momentum.
Attractive operating marginsOp Mgn LTMOperating Margin = Operating Income / Revenue Reflects profitability before taxes and before impact of capital structure (interest payments). is 47% Attractive cash flow generationCFO/Rev LTMCash Flow from Operations / Revenue (Sales), Last Twelve Months (LTM) is 55%, FCF/Rev LTMFree Cash Flow / Revenue (Sales), Last Twelve Months (LTM) is 20%, CFO LTM is 183 Bil, FCF LTM is 67 Bil Stock buyback supportStock Buyback 3Y Total is 58 Bil Low stock price volatilityVol 12M is 33% Megatrend and thematic driversMegatrends include Artificial Intelligence, Cloud Computing, Cybersecurity, Digital Content & Streaming, Show more. | Weak multi-year price returns2Y Excs Rtn is -19%, 3Y Excs Rtn is -21% | Key risksMSFT key risks include [1] sophisticated cyberattacks targeting its vast software and cloud ecosystem, Show more. |
| Attractive operating marginsOp Mgn LTMOperating Margin = Operating Income / Revenue Reflects profitability before taxes and before impact of capital structure (interest payments). is 47% |
| Attractive cash flow generationCFO/Rev LTMCash Flow from Operations / Revenue (Sales), Last Twelve Months (LTM) is 55%, FCF/Rev LTMFree Cash Flow / Revenue (Sales), Last Twelve Months (LTM) is 20%, CFO LTM is 183 Bil, FCF LTM is 67 Bil |
| Stock buyback supportStock Buyback 3Y Total is 58 Bil |
| Low stock price volatilityVol 12M is 33% |
| Megatrend and thematic driversMegatrends include Artificial Intelligence, Cloud Computing, Cybersecurity, Digital Content & Streaming, Show more. |
| Weak multi-year price returns2Y Excs Rtn is -19%, 3Y Excs Rtn is -21% |
| Key risksMSFT key risks include [1] sophisticated cyberattacks targeting its vast software and cloud ecosystem, Show more. |
Qualitative Assessment
AI Analysis | Feedback
Microsoft (MSFT) stock has gained about 10% since 5/31/2026 because of the following key factors:
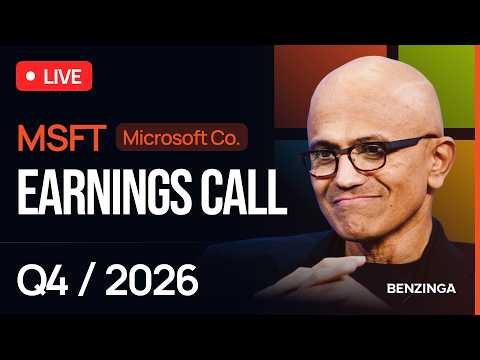
1. Robust Fiscal Q4 2026 Earnings Exceeded Expectations, Driven by Cloud and AI Growth. Microsoft reported strong financial results for its fiscal Q4 2026 (ending June 30, 2026) on July 29, 2026. The company posted diluted earnings per share (EPS) of $4.74, surpassing the consensus estimate of $4.24 by $0.50. Quarterly revenue increased by 17.7% year-over-year to $90.01 billion, exceeding analysts' expectations of $87.62 billion. This robust performance was significantly fueled by the strength of Microsoft Cloud and Artificial intelligence (AI), with Azure cloud-computing business revenue rising 43% in fiscal Q4 2026, outperforming the analyst consensus estimate of 39.98%.
2. Optimistic Fiscal Q1 2027 Outlook and Sustained AI Momentum. Microsoft provided an encouraging outlook for fiscal Q1 2027, forecasting a sales range with a midpoint of $90.4 billion, which exceeded analysts' estimates of $89.66 billion. The company projected Azure revenue growth to be approximately 45% in constant currency for fiscal Q1 2027. This positive forecast was supported by increasing adoption of its AI offerings, with paid Microsoft 365 Copilot seats now exceeding 30 million, and a significant contracted backlog in its cloud business reaching $678 billion, a sequential gain of approximately $50 billion. Furthermore, Microsoft highlighted efficiency gains in its AI operations, including up to 40% reductions in AI infrastructure costs.
Show more
Microsoft (MSFT) stock has gained about 10% since 5/31/2026 because of the following key factors:
1. Robust Fiscal Q4 2026 Earnings Exceeded Expectations, Driven by Cloud and AI Growth. Microsoft reported strong financial results for its fiscal Q4 2026 (ending June 30, 2026) on July 29, 2026. The company posted diluted earnings per share (EPS) of $4.74, surpassing the consensus estimate of $4.24 by $0.50. Quarterly revenue increased by 17.7% year-over-year to $90.01 billion, exceeding analysts' expectations of $87.62 billion. This robust performance was significantly fueled by the strength of Microsoft Cloud and Artificial intelligence (AI), with Azure cloud-computing business revenue rising 43% in fiscal Q4 2026, outperforming the analyst consensus estimate of 39.98%.
2. Optimistic Fiscal Q1 2027 Outlook and Sustained AI Momentum. Microsoft provided an encouraging outlook for fiscal Q1 2027, forecasting a sales range with a midpoint of $90.4 billion, which exceeded analysts' estimates of $89.66 billion. The company projected Azure revenue growth to be approximately 45% in constant currency for fiscal Q1 2027. This positive forecast was supported by increasing adoption of its AI offerings, with paid Microsoft 365 Copilot seats now exceeding 30 million, and a significant contracted backlog in its cloud business reaching $678 billion, a sequential gain of approximately $50 billion. Furthermore, Microsoft highlighted efficiency gains in its AI operations, including up to 40% reductions in AI infrastructure costs.
3. Positive Analyst Sentiment and Upgraded Price Targets. Wall Street analysts responded favorably to Microsoft's performance and future outlook during this period, reinforcing a bullish sentiment. Following the strong fiscal Q4 2026 results, Bank of America, for example, raised its price target for Microsoft's stock from $500 to $600. The consensus analyst rating for Microsoft shifted towards a "Strong Buy," with an average 12-month price target of $571.38, reflecting a projected upside from the stock's performance during the period. Several firms, including J.P. Morgan and Wells Fargo, reiterated "Buy" ratings and increased their price targets for MSFT shares throughout July and August 2026.
Show less
Stock Movement Drivers
Fundamental Drivers
The 9.9% change in MSFT stock from 5/31/2026 to 9/18/2026 was primarily driven by a 4.3% change in the company's Total Revenues ($ Mil).| (LTM values as of) | 5312026 | 9182026 | Change |
|---|---|---|---|
| Stock Price ($) | 449.39 | 493.78 | 9.9% |
| Change Contribution By: | |||
| Total Revenues ($ Mil) | 318,273 | 331,839 | 4.3% |
| Net Income Margin (%) | 39.3% | 40.3% | 2.4% |
| P/E Multiple | 26.7 | 27.4 | 2.9% |
| Shares Outstanding (Mil) | 7,426 | 7,426 | 0.0% |
| Cumulative Contribution | 9.9% |
Market Drivers
5/31/2026 to 9/18/2026| Return | Correlation | |
|---|---|---|
| MSFT | 9.9% | |
| Market (SPY) | 0.9% | 37.4% |
| Sector (XLK) | -0.7% | 19.3% |
Fundamental Drivers
The 26.2% change in MSFT stock from 2/28/2026 to 9/18/2026 was primarily driven by a 12.5% change in the company's P/E Multiple.| (LTM values as of) | 2282026 | 9182026 | Change |
|---|---|---|---|
| Stock Price ($) | 391.15 | 493.78 | 26.2% |
| Change Contribution By: | |||
| Total Revenues ($ Mil) | 305,453 | 331,839 | 8.6% |
| Net Income Margin (%) | 39.0% | 40.3% | 3.2% |
| P/E Multiple | 24.4 | 27.4 | 12.5% |
| Shares Outstanding (Mil) | 7,431 | 7,426 | 0.1% |
| Cumulative Contribution | 26.2% |
Market Drivers
2/28/2026 to 9/18/2026| Return | Correlation | |
|---|---|---|
| MSFT | 26.2% | |
| Market (SPY) | 11.6% | 35.7% |
| Sector (XLK) | 36.8% | 26.9% |
Fundamental Drivers
The -1.7% change in MSFT stock from 8/31/2025 to 9/18/2026 was primarily driven by a -25.2% change in the company's P/E Multiple.| (LTM values as of) | 8312025 | 9182026 | Change |
|---|---|---|---|
| Stock Price ($) | 502.56 | 493.78 | -1.7% |
| Change Contribution By: | |||
| Total Revenues ($ Mil) | 281,724 | 331,839 | 17.8% |
| Net Income Margin (%) | 36.1% | 40.3% | 11.5% |
| P/E Multiple | 36.7 | 27.4 | -25.2% |
| Shares Outstanding (Mil) | 7,430 | 7,426 | 0.1% |
| Cumulative Contribution | -1.7% |
Market Drivers
8/31/2025 to 9/18/2026| Return | Correlation | |
|---|---|---|
| MSFT | -1.7% | |
| Market (SPY) | 19.4% | 38.1% |
| Sector (XLK) | 45.1% | 34.5% |
Fundamental Drivers
The 54.2% change in MSFT stock from 8/31/2023 to 9/18/2026 was primarily driven by a 56.6% change in the company's Total Revenues ($ Mil).| (LTM values as of) | 8312023 | 9182026 | Change |
|---|---|---|---|
| Stock Price ($) | 320.26 | 493.78 | 54.2% |
| Change Contribution By: | |||
| Total Revenues ($ Mil) | 211,915 | 331,839 | 56.6% |
| Net Income Margin (%) | 34.1% | 40.3% | 18.0% |
| P/E Multiple | 32.9 | 27.4 | -16.7% |
| Shares Outstanding (Mil) | 7,434 | 7,426 | 0.1% |
| Cumulative Contribution | 54.2% |
Market Drivers
8/31/2023 to 9/18/2026| Return | Correlation | |
|---|---|---|
| MSFT | 54.2% | |
| Market (SPY) | 75.6% | 56.7% |
| Sector (XLK) | 119.9% | 57.1% |
Price Returns Compared
| 2021 | 2022 | 2023 | 2024 | 2025 | 2026 | Total [1] | |
|---|---|---|---|---|---|---|---|
| Returns | |||||||
| MSFT Return | 52% | -28% | 58% | 13% | 16% | 4% | 135% |
| Peers Return | 31% | -34% | 64% | 40% | 16% | 3% | 136% |
| S&P 500 Return | 27% | -19% | 24% | 23% | 16% | 12% | 103% |
Monthly Win Rates [3] | |||||||
| MSFT Win Rate | 75% | 25% | 67% | 58% | 42% | 44% | |
| Peers Win Rate | 63% | 28% | 67% | 65% | 53% | 47% | |
| S&P 500 Win Rate | 75% | 42% | 67% | 75% | 67% | 44% | |
Max Drawdowns [4] | |||||||
| MSFT Max Drawdown | -9% | -36% | -13% | -15% | -21% | -27% | |
| Peers Max Drawdown | -15% | -41% | -18% | -20% | -35% | -30% | |
| S&P 500 Max Drawdown | -5% | -25% | -10% | -8% | -19% | -9% | |
[1] Cumulative total returns since the beginning of 2021
[2] Peers: GOOGL, AMZN, AAPL, ORCL, CRM. See MSFT Returns vs. Peers.
[3] Win Rate = % of calendar months in which monthly returns were positive
[4] Max drawdown represents maximum peak-to-trough decline within a year
[5] 2026 data is for the year up to 9/18/2026 (YTD)
How Low Can It Go
| Event | MSFT | S&P 500 |
|---|---|---|
| 2025 US Tariff Shock | ||
| % Loss | -14.3% | -18.8% |
| % Gain to Breakeven | 16.7% | 23.1% |
| Time to Breakeven | 23 days | 79 days |
| 2024 Yen Carry Trade Unwind | ||
| % Loss | -15.2% | -7.8% |
| % Gain to Breakeven | 18.0% | 8.5% |
| Time to Breakeven | 302 days | 18 days |
| Summer-Fall 2023 Five Percent Yield Shock | ||
| % Loss | -10.9% | -9.5% |
| % Gain to Breakeven | 12.2% | 10.5% |
| Time to Breakeven | 38 days | 24 days |
| 2022 Inflation Shock & Fed Tightening | ||
| % Loss | -32.2% | -24.5% |
| % Gain to Breakeven | 47.5% | 32.4% |
| Time to Breakeven | 227 days | 427 days |
| 2020 COVID-19 Crash | ||
| % Loss | -27.7% | -33.7% |
| % Gain to Breakeven | 38.3% | 50.9% |
| Time to Breakeven | 81 days | 140 days |
| Q4 2018 Fed Policy Error / Growth Scare | ||
| % Loss | -17.9% | -19.2% |
| % Gain to Breakeven | 21.8% | 23.8% |
| Time to Breakeven | 79 days | 105 days |
In The Past
Microsoft's stock fell -14.3% during the 2025 US Tariff Shock. Such a loss loss requires a 16.7% gain to breakeven.
Preserve Wealth
Limiting losses and compounding gains is essential to preserving wealth.
Asset Allocation
Actively managed asset allocation strategies protect wealth. Learn more.
| Event | MSFT | S&P 500 |
|---|---|---|
| 2022 Inflation Shock & Fed Tightening | ||
| % Loss | -32.2% | -24.5% |
| % Gain to Breakeven | 47.5% | 32.4% |
| Time to Breakeven | 227 days | 427 days |
| 2020 COVID-19 Crash | ||
| % Loss | -27.7% | -33.7% |
| % Gain to Breakeven | 38.3% | 50.9% |
| Time to Breakeven | 81 days | 140 days |
| 2010 Eurozone Sovereign Debt Crisis / Flash Crash | ||
| % Loss | -25.7% | -15.4% |
| % Gain to Breakeven | 34.6% | 18.2% |
| Time to Breakeven | 581 days | 125 days |
| 2008-2009 Global Financial Crisis | ||
| % Loss | -57.6% | -53.4% |
| % Gain to Breakeven | 135.7% | 114.4% |
| Time to Breakeven | 1512 days | 1085 days |
In The Past
Microsoft's stock fell -14.3% during the 2025 US Tariff Shock. Such a loss loss requires a 16.7% gain to breakeven.
Preserve Wealth
Limiting losses and compounding gains is essential to preserving wealth.
Asset Allocation
Actively managed asset allocation strategies protect wealth. Learn more.
About Microsoft (MSFT)
Microsoft Corporation is a global technology leader that develops, licenses, and supports a comprehensive portfolio of software, services, devices, and solutions. The company serves a vast and diverse customer base, ranging from individual consumers and developers to small businesses, large enterprises, and government organizations worldwide. Its operations are broadly structured around enhancing productivity, providing intelligent cloud infrastructure, and powering personal computing experiences.
The company's core offerings include its ubiquitous Office suite (Word, Excel, PowerPoint), collaborative platforms like Microsoft Teams and LinkedIn, and business management software such as Dynamics 365, all aimed at boosting productivity and streamlining business processes. For developers and enterprises, Microsoft provides its powerful Azure cloud computing platform, robust server products like Windows Server and SQL Server, and GitHub, a leading platform for software development and collaboration.
In the realm of personal computing, Microsoft is responsible for the widely adopted Windows operating system, its line of Surface PCs and tablets, and the popular Xbox gaming consoles and services. Additionally, it operates search and advertising services like Bing. Through these diverse and interconnected offerings, Microsoft empowers individuals and organizations globally with essential technology infrastructure, innovative tools, and engaging consumer products.
AI Analysis | Feedback
- Imagine Amazon Web Services (AWS) for cloud computing, combined with the business software offerings of Google Workspace.
- Think of it as Apple, but with a much stronger focus on enterprise software and cloud services, and a major gaming console business like Sony PlayStation.
AI Analysis | Feedback
- Microsoft Office Suite: A collection of productivity applications like Word, Excel, PowerPoint, Outlook, and communication tools such as Teams.
- Microsoft Dynamics 365: A suite of cloud-based business applications for enterprise resource planning (ERP) and customer relationship management (CRM).
- Microsoft Azure: A comprehensive cloud computing platform offering a wide range of services including computing, analytics, storage, and networking.
- Windows Operating System: The widely used operating system for personal computers, servers, and IoT devices.
- Xbox: A brand of gaming consoles, games, and online services.
- Surface Devices: A line of personal computers, tablets, and accessories designed and manufactured by Microsoft.
- LinkedIn: A professional networking platform and employment-oriented service.
- GitHub: A web-based platform for version control and collaboration on software development projects using Git.
- Microsoft Servers & Developer Tools: Software products like SQL Server, Windows Server, and Visual Studio for businesses and developers.
- Bing & Microsoft Advertising: A web search engine and its associated advertising services.
- Microsoft Consulting & Support Services: Professional services including technical support, consulting, training, and certification for Microsoft products.
AI Analysis | Feedback
AI Analysis | Feedback
AI Analysis | Feedback
Satya Nadella, Chairman and Chief Executive Officer
Satya Nadella has been the Chief Executive Officer of Microsoft since February 2014 and was named Chairman in 2021. Before becoming CEO, he held leadership roles in both enterprise and consumer businesses at Microsoft, most recently as the executive vice president of Microsoft's Cloud and Enterprise group, where he led the transformation to the cloud infrastructure and services business. Prior to joining Microsoft in 1992, Nadella was a member of the technology staff at Sun Microsystems. During his tenure as CEO, Microsoft has made significant acquisitions, including LinkedIn in 2016 for $26.2 billion and GitHub in 2018 for $7.5 billion.
Amy Hood, Executive Vice President and Chief Financial Officer
Amy Hood has served as the executive vice president and chief financial officer of Microsoft since 2013, making her the first woman to hold this role in the company's history. She joined Microsoft in 2002, holding various positions in the investor relations group and as chief of staff in the Server and Tools Business, and running the strategy and business development team in the Business division. Before joining Microsoft, Hood worked at Goldman Sachs in investment banking and capital markets groups. As CFO, she has overseen over 57 deals, including the $7.5 billion acquisition of GitHub in 2018, and played a strategic role in shifting funding towards cloud computing.
Brad Smith, Vice Chair and President
Brad Smith became Vice Chair of Microsoft in 2021 and President in 2015. He joined Microsoft in 1993, first leading the legal and corporate affairs team in Europe, and was named General Counsel in 2002. Before joining Microsoft, Smith was an associate and then partner at the law firm of Covington & Burling.
Judson Althoff, Chief Executive Officer of Commercial Business
Judson Althoff is the Chief Executive Officer of Microsoft's commercial business. He joined Microsoft in March 2013 as president of Microsoft North America and has been responsible for the sales strategy, execution, and revenue growth of the company's commercial business. Under his leadership, Microsoft has achieved uninterrupted commercial cloud revenue growth. Prior to joining Microsoft, Althoff spent multiple years in senior sales roles at Oracle and EMC.
Scott Guthrie, Executive Vice President, Cloud + AI Group
Scott Guthrie is the Executive Vice President of the Microsoft Cloud + AI Group, a role he has held since February 2014. He is responsible for the company's cloud computing fabric, artificial intelligence platform, and developer tools, including Microsoft Azure. Guthrie joined Microsoft in 1997 and has been a key contributor to many of Microsoft's core cloud, server, and development technologies, including being one of the original founders of the .NET project.
AI Analysis | Feedback
Microsoft (MSFT) faces several key risks, primarily stemming from the intense competition across its diverse business segments, increasing regulatory scrutiny, and the operational and cybersecurity challenges inherent in its expansive cloud and AI investments.
- Intense Competition and High-Stakes AI Investments: Microsoft operates in "brutally competitive markets" across its cloud computing, productivity software, gaming, and device segments, facing strong rivals such as Amazon, Google, Salesforce, and Sony. While the company is making significant investments in artificial intelligence (AI), this presents "major uncertainty" due to the "significant costs" associated with building and maintaining AI infrastructure, including data centers and specialized chips. There is a risk that these "soaring capital expenditures" could lead to "margin contraction" in its Intelligent Cloud segment if demand for AI-driven products does not meet expectations or if intense competition drives down pricing power. Furthermore, Microsoft's legacy segments, particularly in More Personal Computing, face potential "stagnation and decline".
- Regulatory and Antitrust Scrutiny: Microsoft's dominant position in several software and cloud markets has attracted "antitrust scrutiny" and regulatory investigations globally. Regulators in various jurisdictions, including Japan, the UK, the EU, and the US, are examining allegations of anti-competitive practices, such as software licensing models that may unfairly favor its Azure cloud platform over competitors, and product bundling strategies. The rapid expansion into AI also introduces new regulatory risks concerning data privacy, intellectual property, security, and potential biases, which could lead to increased compliance costs, delayed product launches, or limitations on AI functionalities.
- Cybersecurity Threats and Cloud Operational Risks: As a leading provider of cloud services and software, Microsoft is a prime target for "cybersecurity threats" and data privacy breaches. Any substantial "outage or security breach" in its cloud services, such as Azure, could disrupt critical services for numerous clients worldwide and trigger "cascading risks" throughout the deeply interconnected digital ecosystem. The continuous operation of its massive cloud infrastructure is also capital-intensive and vulnerable to disruptions if there are challenges in "access to advanced semiconductors, energy availability, environmental and zoning approvals, and specialized talent".
AI Analysis | Feedback
Clear Emerging Threats to Microsoft (MSFT):
- Rise of Alternative Operating Systems: The increasing market penetration and adoption of operating systems like Google's Chrome OS, particularly in the education and budget-friendly PC markets, directly challenges Microsoft's dominance in Windows OEM licensing. Furthermore, Apple's macOS, especially with the performance advancements of Apple Silicon, continues to solidify its position as a compelling alternative to Windows for consumers and professionals, eroding Microsoft's market share in the premium PC segment. This trend poses a clear threat to Windows' foundational role and revenue.
- Proliferation of Best-of-Breed Specialized SaaS Solutions: While Microsoft offers comprehensive integrated suites (e.g., Office 365, Dynamics 365), there is an ongoing trend of enterprises adopting specialized, best-of-breed SaaS applications from various vendors for specific functions (e.g., Salesforce for CRM, Slack for communication, Zoom for video conferencing, Figma for design, Miro for collaboration). These specialized solutions often offer deeper features or more innovative user experiences within their niche, challenging the "all-in-one" appeal of Microsoft's offerings and potentially fragmenting its ecosystem. This can erode market share for individual components within Microsoft's productivity and business processes segments.
AI Analysis | Feedback
Here are the addressable market sizes for Microsoft's main products and services:
- Cloud Computing (Azure): The global cloud computing market was estimated at USD 752.44 billion in 2024 and is projected to reach USD 2,390.18 billion by 2030, growing at a compound annual growth rate (CAGR) of 20.4% from 2025 to 2030. Another estimate valued the global cloud computing market at USD 736.10 billion in 2024, with an anticipated CAGR of 20.8% from 2025 to 2034. The global cloud computing market size was also reported as USD 781.27 billion in 2025, with projections to reach USD 2,904.52 billion by 2034. North America held a significant share, accounting for 39.0% of the global cloud computing market in 2024 and 52.0% in 2025.
-
Business Applications (Dynamics 365):
- **Customer Relationship Management (CRM):** The global CRM market was valued at USD 74 billion in 2023 and is forecasted to reach USD 135 billion in 2029. More recent estimates put the global CRM market size at USD 112.91 billion in 2025, expected to grow to USD 262.74 billion by 2032. North America led the CRM market, with an estimated valuation of USD 35.75 billion in 2025.
- **Enterprise Resource Planning (ERP):** The global ERP market size is estimated at USD 73 billion in 2025. Other reports state the global ERP software market size was USD 59.42 billion in 2025, projected to increase to USD 116.54 billion by 2035, or USD 77.08 billion in 2025, projected to reach USD 157.07 billion by 2033. North America's ERP software market size reached USD 18.58 billion in 2025.
- PC Operating Systems (Windows): Windows holds over 68% of the global operating system market across desktops, tablets, and consoles as of July 2024. For desktop systems, Windows commanded a 71.72% market share in March 2025 and an 80% market share as of February 2026. In December 2025, Windows accounted for 29.99% of the global operating system market across all platforms.
- Gaming (Xbox): The global gaming market is estimated to generate revenues of $187.7 billion in 2024 and was valued at USD 261.1 billion in 2025. Projections indicate the global gaming market size will reach USD 505.17 billion by 2030. The global games market is also expected to reach $188.8 billion in 2025. The global PC and console games market is projected to reach $103.7 billion by 2028.
- Search Advertising (Bing): The global online search advertising market size is projected to grow from $200 billion in 2023 to $350 billion by 2032. It was estimated at USD 500.55 billion in 2024. Search advertising spend globally is expected to reach $253.2 billion in 2025. The Search Advertising market reached USD 168.94 billion in 2024 and is projected to hit USD 499.08 billion by 2032. North America is the leading market, representing approximately 38% of the global spend.
- Productivity Software (Office, Microsoft Teams, etc.): null
- Professional Networking (LinkedIn): null
AI Analysis | Feedback
Microsoft (MSFT) is expected to drive future revenue growth over the next 2-3 years through several key areas:
-
Expansion and Monetization of Artificial Intelligence (AI) across Products and Services: Microsoft anticipates significant revenue growth from the increasing integration and monetization of AI capabilities, particularly through Microsoft 365 Copilot and new AI workloads on Azure. Microsoft 365 Copilot has seen a surge in paid seats and is expected to drive Average Revenue Per User (ARPU) growth. CEO Satya Nadella has emphasized the transformative potential of AI as a generational tech shift, and the company is focusing on efficiency and innovation in this area.
-
Continued Strong Growth of Azure and the Intelligent Cloud Segment: Azure, Microsoft's cloud platform, remains a primary growth engine. The company expects sustained elevated Azure growth rates, driven by its core infrastructure business and the scaling of new cloud and AI workloads for its largest customers. Microsoft Cloud revenue has consistently grown, with commercial bookings surpassing $100 billion for the first time in fiscal 2025.
-
Increased Adoption and Expansion of Microsoft 365 Commercial Offerings: Beyond Copilot, the broader Microsoft 365 Commercial segment is projected to grow through continued E5 adoption and an expanding installed base across all customer segments, including small and medium businesses and frontline workers. The company's core annuity sales motions and healthy renewals are also contributing factors.
-
Growth in Windows OEM and Commercial Licensing driven by AI-enabled PCs: The "More Personal Computing" segment is expected to benefit from an improvement in Windows OEM licensing sales. The anticipated sale of hundreds of millions of AI-enabled laptops over the next few years is likely to drive demand for Windows licenses.
AI Analysis | Feedback
Share Repurchases
- Microsoft's board authorized a new share repurchase program of up to $60 billion in September 2024, replacing a prior $60 billion authorization and having no expiration date.
- Annual share repurchases were approximately $18.42 billion in 2025, $17.254 billion in 2024, and $22.245 billion in 2023.
Share Issuance
- Microsoft's issuance of common stock averaged 1.892 billion shares for fiscal years ending June 2021 to 2025.
- The company's issuance of common stock peaked at 2.056 billion shares in June 2025.
- The latest twelve-month issuance of common stock was 2.042 billion shares.
Outbound Investments
- Microsoft acquired Activision Blizzard for $68.7 billion (totaling $75.4 billion after regulatory review) in October 2023, significantly enhancing its gaming operations.
- In 2021, Microsoft acquired Nuance Communications, aiming to advance its capabilities in conversational AI and speech recognition.
- Microsoft acquired Fungible for $190 million in January 2023, primarily to augment Azure's networking and storage services.
Capital Expenditures
- Microsoft's annual capital expenditures were $64.551 billion in 2025, $44.477 billion in 2024, and $28.107 billion in 2023.
- The capital expenditures for Q4 2025 amounted to $29.9 billion, showing an 89.04% increase from the prior quarter.
- These significant capital expenditures are primarily focused on enhancing Azure's data center efficiency and performance, notably supported by strategic acquisitions.

Peer Outperformance in Systems Software
| Ticker | Name | Rev Growth 3Y Avg | P/E | 1Y | 3Y | 5Y | 5Y Gap |
|---|---|---|---|---|---|---|---|
| MSFT | Microsoft | 16.1% | 27.4x | -2.1% | 53.8% | 71.6% | — |
| FTNT | Fortinet | 14.7% | 58.7x | 109.7% | 181.0% | 183.5% | +112pp |
| CVLT | CommVault Systems | 15.8% | 87.5x | -26.0% | 111.2% | 95.2% | +24pp |
| Industry | Names | 1Y med | 3Y med | 5Y med | Top 3 by 5Y |
|---|---|---|---|---|---|
| Electronic Manufacturing Services | 9 | 52.1% | 181.3% | 268.8% | TTMI 801% · FLEX 705% · SANM 419% |
| Technology Distributors | 9 | 28.9% | 72.0% | 93.7% | CLMB 332% · AVT 193% · SNX 146% |
| Semiconductor Materials & Equipment | 26 | 89.8% | 82.2% | 93.2% | AXTI 784% · AEHR 741% · KLAC 402% |
| Communications Equipment | 36 | 16.8% | 84.8% | 75.0% | AAOI 1310% · LITE 990% · FEIM 981% |
| Electronic Components | 26 | 32.0% | 62.1% | 64.5% | CLS 3836% · BELFA 1302% · COHR 425% |
| Technology Hardware, Storage & Peripherals | 20 | 33.3% | 77.5% | 50.2% | DELL 1135% · STX 1090% · SMCI 949% |
| Semiconductors | 55 | 20.4% | 28.8% | 38.4% | POET 1815% · MU 1302% · NVDA 919% |
| Internet Services & Infrastructure | 6 | 7.4% | 46.2% | 23.4% | DOCN 58% · VRSN 41% · GDDY 35% |
| Electronic Equipment & Instruments | 26 | -13.1% | 6.0% | -11.4% | PI 216% · ACFN 114% · OSIS 112% |
| IT Consulting & Other Services | 28 | -24.5% | -19.3% | -28.5% | CHRN 537268% · APLD 1258% · TSSI 669% |
| Application Software | 122 | -30.3% | -16.0% | -46.5% | VIDA 176264% · INLX 5435% · PLTR 519% |
| Systems Software ← | 68 | -17.7% | 7.9% | -55.7% | QNC 457% · ZETA 379% · PANW 358% |
Latest Trefis Analyses
Research & Analysis
Invest in Strategies
Wealth Management
Peer Comparisons
| Peers to compare with: |
Financials
| Median | |
|---|---|
| Name | |
| Mkt Price | 294.92 |
| Mkt Cap | 3,666.8 |
| Rev LTM | 445,867 |
| Op Inc LTM | 147,628 |
| FCF LTM | 53,273 |
| FCF 3Y Avg | 60,263 |
| CFO LTM | 161,403 |
| CFO 3Y Avg | 130,164 |
Growth & Margins
| Median | |
|---|---|
| Name | |
| Rev Chg LTM | 15.8% |
| Rev Chg 3Y Avg | 13.0% |
| Rev Chg Q | 17.7% |
| QoQ Delta Rev Chg LTM | 4.3% |
| Op Inc Chg LTM | 20.8% |
| Op Inc Chg 3Y Avg | 25.6% |
| Op Mgn LTM | 33.1% |
| Op Mgn 3Y Avg | 31.9% |
| QoQ Delta Op Mgn LTM | 0.4% |
| CFO/Rev LTM | 35.8% |
| CFO/Rev 3Y Avg | 34.1% |
| FCF/Rev LTM | 20.2% |
| FCF/Rev 3Y Avg | 25.3% |
Valuation
| Median | |
|---|---|
| Name | |
| Mkt Cap | 3,666.8 |
| P/S | 9.5 |
| P/Op Inc | 28.8 |
| P/EBIT | 15.4 |
| P/E | 20.2 |
| P/CFO | 20.0 |
| Total Yield | 5.0% |
| Dividend Yield | 0.3% |
| FCF Yield 3Y Avg | 2.4% |
| D/E | 0.0 |
| Net D/E | 0.0 |
Returns
| Median | |
|---|---|
| Name | |
| 1M Rtn | 2.4% |
| 3M Rtn | 8.4% |
| 6M Rtn | 23.1% |
| 12M Rtn | 4.0% |
| 3Y Rtn | 69.1% |
| 1M Excs Rtn | 3.1% |
| 3M Excs Rtn | 6.4% |
| 6M Excs Rtn | 6.4% |
| 12M Excs Rtn | -11.6% |
| 3Y Excs Rtn | -8.5% |
Comparison Analyses
Segment Financials
Revenue by Segment| $ Mil | 2025 | 2024 | 2023 | 2022 | 2021 |
|---|---|---|---|---|---|
| Productivity and Business Processes | 120,810 | 106,820 | 94,151 | 63,364 | 53,915 |
| Intelligent Cloud | 106,265 | 87,464 | 72,944 | 74,965 | 59,728 |
| More Personal Computing | 54,649 | 50,838 | 44,820 | 59,941 | 54,445 |
| Total | 281,724 | 245,122 | 211,915 | 198,270 | 168,088 |
| $ Mil | 2025 | 2024 | 2023 | 2022 | 2021 |
|---|---|---|---|---|---|
| Productivity and Business Processes | 69,773 | 59,661 | 50,074 | 29,690 | 24,351 |
| Intelligent Cloud | 44,589 | 37,813 | 28,411 | 33,203 | 26,471 |
| More Personal Computing | 14,166 | 11,959 | 10,038 | 20,490 | 19,094 |
| Total | 128,528 | 109,433 | 88,523 | 83,383 | 69,916 |
Price Behavior
| Market Price | $493.78 | |
| Market Cap ($ Bil) | 3,666.8 | |
| First Trading Date | 03/13/1986 | |
| Distance from 52W High | -8.2% | |
| 50 Days | 200 Days | |
| DMA Price | $464.20 | $430.08 |
| DMA Trend | indeterminate | up |
| Distance from DMA | 6.4% | 14.8% |
| 3M | 1YR | |
| Volatility | 42.1% | 32.6% |
| Downside Capture | 17.55 | 113.44 |
| Upside Capture | 156.77 | 91.00 |
| Correlation (SPY) | 34.7% | 38.0% |
| 1M | 2M | 3M | 6M | 1Y | 3Y | |
|---|---|---|---|---|---|---|
| Beta | 1.30 | 1.99 | 1.18 | 0.92 | 0.94 | 0.97 |
| Up Beta | 1.70 | 3.88 | 2.28 | 1.15 | 1.00 | 0.96 |
| Down Beta | 2.40 | 1.42 | 0.99 | 0.66 | 0.75 | 0.89 |
| Up Capture | 144% | 246% | 111% | 110% | 85% | 98% |
| Bmk +ve Days | 10 | 21 | 32 | 68 | 138 | 427 |
| Stock +ve Days | 14 | 27 | 36 | 66 | 129 | 403 |
| Down Capture | 3% | 11% | 59% | 74% | 108% | 101% |
| Bmk -ve Days | 11 | 21 | 32 | 59 | 113 | 324 |
| Stock -ve Days | 7 | 15 | 28 | 61 | 122 | 348 |
[1] Upside and downside betas calculated using positive and negative benchmark daily returns respectively
Based On 1-Year Data
| Annualized Return | Annualized Volatility | Sharpe Ratio | Correlation with MSFT | |
|---|---|---|---|---|
| MSFT | -2.4% | 32.5% | -0.05 | - |
| Sector ETF (XLK) | 40.5% | 26.4% | 1.25 | 34.6% |
| Equity (SPY) | 16.9% | 12.9% | 0.94 | 38.0% |
| Gold (GLD) | 19.1% | 29.3% | 0.60 | 8.8% |
| Commodities (DBC) | 46.9% | 20.6% | 1.76 | -9.1% |
| Real Estate (VNQ) | 4.9% | 13.6% | 0.10 | -1.8% |
| Bitcoin (BTCUSD) | -34.5% | 43.9% | -0.84 | 29.0% |
Smart multi-asset allocation framework can stack odds in your favor. Learn How
Based On 5-Year Data
| Annualized Return | Annualized Volatility | Sharpe Ratio | Correlation with MSFT | |
|---|---|---|---|---|
| MSFT | 11.7% | 28.2% | 0.40 | - |
| Sector ETF (XLK) | 20.2% | 25.9% | 0.69 | 71.7% |
| Equity (SPY) | 12.9% | 17.2% | 0.57 | 68.9% |
| Gold (GLD) | 19.1% | 18.8% | 0.83 | 6.7% |
| Commodities (DBC) | 11.3% | 19.5% | 0.45 | 6.8% |
| Real Estate (VNQ) | 1.1% | 18.8% | -0.05 | 34.9% |
| Bitcoin (BTCUSD) | 11.2% | 52.5% | 0.39 | 32.7% |
Smart multi-asset allocation framework can stack odds in your favor. Learn How
Based On 10-Year Data
| Annualized Return | Annualized Volatility | Sharpe Ratio | Correlation with MSFT | |
|---|---|---|---|---|
| MSFT | 25.5% | 27.7% | 0.85 | - |
| Sector ETF (XLK) | 24.4% | 25.0% | 0.88 | 81.0% |
| Equity (SPY) | 15.1% | 18.0% | 0.72 | 76.0% |
| Gold (GLD) | 12.1% | 16.4% | 0.61 | 6.6% |
| Commodities (DBC) | 8.3% | 18.1% | 0.37 | 17.6% |
| Real Estate (VNQ) | 4.4% | 20.7% | 0.18 | 45.2% |
| Bitcoin (BTCUSD) | 61.7% | 66.1% | 1.02 | 21.3% |
Smart multi-asset allocation framework can stack odds in your favor. Learn How
Returns Analyses
Earnings Returns History
Updated 9/2/2026| Forward Returns | |||
|---|---|---|---|
| Earnings Date | 1D Returns | 5D Returns | 21D Returns |
| 7/29/2026 | 15.5% | 24.8% | 29.6% |
| 4/29/2026 | -3.9% | -2.5% | 6.3% |
| 1/28/2026 | -10.0% | -14.0% | -18.3% |
| 10/29/2025 | -2.9% | -6.4% | -10.0% |
| 7/30/2025 | 3.9% | 2.3% | -0.5% |
| 4/30/2025 | 7.6% | 9.6% | 16.7% |
| 1/29/2025 | -6.2% | -6.6% | -10.1% |
| 10/30/2024 | -6.1% | -2.9% | -1.9% |
| ... | |||
| SUMMARY STATS | |||
| # Positive | 11 | 12 | 13 |
| # Negative | 13 | 12 | 11 |
| Median Positive | 4.2% | 5.7% | 8.0% |
| Median Negative | -3.8% | -4.8% | -2.7% |
| Max Positive | 15.5% | 24.8% | 29.6% |
| Max Negative | -10.0% | -14.0% | -18.3% |
| Forward Returns | |||
|---|---|---|---|
| Earnings Date | 1D Returns | 5D Returns | 21D Returns |
| 7/29/2026 | 15.5% | 24.8% | 29.6% |
| 4/29/2026 | -3.9% | -2.5% | 6.3% |
| 1/28/2026 | -10.0% | -14.0% | -18.3% |
| 10/29/2025 | -2.9% | -6.4% | -10.0% |
| 7/30/2025 | 3.9% | 2.3% | -0.5% |
| 4/30/2025 | 7.6% | 9.6% | 16.7% |
| 1/29/2025 | -6.2% | -6.6% | -10.1% |
| 10/30/2024 | -6.1% | -2.9% | -1.9% |
| 7/30/2024 | -1.1% | -5.5% | -2.7% |
| 4/25/2024 | 1.8% | -0.3% | 8.0% |
| 1/30/2024 | -2.7% | -0.8% | 1.4% |
| 10/24/2023 | 3.1% | 2.3% | 14.5% |
| 7/25/2023 | -3.8% | -4.2% | -6.6% |
| 4/25/2023 | 7.2% | 10.9% | 14.2% |
| 1/24/2023 | -0.6% | 2.4% | 5.5% |
| 10/25/2022 | -7.7% | -9.0% | -1.0% |
| 7/26/2022 | 6.7% | 9.1% | 9.7% |
| 4/26/2022 | 4.8% | 4.3% | -2.6% |
| 1/25/2022 | 2.8% | 7.0% | 2.3% |
| 10/26/2021 | 4.2% | 7.4% | 9.2% |
| 7/27/2021 | -0.1% | 0.2% | 5.6% |
| 4/27/2021 | -2.8% | -5.4% | -3.8% |
| 1/26/2021 | 0.2% | 3.1% | -1.2% |
| 10/27/2020 | -5.0% | -3.2% | 0.6% |
| SUMMARY STATS | |||
| # Positive | 11 | 12 | 13 |
| # Negative | 13 | 12 | 11 |
| Median Positive | 4.2% | 5.7% | 8.0% |
| Median Negative | -3.8% | -4.8% | -2.7% |
| Max Positive | 15.5% | 24.8% | 29.6% |
| Max Negative | -10.0% | -14.0% | -18.3% |
SEC Filings
Expand for More| Report Date | Filing Date | Filing |
|---|---|---|
| 06/30/2026 | 07/29/2026 | 10-K |
| 03/31/2026 | 04/29/2026 | 10-Q |
| 12/31/2025 | 01/28/2026 | 10-Q |
| 09/30/2025 | 10/29/2025 | 10-Q |
| 06/30/2025 | 07/30/2025 | 10-K |
| 03/31/2025 | 04/30/2025 | 10-Q |
| 12/31/2024 | 01/29/2025 | 10-Q |
| 09/30/2024 | 10/30/2024 | 10-Q |
| 06/30/2024 | 07/30/2024 | 10-K |
| 03/31/2024 | 04/25/2024 | 10-Q |
| 12/31/2023 | 01/30/2024 | 10-Q |
| 09/30/2023 | 10/24/2023 | 10-Q |
| 06/30/2023 | 07/27/2023 | 10-K |
| 03/31/2023 | 04/25/2023 | 10-Q |
| 12/31/2022 | 01/24/2023 | 10-Q |
| 09/30/2022 | 10/25/2022 | 10-Q |
| Report Date | Filing Date | Filing |
|---|---|---|
| 06/30/2026 | 07/29/2026 | 10-K |
| 03/31/2026 | 04/29/2026 | 10-Q |
| 12/31/2025 | 01/28/2026 | 10-Q |
| 09/30/2025 | 10/29/2025 | 10-Q |
| 06/30/2025 | 07/30/2025 | 10-K |
| 03/31/2025 | 04/30/2025 | 10-Q |
| 12/31/2024 | 01/29/2025 | 10-Q |
| 09/30/2024 | 10/30/2024 | 10-Q |
| 06/30/2024 | 07/30/2024 | 10-K |
| 03/31/2024 | 04/25/2024 | 10-Q |
| 12/31/2023 | 01/30/2024 | 10-Q |
| 09/30/2023 | 10/24/2023 | 10-Q |
| 06/30/2023 | 07/27/2023 | 10-K |
| 03/31/2023 | 04/25/2023 | 10-Q |
| 12/31/2022 | 01/24/2023 | 10-Q |
| 09/30/2022 | 10/25/2022 | 10-Q |
| 06/30/2022 | 07/28/2022 | 10-K |
| 03/31/2022 | 04/26/2022 | 10-Q |
| 12/31/2021 | 01/25/2022 | 10-Q |
| 09/30/2021 | 10/26/2021 | 10-Q |
| 06/30/2021 | 07/29/2021 | 10-K |
| 03/31/2021 | 04/27/2021 | 10-Q |
| 12/31/2020 | 01/26/2021 | 10-Q |
| 09/30/2020 | 10/27/2020 | 10-Q |
| 06/30/2020 | 07/31/2020 | 10-K |
| 03/31/2020 | 04/29/2020 | 10-Q |
| 12/31/2019 | 01/29/2020 | 10-Q |
| 09/30/2019 | 10/23/2019 | 10-Q |
Insider Activity
Updated 9/17/2026| # | Owner | Title | Holding | Action | Filing Date | Price | Shares | Transacted Value | Value of Held Shares | Form |
|---|---|---|---|---|---|---|---|---|---|---|
| 1 | Hood, Amy | EVP, Chief Financial Officer | Direct | Sell | 9152026 | 498.27 | 41,674 | 20,764,845 | 265,888,282 | Form |
| 2 | Nadella, Satya | Chief Executive Officer | Direct | Sell | 9022026 | 501.46 | 86,525 | 43,388,532 | 244,090,286 | Form |
| 3 | Numoto, Takeshi | EVP, Chief Marketing Officer | Direct | Sell | 8052026 | 496.48 | 4,810 | 2,388,244 | 21,188,500 | Form |
| 4 | Numoto, Takeshi | EVP, Chief Marketing Officer | Direct | Sell | 6122026 | 402.84 | 4,500 | 1,812,780 | 19,121,912 | Form |
| 5 | Numoto, Takeshi | EVP, Chief Marketing Officer | Direct | Sell | 6102026 | 412.45 | 2,500 | 1,031,125 | 21,434,102 | Form |
| # | Owner | Title | Holding | Action | Filing Date | Price | Shares | Transacted Value | Value of Held Shares | Form |
|---|---|---|---|---|---|---|---|---|---|---|
| 1 | Hood, Amy | EVP, Chief Financial Officer | Direct | Sell | 9152026 | 498.27 | 41,674 | 20,764,845 | 265,888,282 | Form |
| 2 | Nadella, Satya | Chief Executive Officer | Direct | Sell | 9022026 | 501.46 | 86,525 | 43,388,532 | 244,090,286 | Form |
| 3 | Numoto, Takeshi | EVP, Chief Marketing Officer | Direct | Sell | 8052026 | 496.48 | 4,810 | 2,388,244 | 21,188,500 | Form |
| 4 | Numoto, Takeshi | EVP, Chief Marketing Officer | Direct | Sell | 6122026 | 402.84 | 4,500 | 1,812,780 | 19,121,912 | Form |
| 5 | Numoto, Takeshi | EVP, Chief Marketing Officer | Direct | Sell | 6102026 | 412.45 | 2,500 | 1,031,125 | 21,434,102 | Form |
| 6 | Althoff, Judson | CEO Microsoft Commercial | Direct | Sell | 6022026 | 460.99 | 15,500 | 7,145,314 | 50,928,771 | Form |
| 7 | Coleman, Amy | EVP, Chief Human Resources Off | Direct | Sell | 5182026 | 411.34 | 1,262 | 519,242 | 18,923,122 | Form |
| 8 | Hogan, Kathleen T | EVP, Strategy | Direct | Sell | 3092026 | 409.52 | 12,321 | 5,045,643 | 56,486,362 | Form |
| 9 | Stanton, John W | Direct | Buy | 2182026 | 397.35 | 5,000 | 1,986,750 | 33,339,652 | Form | |
| 10 | Smith, Bradford L | Vice Chair and President | Direct | Sell | 12122025 | 438.82 | 3,812 | 1,672,781 | 198,169,556 | Form |
| 11 | Smith, Bradford L | Vice Chair and President | Direct | Sell | 12122025 | 390.57 | 30 | 11,717 | 177,870,321 | Form |
| 12 | Smith, Bradford L | Vice Chair and President | Direct | Buy | 12122025 | 377.46 | 3,842 | 1,450,221 | 171,912,193 | Form |
| 13 | Numoto, Takeshi | EVP, Chief Marketing Officer | Direct | Sell | 12052025 | 478.72 | 2,850 | 1,364,352 | 26,703,825 | Form |
| 14 | Althoff, Judson | CEO Microsoft Commercial | Direct | Sell | 12032025 | 491.52 | 12,750 | 6,266,829 | 63,576,946 | Form |
| 15 | Smith, Bradford L | Vice Chair and President | Direct | Sell | 11042025 | 518.64 | 38,500 | 19,967,707 | 239,403,350 | Form |
| 16 | Nadella, Satya | Chief Executive Officer | Direct | Sell | 9042025 | 504.78 | 149,205 | 75,315,121 | 399,203,394 | Form |
Investor Activity (13F)
Updated Sep 19, 2026Active managers (13F portfolio over $250M, at least 3 holdings) with a position over $5M that is either over 10% of their portfolio or held in a concentrated book of 50 or fewer total positions. Index/ETF, sovereign, bank, community-bank and charitable/donor-advised filers are excluded.
| Active Manager | Value | % of Portfolio | Total Positions | QoQ | Filing |
|---|---|---|---|---|---|
| Joho Capital LLC | $114.1 Mil | 30.6% | 10 | TRIM -14.2% | 13F |
| DDD Partners, LLC | $426.7 Mil | 29.6% | 134 | Hold | 13F |
| Elite Wealth Management, Inc. | $87.5 Mil | 28.4% | 49 | Hold | 13F |
| Armstrong Henry H Associates Inc | $232.6 Mil | 23.7% | 62 | Hold | 13F |
| Marathon Trading Investment Management LLC | $76.1 Mil | 22.6% | 192 | New | 13F |
| Palidye Holdings (Caymans) Ltd | $114.2 Mil | 21.2% | 15 | Hold | 13F |
| Union Bancaire Privee, UBP SA | $1.5 Bil | 20.5% | 487 | Hold | 13F |
| Ulysses Management LLC | $52.3 Mil | 19.7% | 28 | Hold | 13F |
| Crake Asset Management LLP | $541.0 Mil | 18.9% | 20 | ADD +21.1% | 13F |
| C Partners Holding GmbH | $57.5 Mil | 18.2% | 7 | Hold | 13F |
| Fortis Capital Management LLC | $132.7 Mil | 17.7% | 206 | ADD +13.4% | 13F |
| Meritage Group LP | $470.3 Mil | 17.7% | 13 | Hold | 13F |
| Skandinaviska Enskilda Banken AB (publ) | $763.0 Mil | 17.6% | 346 | New | 13F |
| Milestones Administradora de Recursos Ltda. | $66.4 Mil | 17.3% | 17 | ADD +104.6% | 13F |
| Altarock Partners LP | $691.3 Mil | 16.8% | 8 | TRIM -10.3% | 13F |
| Voyager Global Management LP | $490.5 Mil | 16.7% | 8 | ADD +29.3% | 13F |
| Pershing Square Capital Management, L.P. | $2.1 Bil | 15.3% | 11 | New | 13F |
| First Foundation Advisors | $369.9 Mil | 14.9% | 572 | Hold | 13F |
| Generation Investment Management LLP | $1.7 Bil | 14.8% | 29 | ADD +8.3% | 13F |
| Metropolis Capital Ltd | $435.8 Mil | 14.7% | 16 | ADD +40.4% | 13F |
| Cat Rock Capital Management LP | $92.1 Mil | 14.3% | 14 | ADD +19.7% | 13F |
| Delta Asset Management Llc/Tn | $153.9 Mil | 14.0% | 597 | Hold | 13F |
| Standard Investments LLC | $229.5 Mil | 13.5% | 11 | New | 13F |
| Brighton Jones LLC | $312.2 Mil | 13.2% | 24 | ADD +14.3% | 13F |
| SRB Corp | $213.1 Mil | 13.1% | 44 | TRIM -16.9% | 13F |
| Active Manager | Value | % of Portfolio | Total Positions | QoQ | Filing |
|---|---|---|---|---|---|
| Pershing Square Capital Management, L.P. | $2.1 Bil | 15.3% | 11 | New | 13F |
| Skandinaviska Enskilda Banken AB (publ) | $763.0 Mil | 17.6% | 346 | New | 13F |
| DSM Capital Partners LLC | $570.8 Mil | 10.1% | 44 | New | 13F |
| Caxton Associates LLP | $479.2 Mil | 11.1% | 752 | New | 13F |
| Vulcan Value Partners, LLC | $410.5 Mil | 10.9% | 33 | New | 13F |
| Consulta Ltd | $249.9 Mil | 12.4% | 13 | New | 13F |
| Standard Investments LLC | $229.5 Mil | 13.5% | 11 | New | 13F |
| Harvard Management Co Inc | $189.9 Mil | 10.5% | 17 | New | 13F |
| Jia Investment Alliance PTE. LTD. | $95.6 Mil | 10.0% | 24 | New | 13F |
| Marathon Trading Investment Management LLC | $76.1 Mil | 22.6% | 192 | New | 13F |
| Unio Capital LLC | $44.8 Mil | 9.6% | 21 | New | 13F |
| Pennant Investors, LP | $36.8 Mil | 10.2% | 17 | New | 13F |
| Spinecap SAS | $31.3 Mil | 11.5% | 15 | New | 13F |
| Vienna Powszechne Towarzystwo Emerytalne S.A. Vienna Insurance Group | $28.3 Mil | 10.8% | 28 | New | 13F |
| Milestones Administradora de Recursos Ltda. | $66.4 Mil | 17.3% | 17 | ADD +104.6% | 13F |
| Metropolis Capital Ltd | $435.8 Mil | 14.7% | 16 | ADD +40.4% | 13F |
| Voyager Global Management LP | $490.5 Mil | 16.7% | 8 | ADD +29.3% | 13F |
| Crake Asset Management LLP | $541.0 Mil | 18.9% | 20 | ADD +21.1% | 13F |
| Proem Advisors LLC | $33.3 Mil | 11.0% | 29 | ADD +20.0% | 13F |
| Cat Rock Capital Management LP | $92.1 Mil | 14.3% | 14 | ADD +19.7% | 13F |
| Cryder Capital Partners LLP | $177.2 Mil | 11.6% | 10 | ADD +15.4% | 13F |
| Brighton Jones LLC | $312.2 Mil | 13.2% | 24 | ADD +14.3% | 13F |
| Fortis Capital Management LLC | $132.7 Mil | 17.7% | 206 | ADD +13.4% | 13F |
| Spear Holdings RSC Ltd | $104.6 Mil | 11.2% | 17 | ADD +10.1% | 13F |
| PBCay One RSC Ltd | $104.6 Mil | 11.2% | 17 | ADD +10.1% | 13F |
| Active Manager | Value | % of Portfolio | Total Positions | QoQ | As Of | Filing |
|---|---|---|---|---|---|---|
| TCI Fund Management LTD | $8.1 Bil | 15.1% | 9 | Exited | Dec 31, 2025 | 13F |
| BlueSpruce Investments, LP | $717.0 Mil | 18.3% | 9 | Exited | Dec 31, 2025 | 13F |
| Cable Car Capital, LP | $703.8 Mil | 43.7% | 107 | Exited | Dec 31, 2025 | 13F |
| Ursa Fund Management, LLC | $646.8 Mil | 55.7% | 22 | Exited | Dec 31, 2025 | 13F |
| Banque Transatlantique SA | $519.0 Mil | 12.6% | 278 | Exited | Dec 31, 2025 | 13F |
| Sherman Porfolios, LLC | $203.7 Mil | 13.9% | 156 | Exited | Dec 31, 2025 | 13F |
| Elequin Capital, LP | $120.9 Mil | 15.8% | 392 | Exited | Dec 31, 2025 | 13F |
| Wahed Invest LLC | $94.5 Mil | 12.4% | 213 | Exited | Dec 31, 2025 | 13F |
| JBF Capital, Inc. | $82.1 Mil | 11.9% | 76 | Exited | Dec 31, 2025 | 13F |
| Cypress Funds LLC | $76.5 Mil | 12.7% | 14 | Exited | Dec 31, 2025 | 13F |
| M & L Capital Management Ltd | $72.6 Mil | 15.1% | 25 | Exited | Dec 31, 2025 | 13F |
| Criteria Caixa, S.A.U. | $72.3 Mil | 24.9% | 8 | Exited | Dec 31, 2025 | 13F |
| Agave Capital Management Ltd | $70.8 Mil | 11.8% | 23 | Exited | Dec 31, 2025 | 13F |
| Coalescence Partners Investment Management, LP | $59.0 Mil | 13.9% | 12 | Exited | Dec 31, 2025 | 13F |
| SRB Corp | $213.1 Mil | 13.1% | 44 | TRIM -16.9% | Mar 31, 2026 | 13F |
| Joho Capital LLC | $114.1 Mil | 30.6% | 10 | TRIM -14.2% | Mar 31, 2026 | 13F |
| Altarock Partners LP | $691.3 Mil | 16.8% | 8 | TRIM -10.3% | Mar 31, 2026 | 13F |
| BSN CAPITAL PARTNERS Ltd | $253.1 Mil | 11.9% | 41 | TRIM -8.0% | Mar 31, 2026 | 13F |
| Soroban Capital Partners LP | $1.3 Bil | 9.5% | 27 | TRIM -7.8% | Mar 31, 2026 | 13F |
| Active Manager | Value | % of Portfolio | Total Positions | QoQ | Filing |
|---|---|---|---|---|---|
| Pershing Square Capital Management, L.P. | $2.1 Bil | 15.3% | 11 | New | 13F |
| Generation Investment Management LLP | $1.7 Bil | 14.8% | 29 | ADD +8.3% | 13F |
| Union Bancaire Privee, UBP SA | $1.5 Bil | 20.5% | 487 | Hold | 13F |
| Soroban Capital Partners LP | $1.3 Bil | 9.5% | 27 | TRIM -7.8% | 13F |
| Skandinaviska Enskilda Banken AB (publ) | $763.0 Mil | 17.6% | 346 | New | 13F |
| Altarock Partners LP | $691.3 Mil | 16.8% | 8 | TRIM -10.3% | 13F |
| DSM Capital Partners LLC | $570.8 Mil | 10.1% | 44 | New | 13F |
| Crake Asset Management LLP | $541.0 Mil | 18.9% | 20 | ADD +21.1% | 13F |
| Voyager Global Management LP | $490.5 Mil | 16.7% | 8 | ADD +29.3% | 13F |
| Caxton Associates LLP | $479.2 Mil | 11.1% | 752 | New | 13F |
| Meritage Group LP | $470.3 Mil | 17.7% | 13 | Hold | 13F |
| Metropolis Capital Ltd | $435.8 Mil | 14.7% | 16 | ADD +40.4% | 13F |
| DDD Partners, LLC | $426.7 Mil | 29.6% | 134 | Hold | 13F |
| Vulcan Value Partners, LLC | $410.5 Mil | 10.9% | 33 | New | 13F |
| First Foundation Advisors | $369.9 Mil | 14.9% | 572 | Hold | 13F |
| Brighton Jones LLC | $312.2 Mil | 13.2% | 24 | ADD +14.3% | 13F |
| BSN CAPITAL PARTNERS Ltd | $253.1 Mil | 11.9% | 41 | TRIM -8.0% | 13F |
| Consulta Ltd | $249.9 Mil | 12.4% | 13 | New | 13F |
| Armstrong Henry H Associates Inc | $232.6 Mil | 23.7% | 62 | Hold | 13F |
| Standard Investments LLC | $229.5 Mil | 13.5% | 11 | New | 13F |
| SRB Corp | $213.1 Mil | 13.1% | 44 | TRIM -16.9% | 13F |
| Harvard Management Co Inc | $189.9 Mil | 10.5% | 17 | New | 13F |
| Cryder Capital Partners LLP | $177.2 Mil | 11.6% | 10 | ADD +15.4% | 13F |
| Quintet Private Bank (Europe) S.A. | $164.0 Mil | 11.0% | 187 | Hold | 13F |
| Delta Asset Management Llc/Tn | $153.9 Mil | 14.0% | 597 | Hold | 13F |
MSFT Trade Sentinel
Constructive
CONVICTION RATIONALE
Conviction is constructive based on powerful leading indicators of demand. The company's commercial backlog grew 84% to $678 billion, while Azure revenue growth accelerated to 41%. This suggests the company's massive infrastructure investment is meeting pre-sold demand, justifying the guided near-term pressure on operating margins.
STOCK ARCHETYPE
Hybrid Platform (Subscription + Consumption)(Number of Commercial Seats * Price per Seat) + (Volume of Cloud & AI Consumption * Price per Unit) + (Hardware & Ad-hoc Revenue) Operating leverage from scaling the global cloud infrastructure and selling high-margin, AI-infused software subscriptions (like Microsoft 365 E7) on top of that infrastructure.
INVESTMENT THESIS
Evidence suggests yes, as accelerating demand in Azure and Copilot is validating the company's aggressive investment in data center capacity.
- Commercial remaining performance obligation increased 84% to $678 billion.
- Azure and other cloud services revenue growth accelerated to 41% in the latest quarter.
- The company has over 30 million paid Microsoft 365 Copilot seats, with net adds doubling QoQ.
- Management guides for double-digit revenue and operating income growth in fiscal year 2027.
PRIMARY RISK
The primary risk is that the AI infrastructure arms race leads to structurally lower margins, as capital expenditures of 34.9% of revenue may not generate commensurate returns amid intense competition.
- Management expects full fiscal year 2027 operating margins to be down less than 1 point.
- Capital expenditure is 34.9% of trailing-twelve-month revenue.
- Inventory grew 48.9% year-over-year, significantly outpacing 17.7% revenue growth.
- The IRS is seeking an additional tax payment of $28.9 billion plus penalties and interest.
| KPI | Status | Rationale |
|---|---|---|
| Azure and other cloud services revenue growth | 41% year-over-year growth for the quarter ended June 30, 2026 - Accelerating | Azure's growth trajectory is strengthening, with management noting in its latest earnings call that customer demand continues to exceed available capacity. The acceleration is attributed to strong demand for AI services and efficiency gains that allowed the company to monetize additional capacity during the quarter. |
| Microsoft 365 Copilot paid seats | Over 30 million paid seats as of the quarter ended June 30, 2026 - Accelerating | The adoption of Microsoft's flagship AI productivity tool is accelerating rapidly. Management highlighted that the time from deployment to high usage has fallen from months to days and noted several large enterprise deployments, signaling deep penetration into its customer base. |
| Commercial Remaining Performance Obligation (RPO) | $678 billion (as of Q4 2026) | Represents contracted future revenue that has not yet been recognized, including unearned revenue and amounts that will be invoiced later. It is a primary indicator of the visibility and predictability of future revenue streams, particularly for the commercial cloud businesses. |
| Paid Fabric Customers | over 40,000 (Q4 2026) | Indicates the adoption of Microsoft's unified data and analytics platform. Growth in this metric shows traction in monetizing the data layer that underpins enterprise AI deployments. |
Investment Cycle vs. Margin Erosion
BULL VIEW
Bulls believe the guided margin dip is a temporary and necessary investment to meet overwhelming, pre-sold demand, pointing to the 84% growth in the commercial backlog as proof of future returns.
CORE TENSION
Can accelerating Azure growth (41%) and a $678 billion backlog offset the margin impact of a plan to double data center capacity in two years?
PREVAILING SENTIMENT
The latest evidence favors the bulls. The post-earnings stock advance shows the market is underwriting the investment thesis, given the powerful acceleration in both Azure and Copilot adoption.
BEAR VIEW
Bears see the massive capital spending as the start of a structural margin decline, arguing that intense competition will prevent the company from fully monetizing its new, more expensive infrastructure.
| Timeline | Event & Metric To Watch |
|---|---|
10/27/2026 | AI Investment Returns Fall Short Watch: Q1 FY27 operating margin performance versus guidance and any revisions to the full-year outlook for margins or CapEx. |
10/27/2026 - 10/28/2026 | Competitive Cloud Performance Watch: AWS and Google Cloud revenue growth rates and management commentary on AI demand, capacity, and customer commitments. |
10/27/2026 | Next Earnings Report Watch: The company is scheduled to report its next quarterly earnings. |
10/28/2026 | Amazon Earnings Report Watch: Peer Amazon.com (AMZN) is scheduled to report earnings. |
10/28/2026 | Apple Earnings Report Watch: Peer Apple (AAPL) is scheduled to report earnings. |
H1 | Azure Growth Acceleration Watch: Management expects Azure growth to accelerate in the first half of the fiscal year. |
No set date | Litigation Overhang from AI Products Watch: Court filings, motions for dismissal, announcements of potential settlements, or further reports on product performance issues. |
No set date | Weakness in Personal Computing Watch: PC market data, commentary from hardware partners, and performance of the More Personal Computing segment in quarterly reports. |
| Date | Event | Stock Impact |
|---|---|---|
2026-08-04 | Class Action Lawsuits Filed Details: Securities fraud class action lawsuits were filed against Microsoft, alleging the company misled investors about its AI chatbot Copilot and Azure platform, leading to a 10% stock drop. | -0.0% $486.73 -> $486.54 |
2026-07-29 | Strong Q4 Earnings Report Details: The company reported Q4 FY2026 earnings, leading to a two-day stock reaction of 15.0% while the S&P 500 was unchanged. | +14.7% $392.61 -> $450.25 |
2026-07-23 | New In-House AI Models Launched Details: Microsoft AI released two new in-house models, MAI-Voice-2-Flash and an image model, claiming they can cut costs by up to 89% versus OpenAI models. | -2.2% $389.61 -> $380.98 |
2026-06-24 | Commvault Strategic Partnership Details: Commvault signed a multi-year strategic partnership to integrate its AI and cyber resilience platform as a native ISV Service on Microsoft Azure. | -5.6% $373.24 -> $352.17 |
2026-05-04 | Agent 365 General Availability Details: Microsoft took Agent 365, its management platform for AI agents, out of preview and into general availability, signaling a focus on enterprise AI governance. | -0.7% $412.77 -> $409.72 |
2026-04-27 | OpenAI Partnership Overhauled Details: Microsoft and OpenAI announced a sweeping overhaul of their partnership, dismantling key pillars of exclusivity and replacing them with a looser, time-limited arrangement. | +1.1% $422.91 -> $427.52 |
Position Sizing
5% - 7%
NORMAL POSITION
Sizing is volatility-based: MSFT trades at roughly 26% annualized options-implied volatility versus about 13% for the S&P 500 (1.9x the market), around the 45th percentile of its own trailing year. A 5% - 7% position keeps a single-name swing of that size within a diversified portfolio's risk budget.
Diversification Alternatives
GOOGL - Alphabet
Higher Cloud GrowthAlphabet's cloud segment reported faster revenue growth of 82% in its latest quarter. The company also has a significantly larger absolute research and development spend of $69 billion.
AMZN - Amazon.com
Cloud Market LeaderAmazon.com remains the primary incumbent in cloud infrastructure. It is also investing heavily, with plans for approximately $220 billion in cash capital expenditures in 2026.
Microsoft is an 'AI-utility,' building and monetizing the planet-scale infrastructure and intelligent applications that will power the next generation of enterprise productivity and computing.
Microsoft is aggressively investing to build out a global 'AI factory,' comprised of massive data centers and proprietary silicon, to meet accelerating demand. It monetizes this infrastructure directly through its Azure cloud platform and indirectly through a suite of high-value 'Copilot' AI assistants embedded across its dominant productivity, coding, and security software. The company is shifting its business model from per-seat licenses to a more expansive 'seat-plus-consumption' model, aiming to capture a larger share of the value created by AI-driven productivity gains.
Sustained high growth in Azure (41%), accelerating adoption of Microsoft 365 Copilot seats, and expansion of overall company operating margins despite heavy capital expenditures.
A significant slowdown in Azure growth, evidence of margin compression from AI infrastructure costs that is not offset by revenue, or signs that customers are opting for smaller, non-Microsoft AI models and platforms at scale.
Short-term fluctuations in the More Personal Computing segment (PC market, gaming hardware sales) are largely noise relative to the core thesis centered on the commercial cloud and AI platform shift.
Repricing Catalyst
The key catalyst is the successful monetization of its AI investments, demonstrated by accelerating Azure growth, rapid Copilot seat adoption, and the expansion of the 'seat-plus-consumption' model, which could significantly increase the company's total addressable market and revenue per user.
Productivity and Business Processes
$135.3B TTM (42% of Total) · 60% MarginWhat It Is
This segment sells a portfolio of productivity, communication, and information services to both commercial and consumer customers. Key offerings include Microsoft 365 (Office, Exchange, Teams, Copilot), the professional network LinkedIn, and Dynamics business solutions (ERP/CRM).
Who Pays & How
Enterprises and small businesses pay for integrated, AI-powered productivity and collaboration tools (Microsoft 365, Dynamics) to empower employees and optimize operations. Consumers pay for personal productivity subscriptions (Microsoft 365 Consumer), while enterprises and professionals pay for LinkedIn's premium talent, marketing, and sales solutions.
Competition
Intelligent Cloud
$128.4B TTM (40% of Total) · 41% MarginWhat It Is
This segment provides public, private, and hybrid server products and cloud services to enterprises and developers. It is primarily composed of Azure cloud services (computing, networking, storage, AI), server products (Windows Server, SQL Server), and enterprise services.
Who Pays & How
Enterprises and developers pay for cloud infrastructure and platform services (Azure) to build, deploy, and manage applications without managing on-premises hardware. This allows them to devote more resources to application development and leverage scalable AI and computing capabilities.
Competition
More Personal Computing
$54.6B TTM (17% of Total) · 27% MarginWhat It Is
This segment's products and services are centered on the consumer experience. It includes Windows operating system licensing to Original Equipment Manufacturers (OEMs), Devices (Surface PCs and accessories), Xbox gaming hardware, content, and services, and Search advertising (Bing, Microsoft Edge).
Who Pays & How
PC OEMs pay to pre-install Windows on devices. Consumers pay for Surface devices, Xbox consoles, and Xbox content and subscription services like Game Pass. Advertisers pay to reach a global audience through Bing search and other properties.
Competition
Microsoft — Investor Video Playlist





Industry Resources
| Information Technology Resources |
| TechCrunch |
| Wired |
| CIO |
| MIT Technology Review |
| Gartner Insights |
| Ars Technica |
| Systems Software Resources |
| CNET |
| ZDNet |
| Gartner |
| Software Development Times |
External Quote Links
| Y Finance | Barrons |
| TradingView | Morningstar |
| SeekingAlpha | ValueLine |
| Motley Fool | Robinhood |
| CNBC | Etrade |
| MarketWatch | Unusual Whales |
| YCharts | Perplexity Finance |
| FinViz |
Prefer one of these to Trefis? Tell us why.