
International Business Machines (IBM)
Market Price (10/24/2026): $253.11 | Market Cap: $239.2 BilInvestor Relations Sector: Information Technology | Industry: IT Consulting & Other Services
International Business Machines (IBM)
Market Price (10/24/2026): $253.11Market Cap: $239.2 BilSector: Information TechnologyIndustry: IT Consulting & Other Services
Investment Highlights Why It Matters Detailed financial logic regarding cash flow yields vs trend-riding momentum.
Attractive yieldTotal YieldTotal Yield = Earnings Yield + Dividend Yield, Earnings Yield = Net Income / Market Cap Dividend Yield = Total Dividends / Market Cap is 7.3%, Dividend Yield is 2.6%, FCF Yield is 5.9% Attractive cash flow generationCFO/Rev LTMCash Flow from Operations / Revenue (Sales), Last Twelve Months (LTM) is 23%, FCF/Rev LTMFree Cash Flow / Revenue (Sales), Last Twelve Months (LTM) is 20%, CFO LTM is 16 Bil, FCF LTM is 14 Bil Stock buyback supportStock Buyback 3Y Total is 2.5 Bil Low stock price volatilityVol 12M is 49% Megatrend and thematic driversMegatrends include Artificial Intelligence, Cloud Computing, Cybersecurity, and Crypto & Blockchain. Show more. | Weak multi-year price returns2Y Excs Rtn is -15% | Key risksIBM key risks include [1] intense competition from major hyperscalers in the hybrid cloud market, Show more. |
| Attractive yieldTotal YieldTotal Yield = Earnings Yield + Dividend Yield, Earnings Yield = Net Income / Market Cap Dividend Yield = Total Dividends / Market Cap is 7.3%, Dividend Yield is 2.6%, FCF Yield is 5.9% |
| Attractive cash flow generationCFO/Rev LTMCash Flow from Operations / Revenue (Sales), Last Twelve Months (LTM) is 23%, FCF/Rev LTMFree Cash Flow / Revenue (Sales), Last Twelve Months (LTM) is 20%, CFO LTM is 16 Bil, FCF LTM is 14 Bil |
| Stock buyback supportStock Buyback 3Y Total is 2.5 Bil |
| Low stock price volatilityVol 12M is 49% |
| Megatrend and thematic driversMegatrends include Artificial Intelligence, Cloud Computing, Cybersecurity, and Crypto & Blockchain. Show more. |
| Weak multi-year price returns2Y Excs Rtn is -15% |
| Key risksIBM key risks include [1] intense competition from major hyperscalers in the hybrid cloud market, Show more. |
Qualitative Assessment
AI Analysis | Feedback
International Business Machines (IBM) stock has lost about 10% since 6/30/2026 because of the following key factors:
1. Significant Revenue Miss in Fiscal Q2 2026 and Delayed Software Deals.
International Business Machines (IBM) stock experienced a substantial decline, plummeting 25% on July 14, 2026, following a preliminary announcement of its fiscal Q2 2026 results, which ended on June 30, 2026. The company reported preliminary revenue of $17.2 billion, missing the consensus estimate of $17.86 billion, and adjusted earnings per share (EPS) of $2.93, below the expected $3.02. Management attributed this shortfall to enterprise clients reprioritizing spending towards AI hardware over software and infrastructure, alongside "tens of large deals" in transaction processing software that failed to close on expected timelines.
2. Unchanged Full-Year Revenue Guidance Despite Fiscal Q3 2026 Earnings Beat.
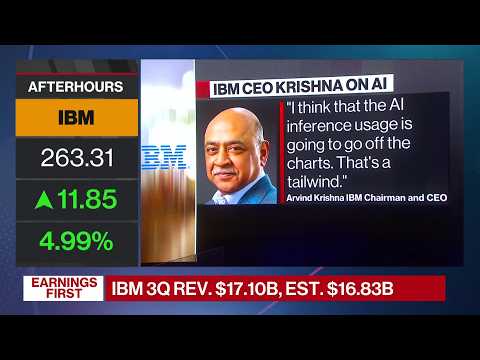
Despite beating Wall Street expectations for both revenue and EPS in its fiscal Q3 2026 earnings report on October 21, 2026, IBM's shares initially slipped by 5.11% in after-hours trading. The company reported revenue of $17.1 billion, exceeding the $16.82 billion consensus, and an adjusted diluted EPS of $2.95, surpassing the $2.86 estimate. However, the market reacted negatively to IBM's decision to maintain its full-year 2026 revenue growth guidance in the range of 4-5%, indicating investor concerns about the sustainability of its growth momentum.
Show more
International Business Machines (IBM) stock has lost about 10% since 6/30/2026 because of the following key factors:
1. Significant Revenue Miss in Fiscal Q2 2026 and Delayed Software Deals.
International Business Machines (IBM) stock experienced a substantial decline, plummeting 25% on July 14, 2026, following a preliminary announcement of its fiscal Q2 2026 results, which ended on June 30, 2026. The company reported preliminary revenue of $17.2 billion, missing the consensus estimate of $17.86 billion, and adjusted earnings per share (EPS) of $2.93, below the expected $3.02. Management attributed this shortfall to enterprise clients reprioritizing spending towards AI hardware over software and infrastructure, alongside "tens of large deals" in transaction processing software that failed to close on expected timelines.
2. Unchanged Full-Year Revenue Guidance Despite Fiscal Q3 2026 Earnings Beat.
Despite beating Wall Street expectations for both revenue and EPS in its fiscal Q3 2026 earnings report on October 21, 2026, IBM's shares initially slipped by 5.11% in after-hours trading. The company reported revenue of $17.1 billion, exceeding the $16.82 billion consensus, and an adjusted diluted EPS of $2.95, surpassing the $2.86 estimate. However, the market reacted negatively to IBM's decision to maintain its full-year 2026 revenue growth guidance in the range of 4-5%, indicating investor concerns about the sustainability of its growth momentum.
3. Adverse Macroeconomic Headwinds Impacting Tech Valuations.
The broader macroeconomic environment during fiscal Q3 2026, characterized by surging long-term interest rates and volatility in AI-related stocks, contributed to a cautious investor sentiment. The Federal Reserve raised the federal funds rate by a quarter point to 3.75–4.00% in September 2026, leading to higher borrowing costs. Concerns about elevated valuations for AI and technology companies, and whether their growth could justify current share prices, also put pressure on the sector.
4. Significant Insider Selling Activity.
A notable insider transaction occurred on August 28, 2026, when Thomas Robert David, a Senior Vice President at IBM, sold 25,000 shares for a total value of approximately $5.76 million. This significant insider selling, exceeding the $5 million threshold, could have signaled a lack of confidence from an executive, potentially contributing to negative investor sentiment during the period.
Show less
Stock Movement Drivers
Fundamental Drivers
The -9.2% change in IBM stock from 6/30/2026 to 10/23/2026 was primarily driven by a -12.0% change in the company's P/E Multiple.| (LTM values as of) | 6302026 | 10232026 | Change |
|---|---|---|---|
| Stock Price ($) | 279.21 | 253.56 | -9.2% |
| Change Contribution By: | |||
| Total Revenues ($ Mil) | 68,912 | 69,870 | 1.4% |
| Net Income Margin (%) | 15.6% | 16.0% | 2.4% |
| P/E Multiple | 24.4 | 21.4 | -12.0% |
| Shares Outstanding (Mil) | 938 | 944 | -0.6% |
| Cumulative Contribution | -9.2% |
Market Drivers
6/30/2026 to 10/23/2026| Return | Correlation | |
|---|---|---|
| IBM | -9.2% | |
| Market (SPY) | 1.8% | 9.5% |
| Sector (XLK) | -3.8% | -6.2% |
Fundamental Drivers
The 6.1% change in IBM stock from 3/31/2026 to 10/23/2026 was primarily driven by a 3.5% change in the company's Total Revenues ($ Mil).| (LTM values as of) | 3312026 | 10232026 | Change |
|---|---|---|---|
| Stock Price ($) | 238.91 | 253.56 | 6.1% |
| Change Contribution By: | |||
| Total Revenues ($ Mil) | 67,536 | 69,870 | 3.5% |
| Net Income Margin (%) | 15.7% | 16.0% | 1.9% |
| P/E Multiple | 21.1 | 21.4 | 1.5% |
| Shares Outstanding (Mil) | 936 | 944 | -0.8% |
| Cumulative Contribution | 6.1% |
Market Drivers
3/31/2026 to 10/23/2026| Return | Correlation | |
|---|---|---|
| IBM | 6.1% | |
| Market (SPY) | 17.2% | 10.7% |
| Sector (XLK) | 38.0% | 5.6% |
Fundamental Drivers
The -7.8% change in IBM stock from 9/30/2025 to 10/23/2026 was primarily driven by a -51.1% change in the company's P/E Multiple.| (LTM values as of) | 9302025 | 10232026 | Change |
|---|---|---|---|
| Stock Price ($) | 275.01 | 253.56 | -7.8% |
| Change Contribution By: | |||
| Total Revenues ($ Mil) | 64,038 | 69,870 | 9.1% |
| Net Income Margin (%) | 9.1% | 16.0% | 75.5% |
| P/E Multiple | 43.9 | 21.4 | -51.1% |
| Shares Outstanding (Mil) | 931 | 944 | -1.4% |
| Cumulative Contribution | -7.8% |
Market Drivers
9/30/2025 to 10/23/2026| Return | Correlation | |
|---|---|---|
| IBM | -7.8% | |
| Market (SPY) | 15.0% | 23.6% |
| Sector (XLK) | 30.5% | 16.3% |
Fundamental Drivers
The 98.2% change in IBM stock from 9/30/2023 to 10/23/2026 was primarily driven by a 377.8% change in the company's Net Income Margin (%).| (LTM values as of) | 9302023 | 10232026 | Change |
|---|---|---|---|
| Stock Price ($) | 127.91 | 253.56 | 98.2% |
| Change Contribution By: | |||
| Total Revenues ($ Mil) | 60,524 | 69,870 | 15.4% |
| Net Income Margin (%) | 3.3% | 16.0% | 377.8% |
| P/E Multiple | 57.5 | 21.4 | -62.7% |
| Shares Outstanding (Mil) | 910 | 944 | -3.7% |
| Cumulative Contribution | 98.2% |
Market Drivers
9/30/2023 to 10/23/2026| Return | Correlation | |
|---|---|---|
| IBM | 98.2% | |
| Market (SPY) | 83.9% | 32.2% |
| Sector (XLK) | 127.5% | 26.1% |
Price Returns Compared
| 2021 | 2022 | 2023 | 2024 | 2025 | 2026 | Total [1] | |
|---|---|---|---|---|---|---|---|
| Returns | |||||||
| IBM Return | 16% | 11% | 22% | 39% | 38% | -13% | 162% |
| Peers Return | 44% | -31% | 52% | 31% | 17% | -3% | 123% |
| S&P 500 Return | 27% | -19% | 24% | 23% | 16% | 12% | 104% |
Monthly Win Rates [3] | |||||||
| IBM Win Rate | 58% | 50% | 67% | 75% | 50% | 50% | |
| Peers Win Rate | 67% | 28% | 68% | 63% | 48% | 44% | |
| S&P 500 Win Rate | 75% | 42% | 67% | 75% | 67% | 50% | |
Max Drawdowns [4] | |||||||
| IBM Max Drawdown | -18% | -17% | -15% | -17% | -20% | -37% | |
| Peers Max Drawdown | -11% | -40% | -17% | -20% | -34% | -35% | |
| S&P 500 Max Drawdown | -5% | -25% | -10% | -8% | -19% | -9% | |
[1] Cumulative total returns since the beginning of 2021
[2] Peers: MSFT, AMZN, ORCL, ACN, GOOGL. See IBM Returns vs. Peers.
[3] Win Rate = % of calendar months in which monthly returns were positive
[4] Max drawdown represents maximum peak-to-trough decline within a year
[5] 2026 data is for the year up to 10/23/2026 (YTD)
How Low Can It Go
| Event | IBM | S&P 500 |
|---|---|---|
| 2025 US Tariff Shock | ||
| % Loss | -16.4% | -18.8% |
| % Gain to Breakeven | 19.6% | 23.1% |
| Time to Breakeven | 37 days | 79 days |
| 2023 SVB Regional Banking Crisis | ||
| % Loss | -10.8% | -6.7% |
| % Gain to Breakeven | 12.1% | 7.1% |
| Time to Breakeven | 32 days | 31 days |
| 2022 Inflation Shock & Fed Tightening | ||
| % Loss | -10.4% | -24.5% |
| % Gain to Breakeven | 11.6% | 32.4% |
| Time to Breakeven | 12 days | 427 days |
| 2020 COVID-19 Crash | ||
| % Loss | -37.2% | -33.7% |
| % Gain to Breakeven | 59.2% | 50.9% |
| Time to Breakeven | 394 days | 140 days |
| Q4 2018 Fed Policy Error / Growth Scare | ||
| % Loss | -28.9% | -19.2% |
| % Gain to Breakeven | 40.6% | 23.8% |
| Time to Breakeven | 206 days | 105 days |
| 2015-2016 China Devaluation / Global Growth Scare | ||
| % Loss | -23.1% | -12.2% |
| % Gain to Breakeven | 30.1% | 13.9% |
| Time to Breakeven | 105 days | 62 days |
In The Past
International Business Machines's stock fell -16.4% during the 2025 US Tariff Shock. Such a loss loss requires a 19.6% gain to breakeven.
Preserve Wealth
Limiting losses and compounding gains is essential to preserving wealth.
Asset Allocation
Actively managed asset allocation strategies protect wealth. Learn more.
| Event | IBM | S&P 500 |
|---|---|---|
| 2020 COVID-19 Crash | ||
| % Loss | -37.2% | -33.7% |
| % Gain to Breakeven | 59.2% | 50.9% |
| Time to Breakeven | 394 days | 140 days |
| Q4 2018 Fed Policy Error / Growth Scare | ||
| % Loss | -28.9% | -19.2% |
| % Gain to Breakeven | 40.6% | 23.8% |
| Time to Breakeven | 206 days | 105 days |
| 2015-2016 China Devaluation / Global Growth Scare | ||
| % Loss | -23.1% | -12.2% |
| % Gain to Breakeven | 30.1% | 13.9% |
| Time to Breakeven | 105 days | 62 days |
| 2014-2016 Oil Price Collapse | ||
| % Loss | -35.6% | -6.8% |
| % Gain to Breakeven | 55.4% | 7.3% |
| Time to Breakeven | 349 days | 15 days |
| 2008-2009 Global Financial Crisis | ||
| % Loss | -34.6% | -53.4% |
| % Gain to Breakeven | 52.8% | 114.4% |
| Time to Breakeven | 203 days | 1085 days |
In The Past
International Business Machines's stock fell -16.4% during the 2025 US Tariff Shock. Such a loss loss requires a 19.6% gain to breakeven.
Preserve Wealth
Limiting losses and compounding gains is essential to preserving wealth.
Asset Allocation
Actively managed asset allocation strategies protect wealth. Learn more.
About International Business Machines (IBM)
International Business Machines Corporation, known as IBM, is a global technology and consulting company that provides integrated solutions and services worldwide. Founded in 1911, IBM helps businesses across various industries manage complex IT environments, transform their operations, and innovate using advanced technologies. The company operates through four main segments: Software, Consulting, Infrastructure, and Financing.
In its Software segment, IBM offers a robust portfolio including hybrid cloud platforms like Red Hat, business automation tools, artificial intelligence and data analytics solutions, and security software. This segment also provides critical transaction processing software that supports mission-critical workloads for industries such as banking, airlines, and retail. The Consulting segment focuses on business transformation, providing services in strategy, business process design, data and analytics, and system integration, helping clients implement new technologies and optimize their operations.
IBM's Infrastructure segment delivers powerful on-premises and cloud-based server and storage solutions designed for mission-critical and regulated workloads, along with support for hybrid cloud environments. Additionally, its Financing segment provides various lease, loan, and short-term working capital options to support clients acquiring IBM's technology and services. Collectively, IBM serves a broad array of enterprise customers across diverse sectors globally, enabling them to build, manage, and secure their digital foundations and drive business growth.
AI Analysis | Feedback
IBM is like the Microsoft for large enterprise IT, providing critical software, hardware, and consulting services.
A combination of Accenture's IT consulting and Oracle's enterprise software and infrastructure, tailored for the world's biggest businesses.
AI Analysis | Feedback
Here are the major products and services offered by International Business Machines (IBM):
- Hybrid Cloud Platform & Software: Provides enterprise open-source solutions, including Red Hat, for hybrid cloud environments.
- Business Automation & AI Software: Offers software for business process automation, AIOps, IT management, data analytics, and artificial intelligence.
- Security Software & Services: Delivers solutions for threat, data, and identity security.
- Transaction Processing Software: Supports mission-critical, on-premise workloads for industries such as banking, airlines, and retail.
- Business & Technology Consulting: Provides strategic advice, business process design, data analytics, system integration, and technology consulting services.
- Application & Cloud Platform Services: Offers services for developing, deploying, and managing applications and cloud platforms.
- Server & Storage Hardware: Supplies on-premises and cloud-based server and storage solutions for mission-critical and regulated workloads.
- Hybrid Cloud Infrastructure Support: Provides support services and solutions for clients' hybrid cloud infrastructure.
- Financing Services: Offers lease, installment payment, loan financing, and short-term working capital financing for clients.
AI Analysis | Feedback
- Banking
- Airlines
- Retail
AI Analysis | Feedback
International Business Machines (symbol: IBM) has the following major suppliers:
- GlobalFoundries (symbol: GFS)
- Micron Technology (symbol: MU)
- Western Digital (symbol: WDC)
AI Analysis | Feedback
Arvind Krishna, Chairman and CEO
Arvind Krishna joined IBM in 1990 at its Thomas J. Watson Research Center. He held critical leadership roles including Senior Vice President of Cloud and Cognitive Software and Director of IBM Research. He was a principal architect of the acquisition of Red Hat, the largest acquisition in the company's history. Krishna led the building and expansion of new markets for IBM in artificial intelligence, cloud, quantum computing, and blockchain technology. He became CEO in April 2020 and Chairman in January 2021. He holds a PhD in electrical engineering from the University of Illinois at Urbana-Champaign and a B. Tech from the Indian Institute of Technology, Kanpur.
James J. Kavanaugh, Senior Vice President and Chief Financial Officer
James J. Kavanaugh joined IBM in 1996. Prior to joining IBM, he served as Chief Financial Officer, Americas Global Services, at AT&T Corporation. He was appointed CFO in January 2018 and oversees IBM's worldwide financial operations, including accounting, investor relations, corporate strategy, corporate development, and treasury. Kavanaugh has been instrumental in aligning IBM's financial strategy with its long-term transformation goals, including managing divestitures, such as Kyndryl, and funding major acquisitions. He holds an MBA from The Ohio State University and a BS from the University of Dayton. He currently serves on the T-Mobile US Board of Directors.
Rob Thomas, Senior Vice President, Software and Chief Commercial Officer
Rob Thomas oversees IBM's software business, including global product, development, business, and revenue, and is responsible for all go-to-market activities across IBM's portfolio. He directed major acquisitions totaling over $12 billion, further strengthening IBM's capabilities in software solutions. His 20-year IBM tenure includes leadership in consulting, microelectronics, and software, and he is the author of several books on big data and AI.
Mohamad Ali, Senior Vice President, IBM Consulting
Mohamad Ali leads IBM Consulting, directing global business transformation and technology services through industry expertise and strategic partnerships. Before joining IBM, he served as CEO of IDG and Carbonite, and was Chief Strategy Officer at Hewlett Packard.
Nickle LaMoreaux, Senior Vice President & Chief Human Resources Officer
Nickle LaMoreaux oversees IBM's global HR function, including talent acquisition, workforce development, diversity, equity, and inclusion (DEI), compensation, and leadership development. Under her leadership, IBM adopted agile work models and expanded skills-based hiring. She plays a key role in change management as IBM adapts its workforce to new business models in cloud, AI, and consulting.
AI Analysis | Feedback
Key Risks to International Business Machines (IBM)
- Intense Competition and Market Share Erosion in Hybrid Cloud and AI: IBM operates in a fiercely competitive environment, particularly in its hybrid cloud and enterprise software segments, where it contends with hyperscale providers like Microsoft and Amazon Web Services. Its consulting arm also battles global systems integrators, and the AI arena sees competition from both large tech companies and agile startups. IBM's revenue growth can be dwarfed by competitors, making it challenging to compete on the breadth of services and pricing in the public cloud sector.
- Cybersecurity Threats and Cloud Reliability Issues: As a major provider of integrated solutions and services, IBM is exposed to significant and evolving cybersecurity threats, including data breaches, ransomware, and other malicious attacks. The increased use of AI may introduce novel methods of attack, and the company's reliance on third-party suppliers also presents cybersecurity risks. Furthermore, frequent cloud outages and systemic weaknesses in its control plane architecture have been reported, which can erode customer trust and undermine IBM's hybrid cloud strategy and overall reliability.
- Challenges in AI Adoption, Governance, and Skills Shortage: The rapid advancement and adoption of generative AI present both opportunities and risks for IBM. A significant challenge lies in governance gaps, as many organizations, including those using IBM's AI models, lack robust AI governance policies and proper access controls. Additionally, there is a recognized skills shortage, particularly in the IBM i platform, and a broader need for workforce retraining and reskilling for AI, which could hinder IBM's ability to effectively implement and deliver AI solutions. Misalignment between client IT roadmaps and IBM's hybrid-cloud strategy, alongside the pressure to modernize while maintaining legacy systems, further contributes to this risk.
AI Analysis | Feedback
The rapid advancements and widespread adoption of generative artificial intelligence (AI) technologies, such as large language models (LLMs), present a clear emerging threat. While IBM has a long history in AI with its Watson platform and offers "data and artificial intelligence solutions," the current paradigm shift driven by companies like OpenAI, Google, and Meta, with their highly capable and increasingly accessible generative AI models, is redefining the competitive landscape. If IBM's enterprise AI offerings do not effectively integrate and leverage these new, powerful capabilities, or if competitors deliver more compelling and performant generative AI solutions that address business problems more efficiently, IBM's market position in this critical and rapidly evolving technology domain could be significantly challenged.
AI Analysis | Feedback
International Business Machines (IBM) operates across several key segments, each addressing significant global markets:
Software Segment
- Hybrid Cloud Platform and Software Solutions: The global hybrid cloud market size was valued at USD 171.6 billion in 2025 and is projected to reach USD 619.6 billion by 2034, exhibiting a compound annual growth rate (CAGR) of 14.88% during 2026-2034.
- Enterprise Open-Source Solutions (Red Hat): The global open source software market size is expected to grow from USD 48.54 billion in 2025 to USD 95.38 billion by 2030, at a CAGR of 14.0%.
- Business Automation Software: The global business process automation market size was approximately USD 9.78 billion in 2022 and is predicted to grow to around USD 21.15 billion by 2030, with a CAGR of roughly 10.10% between 2023 and 2030.
- AIOps and Management: The global Artificial Intelligence for IT Operations (AIOps) platform market size was estimated at USD 14.60 billion in 2024 and is projected to reach USD 36.07 billion by 2030, growing at a CAGR of 15.2% from 2025 to 2030.
- Data and Artificial Intelligence Solutions: The global Artificial Intelligence (AI) software market size is forecast to reach US$174.1 billion in 2025 and is estimated to be valued at US$467 billion by 2030, growing at a CAGR of 25%.
- Security Software and Services (Cybersecurity): The global cybersecurity market size reached USD 326.2 billion in 2025. Looking forward, the market is expected to reach USD 676.3 billion by 2034, exhibiting a CAGR of 8.40% during 2026-2034.
- Transaction Processing Software: The global Payment Processing Software market size is expected to reach USD 74,362.1 million by the end of 2025 and USD 165,495 million by 2033, growing at a CAGR of 10.517% during 2025 to 2033.
Consulting Segment
- Business Transformation, Technology Consulting, and Application and Cloud Platform Services: The global IT consulting services market size is estimated at USD 69,590 million in 2025 and is expected to rise to USD 106,580 million by 2034, experiencing a CAGR of 6.4%.
Infrastructure Segment
- On-premises and Cloud-based Server Solutions: The global enterprise server market size reached USD 132.0 billion in 2024. Looking forward, the market is expected to reach USD 310.0 billion by 2033, exhibiting a CAGR of 10% during 2025-2033.
- Storage Solutions: The global enterprise data storage market size is projected to surge from USD 13.1 billion in 2025 to USD 19.8 billion by 2034, expanding at a CAGR of 4.7% over the forecast period.
Financing Segment
- Lease, Installment Payment, Loan Financing, and Short-term Working Capital Financing Services: Null
AI Analysis | Feedback
International Business Machines (IBM) anticipates several key drivers for its future revenue growth over the next two to three years:
- Hybrid Cloud and Generative AI Adoption: IBM's strategy is centered on being a software-led hybrid cloud and AI platform company. The company is experiencing significant growth in its generative AI book of business, which stood at over $12.5 billion by Q4 2025, indicating strong enterprise adoption of its AI capabilities.
- Strong Software Segment Performance: The Software segment, particularly driven by Red Hat, automation, and data & AI offerings, is expected to be a primary growth engine. IBM projected 10% software revenue growth for 2026. Red Hat's annual recurring revenue (ARR) continues to expand, and OpenShift is demonstrating strong growth within Red Hat.
- Accelerating Consulting Services: IBM's Consulting segment is forecast to see accelerated growth, fueled by strong demand for hybrid cloud and AI technologies, as well as its Consulting Advantage platform which leverages digital assets for client value.
- IBM Z Mainframe Cycle: The latest generation of IBM's mainframe platform (z17) is a significant contributor to the Infrastructure segment's revenue. Its robust adoption, particularly for mission-critical and AI/hybrid cloud workloads, continues to drive growth.
- Strategic Acquisitions: Mergers and acquisitions, primarily focused on software, remain a core strategy for IBM to enhance its portfolio and accelerate growth. Acquisitions like Confluent are expected to contribute to revenue growth in 2026 and beyond.
AI Analysis | Feedback
Share Repurchases
- IBM suspended its share repurchase program from 2020 through 2023 to focus on debt repayment following the Red Hat acquisition.
- As of early 2026, the company has not resumed stock buybacks under current CEO Arvind Krishna, despite having approximately $2.0 billion remaining in share repurchase authorization.
- IBM has not repurchased $2 billion in stock in any single quarter since December 2019.
Share Issuance
- IBM has experienced mild shareholder dilution, with fully-diluted shares outstanding increasing from 904 million in June 2021 to 924 million as of September 2024.
- Shares outstanding for the quarter ending December 31, 2025, were 0.952 billion, reflecting a 1.63% increase year-over-year.
- On average, since 1999, IBM has issued 18.3 million shares annually for stock-based compensation and stock purchase plans.
Outbound Investments
- IBM has continued strategic acquisitions in the last 3-5 years, averaging 8 acquisitions annually from 2020-2025.
- Key acquisitions include HashiCorp for $6.4 billion in April 2024, aimed at enhancing its hybrid cloud platform and infrastructure automation capabilities.
- In December 2025, IBM acquired Confluent for $11 billion to bolster its smart data platform for enterprise generative AI.
- Other acquisitions since 2021 have focused on strengthening its portfolio in areas such as AI-powered application resource management (Turbonomic, 2021), renewable energy asset performance management (Prescinto, 2024), and generative AI data needs (DataStax, 2025).
Capital Expenditures
- IBM's capital expenditures have shown a general downward trend over the last decade.
- Annual capital expenditures were approximately $2.01 billion in 2021, $1.35 billion in 2022, $1.245 billion in 2023, $1.048 billion in 2024, and $1.091 billion in 2025.
- The company's focus on transitioning to higher-growth, higher-margin businesses like software and AI has contributed to a shrinking capital expenditure profile.

Peer Outperformance in IT Consulting & Other Services
| Industry | Names | 1Y med | 3Y med | 5Y med | Top 3 by 5Y |
|---|---|---|---|---|---|
| Electronic Manufacturing Services | 10 | 23.0% | 132.8% | 207.2% | TTMI 496% · FLEX 458% · JBL 351% |
| Technology Distributors | 9 | 43.1% | 87.1% | 87.5% | AVT 163% · SNX 151% · CNXN 116% |
| Communications Equipment | 36 | 1.6% | 105.3% | 72.7% | AAOI 800% · LITE 800% · ANET 606% |
| Semiconductor Materials & Equipment | 28 | 43.5% | 67.0% | 63.1% | AXTI 510% · KLAC 346% · LRCX 335% |
| Electronic Components | 26 | -4.8% | 69.7% | 38.8% | CLS 2684% · BELFA 1101% · APH 291% |
| Semiconductors | 54 | 4.4% | 35.2% | 24.4% | MU 1231% · NVDA 832% · AVGO 582% |
| Technology Hardware, Storage & Peripherals | 21 | 15.0% | 92.7% | 21.4% | SMCI 833% · DELL 772% · STX 733% |
| Electronic Equipment & Instruments | 27 | -13.3% | 23.0% | -7.0% | PI 204% · OSIS 108% · KEYS 79% |
| Internet Services & Infrastructure | 6 | 3.3% | 49.3% | -7.1% | GDDY 63% · VRSN 40% · DOCN -1% |
| IT Consulting & Other Services ← | 29 | -19.6% | 4.7% | -22.1% | CHRN 388584% · APLD 297% · IBM 150% |
| Application Software | 126 | -19.8% | -6.8% | -44.2% | PLTR 705% · FROG 185% · AGYS 133% |
| Systems Software | 69 | -13.6% | 37.8% | -49.7% | ZETA 315% · CRWD 264% · FTNT 168% |
Latest Trefis Analyses
Research & Analysis
Invest in Strategies
Wealth Management
Peer Comparisons
| Peers to compare with: |
Financials
| Median | |
|---|---|
| Name | |
| Mkt Price | 251.09 |
| Mkt Cap | 2,679.3 |
| Rev LTM | 331,839 |
| Op Inc LTM | 93,712 |
| FCF LTM | 14,018 |
| FCF 3Y Avg | 16,732 |
| CFO LTM | 161,403 |
| CFO 3Y Avg | 130,164 |
Growth & Margins
| Median | |
|---|---|
| Name | |
| Rev Chg LTM | 15.8% |
| Rev Chg 3Y Avg | 13.0% |
| Rev Chg Q | 17.7% |
| QoQ Delta Rev Chg LTM | 4.3% |
| Op Inc Chg LTM | 20.8% |
| Op Inc Chg 3Y Avg | 20.6% |
| Op Mgn LTM | 18.3% |
| Op Mgn 3Y Avg | 17.2% |
| QoQ Delta Op Mgn LTM | 0.4% |
| CFO/Rev LTM | 22.7% |
| CFO/Rev 3Y Avg | 21.7% |
| FCF/Rev LTM | 15.7% |
| FCF/Rev 3Y Avg | 16.1% |
Valuation
| Median | |
|---|---|
| Name | |
| Mkt Cap | 2,679.3 |
| P/S | 3.5 |
| P/Op Inc | 25.1 |
| P/EBIT | 15.0 |
| P/E | 19.8 |
| P/CFO | 16.6 |
| Total Yield | 6.5% |
| Dividend Yield | 0.7% |
| FCF Yield 3Y Avg | 2.4% |
| D/E | 0.1 |
| Net D/E | 0.0 |
Returns
| Median | |
|---|---|
| Name | |
| 1M Rtn | 2.3% |
| 3M Rtn | 14.6% |
| 6M Rtn | 2.5% |
| 12M Rtn | 2.4% |
| 3Y Rtn | 78.0% |
| 1M Excs Rtn | 3.6% |
| 3M Excs Rtn | 9.9% |
| 6M Excs Rtn | -3.9% |
| 12M Excs Rtn | -11.3% |
| 3Y Excs Rtn | 1.6% |
Comparison Analyses
Segment Financials
Revenue by Segment| $ Mil | 2025 | 2024 | 2023 | 2022 | 2021 |
|---|---|---|---|---|---|
| Software | 29,962 | 27,085 | 25,011 | 23,629 | 23,426 |
| Consulting | 21,055 | 20,692 | 20,884 | 20,058 | 17,844 |
| Infrastructure | 15,718 | 14,020 | 14,593 | 15,288 | 14,188 |
| Financing | 737 | 713 | 741 | 645 | 774 |
| Other revenue | 65 | 207 | 235 | 135 | 335 |
| Other-divested businesses | -2 | 35 | 397 | 774 | 785 |
| Total | 67,535 | 62,752 | 61,861 | 60,529 | 57,352 |
| $ Mil | 1998 |
|---|---|
| Global Services | 3,757 |
| Server | 2,842 |
| Software | 2,588 |
| Global Financing | 1,165 |
| Technology | 955 |
| Enterprise Investments | -616 |
| Personal Systems | -992 |
| Total | 9,699 |
| $ Mil | 2024 | 2023 | 2022 | 2021 | 2020 |
|---|---|---|---|---|---|
| Software | 60,707 | 61,141 | 55,822 | 58,420 | 58,558 |
| Consulting | 14,826 | 14,342 | 14,261 | 11,914 | 10,548 |
| Cash and marketable securities | 14,243 | 12,907 | 12,463 | ||
| Financing | 14,075 | 14,409 | 15,757 | 16,880 | 24,974 |
| Infrastructure | 12,161 | 11,991 | 12,243 | 11,766 | 12,378 |
| Pension assets | 7,492 | 7,506 | 7,557 | ||
| Deferred tax assets | 6,850 | 6,468 | 8,175 | ||
| Other | 3,647 | 3,563 | 3,514 | ||
| Operating right-of-use assets | 2,001 | 2,085 | 2,368 | ||
| Plant, other property and equipment | 1,952 | 1,838 | 2,449 | ||
| Other-divested businesses | 74 | 19 | 254 | ||
| Elimination of internal transactions | -853 | -1,028 | -4,686 | ||
| Notes and accounts receivable | 1,655 | ||||
| Total assets of discontinued operations | 15,764 | ||||
| Total | 137,175 | 135,241 | 98,083 | 98,980 | 155,971 |
Price Behavior
| Market Price | $253.56 | |
| Market Cap ($ Bil) | 239.5 | |
| First Trading Date | 01/02/1962 | |
| Distance from 52W High | -22.4% | |
| 50 Days | 200 Days | |
| DMA Price | $233.04 | $248.15 |
| DMA Trend | down | down |
| Distance from DMA | 8.8% | 2.2% |
| 3M | 1YR | |
| Volatility | 30.8% | 48.9% |
| Downside Capture | 92.83 | 125.46 |
| Upside Capture | 171.91 | 94.46 |
| Correlation (S&P 500) | 33.0% | 23.4% |
| 1M | 2M | 3M | 6M | 1Y | 3Y | |
|---|---|---|---|---|---|---|
| Beta | 1.10 | 1.46 | 0.47 | 0.49 | 0.90 | 0.75 |
| Up Beta | 0.87 | 1.51 | 1.56 | -0.31 | 0.41 | 0.57 |
| Down Beta | -0.74 | -0.37 | -0.14 | 0.52 | 1.02 | 0.76 |
| Up Capture | 104% | 155% | -39% | 45% | 70% | 65% |
| Bmk +ve Days | 6 | 16 | 27 | 66 | 132 | 424 |
| Stock +ve Days | 9 | 21 | 33 | 66 | 133 | 420 |
| Down Capture | 191% | 184% | 97% | 104% | 115% | 95% |
| Bmk -ve Days | 16 | 26 | 37 | 60 | 120 | 328 |
| Stock -ve Days | 13 | 21 | 31 | 60 | 119 | 331 |
[1] Upside and downside betas calculated using positive and negative benchmark daily returns respectively
Based On 1-Year Data
| Annualized Return | Annualized Volatility | Sharpe Ratio | Correlation with IBM | |
|---|---|---|---|---|
| IBM | -9.6% | 48.9% | -0.04 | - |
| Sector ETF (XLK) | 29.0% | 26.7% | 0.92 | 15.8% |
| Equity (SPY) | 14.8% | 12.7% | 0.80 | 22.9% |
| Gold (GLD) | -2.8% | 28.5% | -0.11 | -0.9% |
| Commodities (DBC) | 52.1% | 20.7% | 1.91 | -9.0% |
| Real Estate (VNQ) | 4.3% | 13.9% | 0.06 | 15.9% |
| Bitcoin (BTCUSD) | -24.8% | 43.5% | -0.54 | 6.9% |
Smart multi-asset allocation framework can stack odds in your favor. Learn How
Based On 5-Year Data
| Annualized Return | Annualized Volatility | Sharpe Ratio | Correlation with IBM | |
|---|---|---|---|---|
| IBM | 17.2% | 30.5% | 0.55 | - |
| Sector ETF (XLK) | 19.5% | 26.0% | 0.67 | 29.3% |
| Equity (SPY) | 12.7% | 17.1% | 0.56 | 35.2% |
| Gold (GLD) | 17.3% | 18.9% | 0.73 | 3.4% |
| Commodities (DBC) | 9.5% | 19.5% | 0.37 | 6.2% |
| Real Estate (VNQ) | 1.1% | 18.9% | -0.05 | 30.3% |
| Bitcoin (BTCUSD) | 5.7% | 51.7% | 0.29 | 11.9% |
Smart multi-asset allocation framework can stack odds in your favor. Learn How
Based On 10-Year Data
| Annualized Return | Annualized Volatility | Sharpe Ratio | Correlation with IBM | |
|---|---|---|---|---|
| IBM | 10.1% | 28.3% | 0.38 | - |
| Sector ETF (XLK) | 24.0% | 25.1% | 0.87 | 43.3% |
| Equity (SPY) | 15.3% | 17.9% | 0.72 | 51.7% |
| Gold (GLD) | 11.8% | 16.4% | 0.59 | 3.5% |
| Commodities (DBC) | 8.4% | 18.1% | 0.38 | 16.8% |
| Real Estate (VNQ) | 5.2% | 20.7% | 0.21 | 42.3% |
| Bitcoin (BTCUSD) | 62.4% | 66.2% | 1.02 | 9.2% |
Smart multi-asset allocation framework can stack odds in your favor. Learn How
Returns Analyses
Earnings Returns History
Updated 10/24/2026| Forward Returns | |||
|---|---|---|---|
| Earnings Date | 1D Returns | 5D Returns | 21D Returns |
| 10/21/2026 | 0.3% | ||
| 7/22/2026 | 0.4% | 10.0% | 14.4% |
| 4/22/2026 | -8.3% | -9.8% | 1.2% |
| 1/28/2026 | 0.1% | 0.2% | -17.2% |
| 10/22/2025 | -0.9% | 7.2% | 1.6% |
| 7/23/2025 | -7.6% | -7.7% | -14.5% |
| 4/23/2025 | -6.6% | -1.5% | 6.0% |
| 1/29/2025 | 1.3% | 17.2% | 13.0% |
| ... | |||
| SUMMARY STATS | |||
| # Positive | 13 | 13 | 15 |
| # Negative | 12 | 11 | 9 |
| Median Positive | 1.5% | 6.1% | 6.0% |
| Median Negative | -6.3% | -7.7% | -6.4% |
| Max Positive | 7.1% | 17.2% | 20.7% |
| Max Negative | -9.6% | -12.0% | -17.2% |
| Forward Returns | |||
|---|---|---|---|
| Earnings Date | 1D Returns | 5D Returns | 21D Returns |
| 10/21/2026 | 0.3% | ||
| 7/22/2026 | 0.4% | 10.0% | 14.4% |
| 4/22/2026 | -8.3% | -9.8% | 1.2% |
| 1/28/2026 | 0.1% | 0.2% | -17.2% |
| 10/22/2025 | -0.9% | 7.2% | 1.6% |
| 7/23/2025 | -7.6% | -7.7% | -14.5% |
| 4/23/2025 | -6.6% | -1.5% | 6.0% |
| 1/29/2025 | 1.3% | 17.2% | 13.0% |
| 10/23/2024 | -6.2% | -12.0% | -3.7% |
| 7/24/2024 | 4.3% | 4.4% | 7.4% |
| 4/24/2024 | -8.3% | -10.7% | -6.4% |
| 1/24/2024 | -0.0% | 8.0% | 6.9% |
| 10/25/2023 | 4.9% | 6.1% | 14.5% |
| 7/19/2023 | 2.1% | 4.1% | 5.0% |
| 4/19/2023 | 0.0% | -0.4% | 1.2% |
| 1/25/2023 | -0.5% | -4.8% | -6.4% |
| 10/19/2022 | 4.7% | 10.2% | 20.7% |
| 7/18/2022 | -5.2% | -6.9% | 0.1% |
| 4/19/2022 | 7.1% | 5.5% | 4.2% |
| 1/24/2022 | -0.4% | 4.0% | -3.0% |
| 10/20/2021 | -9.6% | -11.8% | -13.2% |
| 7/19/2021 | 1.5% | 3.5% | 4.5% |
| 4/19/2021 | 3.8% | 6.3% | 9.3% |
| 1/21/2021 | 1.2% | -5.9% | -7.3% |
| 10/19/2020 | -6.5% | -10.6% | -4.9% |
| SUMMARY STATS | |||
| # Positive | 13 | 13 | 15 |
| # Negative | 12 | 11 | 9 |
| Median Positive | 1.5% | 6.1% | 6.0% |
| Median Negative | -6.3% | -7.7% | -6.4% |
| Max Positive | 7.1% | 17.2% | 20.7% |
| Max Negative | -9.6% | -12.0% | -17.2% |
SEC Filings
Expand for More| Report Date | Filing Date | Filing |
|---|---|---|
| 09/30/2026 | 10/22/2026 | 10-Q |
| 06/30/2026 | 07/23/2026 | 10-Q |
| 03/31/2026 | 04/23/2026 | 10-Q |
| 12/31/2025 | 02/24/2026 | 10-K |
| 09/30/2025 | 10/23/2025 | 10-Q |
| 06/30/2025 | 07/24/2025 | 10-Q |
| 03/31/2025 | 04/24/2025 | 10-Q |
| 12/31/2024 | 02/25/2025 | 10-K |
| 09/30/2024 | 10/30/2024 | 10-Q |
| 06/30/2024 | 07/30/2024 | 10-Q |
| 03/31/2024 | 04/30/2024 | 10-Q |
| 12/31/2023 | 02/26/2024 | 10-K |
| 09/30/2023 | 10/31/2023 | 10-Q |
| 06/30/2023 | 07/25/2023 | 10-Q |
| 03/31/2023 | 04/25/2023 | 10-Q |
| 12/31/2022 | 02/28/2023 | 10-K |
| Report Date | Filing Date | Filing |
|---|---|---|
| 09/30/2026 | 10/22/2026 | 10-Q |
| 06/30/2026 | 07/23/2026 | 10-Q |
| 03/31/2026 | 04/23/2026 | 10-Q |
| 12/31/2025 | 02/24/2026 | 10-K |
| 09/30/2025 | 10/23/2025 | 10-Q |
| 06/30/2025 | 07/24/2025 | 10-Q |
| 03/31/2025 | 04/24/2025 | 10-Q |
| 12/31/2024 | 02/25/2025 | 10-K |
| 09/30/2024 | 10/30/2024 | 10-Q |
| 06/30/2024 | 07/30/2024 | 10-Q |
| 03/31/2024 | 04/30/2024 | 10-Q |
| 12/31/2023 | 02/26/2024 | 10-K |
| 09/30/2023 | 10/31/2023 | 10-Q |
| 06/30/2023 | 07/25/2023 | 10-Q |
| 03/31/2023 | 04/25/2023 | 10-Q |
| 12/31/2022 | 02/28/2023 | 10-K |
| 09/30/2022 | 10/25/2022 | 10-Q |
| 06/30/2022 | 07/25/2022 | 10-Q |
| 03/31/2022 | 04/26/2022 | 10-Q |
| 12/31/2021 | 02/22/2022 | 10-K |
| 09/30/2021 | 11/05/2021 | 10-Q |
| 06/30/2021 | 07/27/2021 | 10-Q |
| 03/31/2021 | 04/27/2021 | 10-Q |
| 12/31/2020 | 02/23/2021 | 10-K |
| 09/30/2020 | 10/27/2020 | 10-Q |
| 06/30/2020 | 07/28/2020 | 10-Q |
| 03/31/2020 | 04/28/2020 | 10-Q |
| 12/31/2019 | 02/25/2020 | 10-K |
Recent Forward Guidance
Updated 10/22/2026Latest: Q3 2026 Earnings Reported 10/21/2026
| Forward Guidance | Guidance Change | |||||||
|---|---|---|---|---|---|---|---|---|
| Metric | Source | Low | Mid | High | % Chg | % Delta | Change | Prior |
| Q4 2026 Dividend Per Share | Reported | 1.69 | ||||||
| 2026 Constant Currency Revenue Growth | Reported | 4.0% | 4.5% | 5.0% | 0.0% | Affirmed | Guidance: 4.5% for 2026 | |
| 2026 Currency Impact on Revenue Growth | Reported | 0.0% | ||||||
| 2026 Free Cash Flow | Reported | |||||||
Prior: Q1 2026 Earnings Reported 4/22/2026
| Forward Guidance | Guidance Change | |||||||
|---|---|---|---|---|---|---|---|---|
| Metric | Source | Low | Mid | High | % Chg | % Delta | Change | Prior |
| 2026 Revenue Growth | Reported | 5.0% | 0.0% | Affirmed | Guidance: 5.0% for 2026 | |||
| 2026 Free Cash Flow Growth | Reported | 1.57E12% | 0.0% | Affirmed | Guidance: 1.57E12% for 2026 | |||
Q4 2025 Earnings Reported 1/28/2026
| Forward Guidance | Guidance Change | |||||||
|---|---|---|---|---|---|---|---|---|
| Metric | Source | Low | Mid | High | % Chg | % Delta | Change | Prior |
| 2026 Revenue Growth | Reported | 5.0% | 0.0% | Affirmed | Guidance: 5.0% for 2025 | |||
| 2026 Free Cash Flow | Reported | 15.70 Bil | 12.1% | Higher New | Guidance: 14.00 Bil for 2025 | |||
Insider Activity
Updated 8/28/2026| # | Owner | Title | Holding | Action | Filing Date | Price | Shares | Transacted Value | Value of Held Shares | Form |
|---|---|---|---|---|---|---|---|---|---|---|
| 1 | Thomas, Robert David | Senior Vice President | Direct | Sell | 8282026 | 230.32 | 25,000 | 5,758,088 | 11,009,544 | Form |
| 2 | Howard, Michelle J | Direct | Buy | 2252026 | 237.83 | 50 | 11,891 | 46,139 | Form | |
| 3 | Miebach, Michael | Direct | Buy | 2252026 | 233.33 | 434 | 101,264 | 101,264 | Form | |
| 4 | Farr, David N | Direct | Buy | 1302026 | 304.00 | 1,000 | 304,000 | 2,814,432 | Form |
| # | Owner | Title | Holding | Action | Filing Date | Price | Shares | Transacted Value | Value of Held Shares | Form |
|---|---|---|---|---|---|---|---|---|---|---|
| 1 | Thomas, Robert David | Senior Vice President | Direct | Sell | 8282026 | 230.32 | 25,000 | 5,758,088 | 11,009,544 | Form |
| 2 | Howard, Michelle J | Direct | Buy | 2252026 | 237.83 | 50 | 11,891 | 46,139 | Form | |
| 3 | Miebach, Michael | Direct | Buy | 2252026 | 233.33 | 434 | 101,264 | 101,264 | Form | |
| 4 | Farr, David N | Direct | Buy | 1302026 | 304.00 | 1,000 | 304,000 | 2,814,432 | Form |
Investor Activity (13F)
Updated Oct 24, 2026Active managers (13F portfolio over $250M, at least 3 holdings) with a position over $5M that is either over 10% of their portfolio or held in a concentrated book of 50 or fewer total positions. Index/ETF, sovereign, bank, community-bank and charitable/donor-advised filers are excluded.
IBM Trade Sentinel
Constructive
CONVICTION RATIONALE
Conviction is constructive based on tangible signs the software pivot is working. Software revenue growth accelerated to 9% in the latest quarter, and Red Hat bookings, a key forward indicator, accelerated to the high teens. While a recent execution miss warrants caution, management has affirmed its full-year 4%-5% revenue guidance and raised its free cash flow outlook.
STOCK ARCHETYPE
Enterprise Solutions & ServicesEnterprise spending on digital transformation, driven by the adoption of hybrid cloud and AI, which creates demand across IBM's software, consulting, and infrastructure portfolio. High-margin, recurring software revenue, particularly from the Red Hat platform and the entrenched mainframe software stack (Transaction Processing).
INVESTMENT THESIS
Evidence suggests yes. The latest quarter showed a significant re-acceleration in the core software business, supported by strong forward-looking bookings.
- Software revenue growth accelerated to 9% in Q3 2026, up from 5% in Q2.
- Red Hat bookings, a leading indicator, accelerated to the high teens in Q3.
- The high-value annual recurring revenue (ARR) base grew 8% to $24.9 billion.
- The z17 mainframe cycle generated over $1 billion in incremental revenue in six quarters.
PRIMARY RISK
IBM's growth and investment lag far behind larger rivals, risking long-term share loss in the critical AI and cloud markets despite its incumbent strengths.
- IBM's 6.8% TTM revenue growth trails Microsoft's 17.8% and Amazon's 15.8%.
- Microsoft's R&D spend of $35.6 billion is nearly 4x IBM's $9 billion.
- Microsoft's capex of $115.9 billion dwarfs IBM's $1.8 billion.
- A Q2 2026 revenue miss highlighted execution volatility against this backdrop.
| KPI | Status | Rationale |
|---|---|---|
| Software Revenue Growth | 9% year-over-year growth for the third quarter of 2026 - Accelerating | Software growth decelerated in the second quarter but saw a strong rebound in the third quarter. Management attributed the Q3 acceleration to strong new business and the closure of approximately two-thirds of the large deals that had slipped from the second quarter, suggesting the Q2 weakness was primarily a timing issue rather than a fundamental decline in demand. |
| Red Hat Performance (Bookings & Revenue Growth) | 11% year-over-year revenue growth in Q3 2026, with bookings growth accelerating to the 'high teens' - Accelerating | While Red Hat's revenue growth has been steady, management emphasized in the latest earnings call that bookings, a forward-looking indicator, accelerated significantly. This suggests a potential for stronger revenue growth in future periods and reflects strong demand for its core hybrid cloud offerings, such as OpenShift, which saw its ARR growth accelerate to over 30%. |
| Red Hat OpenShift ARR | $2.4 billion (Q3 2026) | Signals strong client adoption of IBM's containerization platform, which is crucial for modernizing applications and deploying AI workloads in a hybrid cloud environment. |
| Red Hat Bookings Growth | Accelerated back to the high teens (Q3 2026) | A leading indicator of future revenue growth for the key Red Hat business, reflecting strong current demand. |
| Installed MIPS Capacity | Aggregated installed capacity has tripled over the last few programs (Q3 2026) | Represents the primary monetization vehicle for high-margin Transaction Processing software. Growth in installed capacity indicates a strong future revenue stream from the mainframe ecosystem. |
Software Rebound: Sustainable Acceleration or Temporary Catch-Up?
BULL VIEW
The Q3 software acceleration to 9% growth, powered by Red Hat bookings jumping to the high teens, signals a durable strengthening of demand for IBM's hybrid cloud platform.
CORE TENSION
Can accelerating Red Hat bookings offset the modest full-year 4%-5% revenue guide, which followed a significant Q2 miss?
PREVAILING SENTIMENT
The latest evidence favors the bulls. The acceleration in Red Hat bookings is a forward-looking indicator that points to future growth, not just a recovery of past deals.
BEAR VIEW
The Q3 strength was just a pull-in of deals that slipped from Q2. The modest full-year revenue guide of 4%-5% suggests the underlying growth rate remains muted.
| Timeline | Event & Metric To Watch |
|---|---|
12/8/2026 | Peer Growth Comparisons Watch: Peer results highlighting IBM's relative growth deficit, potentially impacting investor sentiment and valuation multiples. |
12/16/2026 | Accenture Earnings Report Watch: Peer Accenture (ACN) is scheduled to report earnings. |
1/26/2027 | Earnings Execution Volatility Watch: A miss on revenue or profit guidance for Q4 or weak guidance for 2027. |
1/26/2027 | Acquisition Synergy Questions Watch: Management commentary on the Q4 call suggesting slower-than-expected synergies or integration issues with Confluent or HashiCorp. |
1/26/2027 | IBM Q4 Earnings Watch: The company is scheduled to report its next earnings. |
2/2/2027 | Alphabet Earnings Report Watch: Peer Alphabet (GOOGL) is scheduled to report earnings. |
December 10 | IBM Quantum Day Watch: The company will hold its Quantum Day to discuss progress. |
| Date | Event | Stock Impact |
|---|---|---|
2026-10-21 | Strong Q3 Results Reported Details: The company reported accelerated Q3 revenue growth of 6%, leading to a positive two-day stock reaction of 4.0% and an increased full-year free cash flow growth expectation. | +4.2% $241.92 -> $252.11 |
2026-09-10 | NASA AI Model Released Details: In collaboration with NASA, the company released an open-source AI foundation model to help scientists analyze lunar observation data and identify geographic features. | +1.4% $239.94 -> $243.29 |
2026-08-13 | OpenAI Partnership Announced Details: The company announced a partnership with OpenAI to embed frontier models into IBM Consulting's AI delivery platform to help clients modernize applications. | -0.7% $235.98 -> $234.32 |
2026-07-20 | Negative Q2 Pre-announcement Details: A negative pre-announcement for Q2 results reportedly caused the stock to drop 25% during one trading day, with management later citing a shift in client spending priorities. | -1.0% $211.16 -> $209.00 |
2026-06-02 | Analyst Raises Price Target Details: An analyst note reported a price target increase to $350 from $320, citing confidence in execution and that AI-driven disruption fears proved unfounded. | -4.6% $318.14 -> $303.45 |
2026-05-05 | AI and Sovereignty Platforms Announced Details: At its Think 2026 conference, the company announced its blueprint for an AI Operating Model and the general availability of IBM Sovereign Core for operationalizing digital sovereignty. | -1.6% $226.18 -> $222.49 |
2026-04-22 | Negative Q1 Earnings Reaction Details: Following the company's Q1 2026 earnings report, the stock experienced a significant negative reaction, falling -10.0% over two days. | -9.6% $252.00 -> $227.76 |
Position Sizing
4% - 6%
NORMAL POSITION
Sizing is volatility-based: IBM trades at roughly 31% annualized realized (three-month) volatility versus about 11% for the S&P 500 (2.9x the market). A 4% - 6% position keeps a single-name swing of that size within a diversified portfolio's risk budget.
Diversification Alternatives
MSFT - Microsoft
Hyperscale Growth LeaderMicrosoft offers significantly higher growth (17.8% TTM revenue growth) and profitability (46.8% operating margin) with massive scale in R&D and infrastructure investment.
ACN - Accenture
Pure-Play ConsultingAccenture provides focused exposure to the IT services and consulting market at a similar revenue scale to IBM's entire business, but with a different cost and margin structure.
A legacy tech giant successfully monetizing its entrenched enterprise base through a strategic pivot to a software-led hybrid cloud and AI platform.
IBM is leveraging its deep incumbency in mission-critical systems, particularly the mainframe, to drive a transition to higher-growth, higher-margin software and services. The strategy centers on providing the essential platforms (Red Hat, watsonx) for enterprises to deploy AI and modernize applications in a hybrid environment. This pivot is creating a more durable, predictable, and profitable revenue stream, as evidenced by accelerating software growth and expanding margins.
Continued acceleration in Software revenue, especially Red Hat bookings; sustained high-margin Transaction Processing revenue from the z17 cycle; and continued expansion of overall operating margins.
A sustained deceleration in Red Hat growth; evidence of clients moving mission-critical workloads off the mainframe, weakening the Transaction Processing moat; or failure to commercialize AI innovations at scale against large competitors.
Quarterly fluctuations in the Infrastructure segment due to hardware product cycles, which can obscure the underlying positive trend in the software business.
Repricing Catalyst
The market's increasing recognition of the successful software pivot, evidenced by the recent positive 4.0% two-day stock reaction to earnings and accelerating software growth metrics.
Software
$30.0B TTM (44% of Total)What It Is
Sells hybrid cloud and AI platforms, including Red Hat, as well as data, automation, and transaction processing software to enterprise clients.
Who Pays & How
Enterprises pay for software to build and run applications, manage data, orchestrate AI, and operate mission-critical systems. They choose IBM for its depth of offerings, hybrid cloud capabilities, and incumbency in enterprise environments.
Competition
Consulting
$21.1B TTM (31% of Total)What It Is
Provides strategy, experience design, technology, and operations expertise to enterprise clients to deliver business transformation.
Who Pays & How
Enterprises pay for expertise to re-engineer business processes and integrate technology like AI and hybrid cloud to achieve strategic priorities and unlock productivity.
Competition
Infrastructure
$15.7B TTM (23% of Total)What It Is
Provides on-premises and cloud-based server and storage solutions to enterprise clients.
Who Pays & How
Enterprises pay for secure, scalable, and reliable hardware for mission-critical and AI workloads, particularly the IBM Z mainframe platform.
Competition
Financing
$737M TTM (1% of Total)What It Is
Provides client and commercial financing to facilitate clients' acquisition of IBM's hardware, software, and services.
Who Pays & How
Clients use financing to acquire IBM's technology solutions, choosing IBM for its IT product experience, contract flexibility, and global capabilities.
Competition
International Business Machines — Investor Video Playlist





Industry Resources
| Information Technology Resources |
| TechCrunch |
| Wired |
| CIO |
| MIT Technology Review |
| Gartner Insights |
| Ars Technica |
| IT Consulting & Other Services Resources |
| IDC |
| Forrester |
| Consultancy.org |
External Quote Links
| Y Finance | Barrons |
| TradingView | Morningstar |
| SeekingAlpha | ValueLine |
| Motley Fool | Robinhood |
| CNBC | Etrade |
| MarketWatch | Unusual Whales |
| YCharts | Perplexity Finance |
| FinViz |
Prefer one of these to Trefis? Tell us why.