
Photronics (PLAB)
Market Price (11/9/2026): $27.75 | Market Cap: $1.6 BilSector: Information Technology | Industry: Semiconductor Materials & Equipment
Photronics (PLAB)
Market Price (11/9/2026): $27.75Market Cap: $1.6 BilSector: Information TechnologyIndustry: Semiconductor Materials & Equipment
Investment Highlights Why It Matters Detailed financial logic regarding cash flow yields vs trend-riding momentum.
Weak multi-year price returns2Y Excs Rtn is -11%, 3Y Excs Rtn is -26% | Key risksPLAB key risks include [1] a significant increase in capital expenditure projected for 2026, Show more. |
| Weak multi-year price returns2Y Excs Rtn is -11%, 3Y Excs Rtn is -26% |
| Key risksPLAB key risks include [1] a significant increase in capital expenditure projected for 2026, Show more. |
Qualitative Assessment
AI Analysis | Feedback
Photronics (PLAB) stock has lost about 10% since 7/31/2026 because of the following key factors:
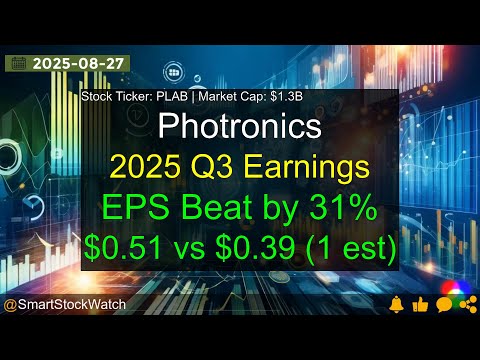
1. Moderated Fiscal Q4 2026 Guidance Despite Q3 Beat. Photronics reported strong fiscal Q3 2026 results on August 26, 2026, with non-GAAP diluted earnings per share (EPS) of $0.50, surpassing analyst estimates of $0.40, and revenue of $216.0 million, above forecasts of $208.75 million. However, the company's guidance for fiscal Q4 2026 projected non-GAAP diluted EPS between $0.40 and $0.56 per share. The midpoint of this guidance, approximately $0.48, indicated a potential sequential plateau or slight decline in earnings compared to the strong Q3 performance, which may have tempered investor enthusiasm following the initial post-earnings surge.
2. Weakness in the Flat Panel Display (FPD) Segment. While the Integrated Circuit (IC) segment showed strong performance, with revenue up 5% year-over-year and sequentially in fiscal Q3 2026 to $154.7 million, the Flat Panel Display (FPD) segment experienced a decline. FPD revenue for fiscal Q3 2026 was $61.4 million, reflecting a 2% decrease both year-over-year and sequentially. This underperformance in a key business segment likely contributed to investor concerns about the company's overall growth trajectory.
Show more
Photronics (PLAB) stock has lost about 10% since 7/31/2026 because of the following key factors:
1. Moderated Fiscal Q4 2026 Guidance Despite Q3 Beat. Photronics reported strong fiscal Q3 2026 results on August 26, 2026, with non-GAAP diluted earnings per share (EPS) of $0.50, surpassing analyst estimates of $0.40, and revenue of $216.0 million, above forecasts of $208.75 million. However, the company's guidance for fiscal Q4 2026 projected non-GAAP diluted EPS between $0.40 and $0.56 per share. The midpoint of this guidance, approximately $0.48, indicated a potential sequential plateau or slight decline in earnings compared to the strong Q3 performance, which may have tempered investor enthusiasm following the initial post-earnings surge.
2. Weakness in the Flat Panel Display (FPD) Segment. While the Integrated Circuit (IC) segment showed strong performance, with revenue up 5% year-over-year and sequentially in fiscal Q3 2026 to $154.7 million, the Flat Panel Display (FPD) segment experienced a decline. FPD revenue for fiscal Q3 2026 was $61.4 million, reflecting a 2% decrease both year-over-year and sequentially. This underperformance in a key business segment likely contributed to investor concerns about the company's overall growth trajectory.
3. Lingering Impact of Securities Class-Action Litigation. Photronics continued to face a securities class-action lawsuit throughout the specified period, alleging that executives concealed deteriorating customer demand and manufacturing bottlenecks impacting high-end semiconductor products. This litigation, which stemmed from a significant stock drop of over 36% in late May 2026 after a fiscal Q2 earnings and guidance miss, remained an active concern for investors. The lead plaintiff deadline for the lawsuit was September 4, 2026, indicating unresolved legal risk and creating a persistent overhang on investor sentiment.
Show less
Stock Movement Drivers
Fundamental Drivers
nullnull
Market Drivers
7/31/2026 to 11/8/2026| Return | Correlation | |
|---|---|---|
| PLAB | -9.7% | |
| Market (SPY) | -1.6% | 52.9% |
| Sector (XLK) | -6.1% | 72.8% |
Fundamental Drivers
nullnull
Market Drivers
4/30/2026 to 11/8/2026| Return | Correlation | |
|---|---|---|
| PLAB | -44.7% | |
| Market (SPY) | 2.6% | 41.8% |
| Sector (XLK) | 3.4% | 54.1% |
Fundamental Drivers
nullnull
Market Drivers
10/31/2025 to 11/8/2026| Return | Correlation | |
|---|---|---|
| PLAB | 14.5% | |
| Market (SPY) | 8.7% | 44.6% |
| Sector (XLK) | 10.0% | 49.4% |
Fundamental Drivers
nullnull
Market Drivers
10/31/2023 to 11/8/2026| Return | Correlation | |
|---|---|---|
| PLAB | 49.0% | |
| Market (SPY) | 81.9% | 51.1% |
| Sector (XLK) | 104.5% | 54.4% |
Price Returns Compared
| 2021 | 2022 | 2023 | 2024 | 2025 | 2026 | Total [1] | |
|---|---|---|---|---|---|---|---|
| Returns | |||||||
| PLAB Return | 69% | -11% | 86% | -25% | 36% | -15% | 145% |
| Peers Return | 48% | -37% | 60% | 1% | 48% | 28% | 185% |
| S&P 500 Return | 27% | -19% | 24% | 23% | 16% | 12% | 105% |
Monthly Win Rates [3] | |||||||
| PLAB Win Rate | 58% | 42% | 50% | 25% | 50% | 55% | |
| Peers Win Rate | 65% | 32% | 65% | 47% | 60% | 53% | |
| S&P 500 Win Rate | 75% | 42% | 67% | 75% | 67% | 45% | |
Max Drawdowns [4] | |||||||
| PLAB Max Drawdown | -19% | -45% | -32% | -39% | -32% | -54% | |
| Peers Max Drawdown | -24% | -53% | -23% | -37% | -41% | -58% | |
| S&P 500 Max Drawdown | -5% | -25% | -10% | -8% | -19% | -9% | |
[1] Cumulative total returns since the beginning of 2021
[2] Peers: AMAT, KLAC, VECO, FORM, MKSI.
[3] Win Rate = % of calendar months in which monthly returns were positive
[4] Max drawdown represents maximum peak-to-trough decline within a year
[5] 2026 data is for the year up to 11/6/2026 (YTD)
How Low Can It Go
| Event | PLAB | S&P 500 |
|---|---|---|
| 2025 US Tariff Shock | ||
| % Loss | -26.0% | -18.8% |
| % Gain to Breakeven | 35.1% | 23.1% |
| Time to Breakeven | 89 days | 79 days |
| 2024 Yen Carry Trade Unwind | ||
| % Loss | -19.5% | -7.8% |
| % Gain to Breakeven | 24.2% | 8.5% |
| Time to Breakeven | 23 days | 18 days |
| Summer-Fall 2023 Five Percent Yield Shock | ||
| % Loss | -28.6% | -9.5% |
| % Gain to Breakeven | 40.0% | 10.5% |
| Time to Breakeven | 44 days | 24 days |
| 2023 SVB Regional Banking Crisis | ||
| % Loss | -22.4% | -6.7% |
| % Gain to Breakeven | 28.9% | 7.1% |
| Time to Breakeven | 28 days | 31 days |
| 2022 Inflation Shock & Fed Tightening | ||
| % Loss | -26.2% | -24.5% |
| % Gain to Breakeven | 35.5% | 32.4% |
| Time to Breakeven | 129 days | 427 days |
| 2020 COVID-19 Crash | ||
| % Loss | -42.1% | -33.7% |
| % Gain to Breakeven | 72.6% | 50.9% |
| Time to Breakeven | 531 days | 140 days |
In The Past
Photronics's stock fell -26.0% during the 2025 US Tariff Shock. Such a loss loss requires a 35.1% gain to breakeven.
Preserve Wealth
Limiting losses and compounding gains is essential to preserving wealth.
Asset Allocation
Actively managed asset allocation strategies protect wealth. Learn more.
| Event | PLAB | S&P 500 |
|---|---|---|
| 2025 US Tariff Shock | ||
| % Loss | -26.0% | -18.8% |
| % Gain to Breakeven | 35.1% | 23.1% |
| Time to Breakeven | 89 days | 79 days |
| Summer-Fall 2023 Five Percent Yield Shock | ||
| % Loss | -28.6% | -9.5% |
| % Gain to Breakeven | 40.0% | 10.5% |
| Time to Breakeven | 44 days | 24 days |
| 2023 SVB Regional Banking Crisis | ||
| % Loss | -22.4% | -6.7% |
| % Gain to Breakeven | 28.9% | 7.1% |
| Time to Breakeven | 28 days | 31 days |
| 2022 Inflation Shock & Fed Tightening | ||
| % Loss | -26.2% | -24.5% |
| % Gain to Breakeven | 35.5% | 32.4% |
| Time to Breakeven | 129 days | 427 days |
| 2020 COVID-19 Crash | ||
| % Loss | -42.1% | -33.7% |
| % Gain to Breakeven | 72.6% | 50.9% |
| Time to Breakeven | 531 days | 140 days |
| 2011 US Debt Ceiling Crisis & European Contagion | ||
| % Loss | -46.3% | -17.9% |
| % Gain to Breakeven | 86.3% | 21.8% |
| Time to Breakeven | 746 days | 123 days |
| 2010 Eurozone Sovereign Debt Crisis / Flash Crash | ||
| % Loss | -24.9% | -15.4% |
| % Gain to Breakeven | 33.1% | 18.2% |
| Time to Breakeven | 91 days | 125 days |
| 2008-2009 Global Financial Crisis | ||
| % Loss | -97.3% | -53.4% |
| % Gain to Breakeven | 3597.1% | 114.4% |
| Time to Breakeven | 4033 days | 1085 days |
| Summer 2007 Credit Crunch | ||
| % Loss | -26.0% | -8.6% |
| % Gain to Breakeven | 35.1% | 9.5% |
| Time to Breakeven | 4488 days | 47 days |
In The Past
Photronics's stock fell -26.0% during the 2025 US Tariff Shock. Such a loss loss requires a 35.1% gain to breakeven.
Preserve Wealth
Limiting losses and compounding gains is essential to preserving wealth.
Asset Allocation
Actively managed asset allocation strategies protect wealth. Learn more.
About Photronics (PLAB)
Photronics, Inc. (PLAB) is a global manufacturer and provider of photomask products and services. Photomasks are highly specialized components that serve as master templates, enabling the precise transfer of intricate circuit patterns onto various materials. These patterns are fundamental to the creation of the microscopic circuitry found in modern electronic devices.
The company's core products are essential for the production of integrated circuits (computer chips) and flat panel displays (FPDs). Photronics sells its photomasks primarily to major semiconductor manufacturers, designers, and foundries, as well as to flat panel display manufacturers and other producers of high-performance electronic components. The company operates and serves customers internationally, with significant market presence in regions such as the United States, Taiwan, Korea, Europe, and China.
AI Analysis | Feedback
Here are a few analogies for Photronics:
- The ASML of photomasks for chips and displays.
- The TSMC of patterning templates for electronics manufacturing.
AI Analysis | Feedback
- Photomasks: These products are crucial for transferring circuit patterns onto semiconductor wafers, flat panel display substrates, and other electrical and optical components during the manufacturing process of integrated circuits and flat panel displays.
AI Analysis | Feedback
Photronics, Inc. (PLAB) sells its products primarily to other companies.
Based on publicly available information, Photronics does not disclose the names of its specific major customers. Financial filings indicate that no single customer accounted for 10% or more of the company's consolidated net sales in recent fiscal years, suggesting a diversified customer base.
However, Photronics broadly identifies the categories of companies it serves as:
- Semiconductor manufacturers
- Flat Panel Display (FPD) manufacturers
- Designers (of integrated circuits and FPDs)
- Foundries (semiconductor foundries)
- Other high-performance electronics manufacturers
AI Analysis | Feedback
AI Analysis | Feedback
George Macricostas, Chief Executive Officer and Executive Chairman
Mr. Macricostas was appointed Chief Executive Officer in May 2025 and also serves as the Executive Chairman of the Board. He is described as a seasoned investor and entrepreneur. Photronics was founded by his father, Constantine (Deno) Macricostas, in 1969.
Eric Rivera, President and Chief Financial Officer
Mr. Rivera was appointed President effective January 12, 2026, while continuing in his role as Chief Financial Officer and principal financial officer. He was promoted to CFO in May 2024, having served as interim CFO since February 2024 and Chief Accounting Officer since 2020. Mr. Rivera joined Photronics in 2016 as Corporate Controller. Prior to Photronics, he held various positions in accounting and financial reporting at IBM and Thomson Reuters. He is a Certified Public Accountant (CPA) and holds a Bachelor of Science degree in Accounting from Mercy University.
Dr. Christopher J. Progler, Executive Vice President, Chief Technology Officer, and Strategic Planning
Dr. Progler joined Photronics in 2001 as Corporate Chief Scientist. He was named Vice President & Chief Technology Officer in 2004, took on Strategic Planning responsibilities in 2011, and was promoted to Executive Vice President in January 2020. He has over 30 years of experience in advanced photolithography and mask making, with previous employers including IBM, Texas Instruments, and ST Microelectronics. Dr. Progler is recognized for his contributions to lithographic sciences and was elected a Fellow of SPIE – The International Society of Optical Engineering in 2004. As of January 2, 2026, Dr. Progler is transitioning from his current role as part of a planned leadership transition and is considering an advisory engagement with the company.
Rui (Elie) Zhang, Chief Accounting Officer and Corporate Controller
Ms. Zhang was appointed Chief Accounting Officer and principal accounting officer effective January 12, 2026. She continues to serve as Corporate Controller, a position she has held since 2024, and previously served as Assistant Controller.
Todd Alesio, Senior Vice President and Chief Administrative Officer, Head of Global Human Resources
Mr. Alesio was appointed Senior Vice President and Chief Administrative Officer effective January 12, 2026. He also continues to serve as Head of Global Human Resources. Mr. Alesio joined Photronics in November 2024.
AI Analysis | Feedback
- Competitive Market Landscape, Technological Disruption, and Pricing Pressures: Photronics operates in a highly competitive industry, necessitating continuous innovation and significant capital investment in advanced manufacturing capabilities to maintain its market position. The rapid pace of technological change in the semiconductor and FPD sectors, including potential disruptive technologies or new fabrication methods, poses a constant threat to demand for photomasks. This competitive environment frequently leads to pricing pressures, which can strain the company's profit margins despite the need for substantial investment in cutting-edge technology.
- Cyclicality and Economic Uncertainties in the Microelectronics Industry: Photronics' business is inherently tied to the volatile microelectronics industry. Demand for photomasks is significantly influenced by overall economic conditions, trade tensions, and regulatory changes, as well as the cyclical nature of semiconductor and FPD manufacturing. Economic downturns or a slowdown in new product design and development by semiconductor or FPD manufacturers can lead to reduced demand for photomasks, directly impacting Photronics' revenue and profitability.
- Customer and Geographic Concentration, coupled with Geopolitical Tensions: The company faces risks due to its dependency on a limited number of significant customers and its substantial international operations, with a considerable portion of revenue derived from non-U.S. markets, particularly Taiwan. The loss of a major customer or a significant reduction in orders could materially impact revenues. Furthermore, ongoing geopolitical tensions, such as the U.S.-China technology rivalry and potential conflicts involving Taiwan, a critical manufacturing hub, pose significant risks by disrupting supply chains and potentially limiting market access.
AI Analysis | Feedback
AI Analysis | Feedback
Photronics (PLAB) operates within the global photomask market, which is segmented by its primary applications in integrated circuit (IC) and flat panel display (FPD) manufacturing.
The global photomask market is projected to reach approximately USD 6.463 billion in 2026.
-
Photomasks for Integrated Circuits (ICs): The addressable market for photomasks used in semiconductor chip manufacturing is approximately 72% of the total global photomask market. Based on the 2026 projected market size, this equates to an addressable market of approximately USD 4.65 billion globally.
-
Photomasks for Flat Panel Displays (FPDs): The addressable market for photomasks used in flat panel display fabrication accounts for approximately 18% of the global photomask market. Based on the 2026 projected market size, this represents an addressable market of approximately USD 1.16 billion globally.
AI Analysis | Feedback
Photronics (PLAB) is expected to experience future revenue growth over the next 2-3 years, driven by several key factors:
- Surging Demand for High-End Integrated Circuits (IC), Driven by AI and Advanced Computing: Photronics is strategically positioned to benefit from the increasing global demand for high-performance computing and artificial intelligence (AI) chips. The company's expertise in manufacturing advanced photomasks for leading-edge nodes, such as 7nm, 5nm, and future 6-8nm, as well as 28nm and below, enables it to capture higher-margin business within the integrated circuit segment. This has already resulted in record high-end IC revenue, a trend anticipated to continue.
- Strategic Capital Investments and Capacity Expansion: The company is undergoing a period of elevated investment to expand and upgrade its manufacturing capacity, particularly for high-end photomasks in key regions like the United States and Korea. Photronics has outlined significant capital expenditures, estimated at approximately $330 million for fiscal year 2026, aimed at driving future organic growth. These investments also support semiconductor reshoring initiatives, with the Allen, Texas facility specifically mentioned to begin contributing revenue in the latter half of fiscal 2026.
- Growth in Advanced Flat Panel Display (FPD) Technologies: The Flat Panel Display segment is a significant contributor to Photronics' projected revenue growth. This is largely propelled by the increasing demand for advanced display technologies, especially high-end FPD products like AMOLED (Active-Matrix Organic Light-Emitting Diode) for both mobile devices and larger display formats (e.g., G8.6 and G10.5+ panels). Photronics is enhancing its capabilities in this area, including the installation of advanced mask writers for G8.6 AMOLED technology, which is expected to lead to richer pricing opportunities.
- Semiconductor Industry Regionalization and Reshoring Initiatives: The ongoing trend of regionalization and reshoring within the semiconductor industry, particularly in the United States, presents a favorable long-term driver for Photronics. The company's strategic investments in its U.S. facilities are in line with this trend, aiming to capitalize on localized semiconductor manufacturing efforts.
- Continuous Node Migration and New Chip Designs: A fundamental driver for photomask demand is the constant migration of customers to smaller design nodes (e.g., 22nm, 28nm, 32nm, and below) to achieve improved cost efficiencies and enhanced performance in their integrated circuits. Furthermore, the development of new designs and product roadmaps across both the IC and FPD segments consistently fuels the need for Photronics' photomask products.
AI Analysis | Feedback
Share Repurchases
- Photronics completed a multi-year share repurchase program totaling 12,646,808 shares for US$165.98 million, which was initiated on September 14, 2020.
- In fiscal 2025, Photronics utilized $97 million to repurchase 5 million shares at an average price of $19.52 per share.
- As of March 2026, $27.6 million remains under the existing share repurchase authorization.
Capital Expenditures
- Capital expenditures for the first quarter of fiscal 2026 were $47.6 million.
- Management anticipates approximately $330 million in capital expenditures for fiscal 2026, a significant increase from around $190 million in fiscal 2025.
- The primary focus of capital expenditures in fiscal 2026 is on expanding high-end and mainstream capacity in Asia (South Korea and China) and the U.S., including facility expansion and tool upgrades for node extension down to 8nm.
Peer Outperformance in Semiconductor Materials & Equipment
| Industry | Names | 1Y med | 3Y med | 5Y med | Top 3 by 5Y |
|---|---|---|---|---|---|
| Electronic Manufacturing Services | 10 | 5.5% | 95.7% | 165.0% | FLEX 430% · TTMI 366% · JBL 278% |
| Technology Distributors | 9 | 43.9% | 54.8% | 55.2% | AVT 128% · SNX 108% · PLUS 55% |
| Semiconductor Materials & Equipment ← | 28 | 26.7% | 42.8% | 31.2% | AXTI 317% · KLAC 252% · LRCX 246% |
| Communications Equipment | 36 | 1.6% | 72.1% | 27.1% | AAOI 757% · LITE 491% · ANET 419% |
| Electronic Components | 24 | 13.8% | 63.4% | 21.0% | CLS 1764% · BELFA 944% · APH 282% |
| Electronic Equipment & Instruments | 27 | -6.4% | 29.5% | 0.8% | PI 125% · OSIS 106% · MIR 61% |
| Semiconductors | 55 | 6.4% | 41.4% | -12.3% | MU 848% · NVDA 509% · AVGO 474% |
| Technology Hardware, Storage & Peripherals | 21 | 12.4% | 54.0% | -18.1% | DELL 552% · SMCI 539% · WDC 536% |
| Internet Services & Infrastructure | 6 | -7.1% | 42.9% | -29.6% | GDDY 60% · VRSN 35% · AKAM -24% |
| IT Consulting & Other Services | 30 | -17.8% | -7.3% | -29.9% | APLD 264% · IBM 138% · GIB -7% |
| Systems Software | 70 | -10.7% | 15.8% | -54.2% | CRWD 207% · ZETA 202% · CVLT 136% |
| Application Software | 125 | -12.3% | -10.8% | -54.7% | PLTR 500% · FROG 167% · AGYS 138% |
Latest Trefis Analyses
Research & Analysis
Invest in Strategies
Wealth Management
Peer Comparisons
| Peers to compare with: |
Financials
| Median | |
|---|---|
| Name | |
| Mkt Price | 110.85 |
| Mkt Cap | 13.2 |
| Rev LTM | 4,772 |
| Op Inc LTM | 915 |
| FCF LTM | 552 |
| FCF 3Y Avg | 505 |
| CFO LTM | 730 |
| CFO 3Y Avg | 647 |
Growth & Margins
| Median | |
|---|---|
| Name | |
| Rev Chg LTM | 15.8% |
| Rev Chg 3Y Avg | 8.5% |
| Rev Chg Q | 28.9% |
| QoQ Delta Rev Chg LTM | 6.8% |
| Op Inc Chg LTM | 18.2% |
| Op Inc Chg 3Y Avg | 18.6% |
| Op Mgn LTM | 20.4% |
| Op Mgn 3Y Avg | 15.8% |
| QoQ Delta Op Mgn LTM | 1.0% |
| CFO/Rev LTM | 26.2% |
| CFO/Rev 3Y Avg | 17.4% |
| FCF/Rev LTM | 18.2% |
| FCF/Rev 3Y Avg | 12.5% |
Price Behavior
| Market Price | $27.36 | |
| First Trading Date | 03/26/1990 | |
| Distance from 52W High | -50.2% | |
| 50 Days | 200 Days | |
| DMA Price | $28.87 | $35.24 |
| DMA Trend | down | down |
| Distance from DMA | -5.2% | -22.4% |
| 3M | 1YR | |
| Volatility | 43.9% | 83.6% |
| Downside Capture | 194.86 | 282.02 |
| Upside Capture | 157.95 | 276.93 |
| Correlation (S&P 500) | 49.4% | 44.0% |
| 1M | 2M | 3M | 6M | 1Y | 3Y | |
|---|---|---|---|---|---|---|
| Beta | 2.32 | 1.88 | 1.96 | 2.57 | 2.94 | 2.08 |
| Up Beta | -1.56 | 0.14 | 1.44 | 2.98 | 3.13 | 1.88 |
| Down Beta | 2.56 | 3.31 | 2.60 | 2.08 | 1.92 | 1.65 |
| Up Capture | 165% | 181% | 177% | 189% | 863% | 2912% |
| Bmk +ve Days | 12 | 18 | 28 | 62 | 130 | 427 |
| Stock +ve Days | 9 | 23 | 32 | 63 | 129 | 371 |
| Down Capture | 282% | 162% | 211% | 240% | 176% | 113% |
| Bmk -ve Days | 10 | 25 | 36 | 64 | 121 | 325 |
| Stock -ve Days | 13 | 20 | 32 | 63 | 122 | 375 |
[1] Upside and downside betas calculated using positive and negative benchmark daily returns respectively
Based On 1-Year Data
| Annualized Return | Annualized Volatility | Sharpe Ratio | Correlation with PLAB | |
|---|---|---|---|---|
| PLAB | 17.7% | 83.6% | 0.56 | - |
| Sector ETF (XLK) | 12.1% | 28.4% | 0.39 | 49.0% |
| Equity (SPY) | 9.5% | 13.6% | 0.40 | 44.1% |
| Gold (GLD) | 1.6% | 28.7% | 0.05 | 14.0% |
| Commodities (DBC) | 38.4% | 21.2% | 1.42 | -12.9% |
| Real Estate (VNQ) | 11.3% | 14.2% | 0.51 | 4.1% |
| Bitcoin (BTCUSD) | -27.2% | 43.6% | -0.61 | 21.3% |
Smart multi-asset allocation framework can stack odds in your favor. Learn How
Based On 5-Year Data
| Annualized Return | Annualized Volatility | Sharpe Ratio | Correlation with PLAB | |
|---|---|---|---|---|
| PLAB | 16.1% | 59.0% | 0.48 | - |
| Sector ETF (XLK) | 16.2% | 26.4% | 0.55 | 55.9% |
| Equity (SPY) | 11.3% | 17.3% | 0.48 | 52.5% |
| Gold (GLD) | 17.5% | 19.1% | 0.74 | 11.7% |
| Commodities (DBC) | 8.1% | 19.6% | 0.30 | 8.7% |
| Real Estate (VNQ) | 1.3% | 18.9% | -0.04 | 29.8% |
| Bitcoin (BTCUSD) | 4.0% | 51.6% | 0.26 | 24.1% |
Smart multi-asset allocation framework can stack odds in your favor. Learn How
Based On 10-Year Data
| Annualized Return | Annualized Volatility | Sharpe Ratio | Correlation with PLAB | |
|---|---|---|---|---|
| PLAB | 10.5% | 51.6% | 0.40 | - |
| Sector ETF (XLK) | 22.6% | 25.3% | 0.82 | 54.0% |
| Equity (SPY) | 15.0% | 18.0% | 0.70 | 51.9% |
| Gold (GLD) | 11.9% | 16.5% | 0.59 | 10.5% |
| Commodities (DBC) | 7.5% | 18.1% | 0.33 | 15.4% |
| Real Estate (VNQ) | 5.9% | 20.7% | 0.24 | 32.4% |
| Bitcoin (BTCUSD) | 60.0% | 66.3% | 1.00 | 15.5% |
Smart multi-asset allocation framework can stack odds in your favor. Learn How
Earnings Returns History
Updated 9/29/2026| Forward Returns | |||
|---|---|---|---|
| Earnings Date | 1D Returns | 5D Returns | 21D Returns |
| 8/26/2026 | 3.2% | -6.8% | 1.7% |
| 5/28/2026 | -36.4% | -40.0% | -42.6% |
| 2/25/2026 | 14.7% | -7.2% | 13.9% |
| 12/10/2025 | 45.4% | 33.7% | 29.7% |
| 8/27/2025 | 7.6% | -2.0% | 7.4% |
| 5/28/2025 | -15.6% | -11.2% | -5.1% |
| 2/26/2025 | 2.0% | -2.6% | 4.7% |
| 12/11/2024 | 10.8% | 3.6% | -6.7% |
| ... | |||
| SUMMARY STATS | |||
| # Positive | 12 | 7 | 11 |
| # Negative | 11 | 16 | 12 |
| Median Positive | 9.2% | 23.4% | 13.9% |
| Median Negative | -9.0% | -7.4% | -8.0% |
| Max Positive | 45.4% | 43.7% | 35.4% |
| Max Negative | -36.4% | -40.0% | -42.6% |
| Forward Returns | |||
|---|---|---|---|
| Earnings Date | 1D Returns | 5D Returns | 21D Returns |
| 8/26/2026 | 3.2% | -6.8% | 1.7% |
| 5/28/2026 | -36.4% | -40.0% | -42.6% |
| 2/25/2026 | 14.7% | -7.2% | 13.9% |
| 12/10/2025 | 45.4% | 33.7% | 29.7% |
| 8/27/2025 | 7.6% | -2.0% | 7.4% |
| 5/28/2025 | -15.6% | -11.2% | -5.1% |
| 2/26/2025 | 2.0% | -2.6% | 4.7% |
| 12/11/2024 | 10.8% | 3.6% | -6.7% |
| 8/30/2024 | -7.9% | -14.6% | -7.5% |
| 5/22/2024 | -6.9% | -5.4% | -11.7% |
| 2/21/2024 | -13.9% | -11.9% | -8.6% |
| 12/13/2023 | 21.3% | 41.5% | 34.0% |
| 5/24/2023 | 6.7% | 23.4% | 33.9% |
| 2/21/2023 | -9.0% | -1.3% | -6.2% |
| 12/13/2022 | 3.8% | -7.6% | -1.1% |
| 8/30/2022 | -23.6% | -29.0% | -31.6% |
| 5/25/2022 | 18.8% | 43.7% | 35.2% |
| 2/23/2022 | -7.1% | -4.4% | -7.5% |
| 12/8/2021 | 25.9% | 16.0% | 35.4% |
| 8/25/2021 | -0.3% | 10.7% | 4.0% |
| 5/26/2021 | -1.2% | -0.8% | 2.9% |
| 2/24/2021 | 3.4% | -8.7% | -9.3% |
| 12/9/2020 | -15.9% | -14.7% | -13.2% |
| SUMMARY STATS | |||
| # Positive | 12 | 7 | 11 |
| # Negative | 11 | 16 | 12 |
| Median Positive | 9.2% | 23.4% | 13.9% |
| Median Negative | -9.0% | -7.4% | -8.0% |
| Max Positive | 45.4% | 43.7% | 35.4% |
| Max Negative | -36.4% | -40.0% | -42.6% |
SEC Filings
Expand for More| Report Date | Filing Date | Filing |
|---|---|---|
| 07/31/2026 | 09/10/2026 | 10-Q |
| 04/30/2026 | 06/11/2026 | 10-Q |
| 01/31/2026 | 03/11/2026 | 10-Q |
| 10/31/2025 | 12/17/2025 | 10-K |
| 07/31/2025 | 09/09/2025 | 10-Q |
| 04/30/2025 | 06/11/2025 | 10-Q |
| 01/31/2025 | 03/13/2025 | 10-Q |
| 10/31/2024 | 12/19/2024 | 10-K |
| 07/31/2024 | 09/05/2024 | 10-Q |
| 04/30/2024 | 06/07/2024 | 10-Q |
| 01/31/2024 | 03/07/2024 | 10-Q |
| 10/31/2023 | 12/26/2023 | 10-K |
| 07/31/2023 | 09/07/2023 | 10-Q |
| 04/30/2023 | 06/08/2023 | 10-Q |
| 01/31/2023 | 03/09/2023 | 10-Q |
| 10/31/2022 | 12/23/2022 | 10-K |
| Report Date | Filing Date | Filing |
|---|---|---|
| 07/31/2026 | 09/10/2026 | 10-Q |
| 04/30/2026 | 06/11/2026 | 10-Q |
| 01/31/2026 | 03/11/2026 | 10-Q |
| 10/31/2025 | 12/17/2025 | 10-K |
| 07/31/2025 | 09/09/2025 | 10-Q |
| 04/30/2025 | 06/11/2025 | 10-Q |
| 01/31/2025 | 03/13/2025 | 10-Q |
| 10/31/2024 | 12/19/2024 | 10-K |
| 07/31/2024 | 09/05/2024 | 10-Q |
| 04/30/2024 | 06/07/2024 | 10-Q |
| 01/31/2024 | 03/07/2024 | 10-Q |
| 10/31/2023 | 12/26/2023 | 10-K |
| 07/31/2023 | 09/07/2023 | 10-Q |
| 04/30/2023 | 06/08/2023 | 10-Q |
| 01/31/2023 | 03/09/2023 | 10-Q |
| 10/31/2022 | 12/23/2022 | 10-K |
| 07/31/2022 | 09/07/2022 | 10-Q |
| 04/30/2022 | 06/15/2022 | 10-Q |
| 01/31/2022 | 03/10/2022 | 10-Q |
| 10/31/2021 | 12/17/2021 | 10-K |
| 07/31/2021 | 09/10/2021 | 10-Q |
| 04/30/2021 | 06/09/2021 | 10-Q |
| 01/31/2021 | 03/10/2021 | 10-Q |
| 10/31/2020 | 01/15/2021 | 10-K |
| 07/31/2020 | 09/10/2020 | 10-Q |
| 04/30/2020 | 06/12/2020 | 10-Q |
| 01/31/2020 | 03/11/2020 | 10-Q |
| 10/31/2019 | 12/23/2019 | 10-K |
Recent Forward Guidance
Updated 11/2/2026Latest: Q3 2026 Earnings Reported 8/26/2026
| Forward Guidance | Guidance Change | |||||||
|---|---|---|---|---|---|---|---|---|
| Metric | Source | Low | Mid | High | % Chg | % Delta | Change | Prior |
| Q4 2026 Revenue | Reported | 207.00 Mil | 217.00 Mil | 227.00 Mil | 2.8% | Higher New | Guidance: 211.00 Mil for Q3 2026 | |
| Q4 2026 Operating Margin | Reported | 19.0% | 21.5% | 24.0% | 2.5% | Higher New | Guidance: 19.0% for Q3 2026 | |
| Q4 2026 Non-GAAP Diluted EPS | Reported | 0.4 | 0.48 | 0.56 | 14.3% | Higher New | Guidance: 0.42 for Q3 2026 | |
Prior: Q2 2026 Earnings Reported 5/28/2026
| Forward Guidance | Guidance Change | |||||||
|---|---|---|---|---|---|---|---|---|
| Metric | Source | Low | Mid | High | % Chg | % Delta | Change | Prior |
| Q3 2026 Revenue | Reported | 207.00 Mil | 211.00 Mil | 215.00 Mil | -2.3% | Lower New | Guidance: 216.00 Mil for Q2 2026 | |
| Q3 2026 Operating Margin | Reported | 18.0% | 19.0% | 20.0% | ||||
| Q3 2026 Non-GAAP diluted EPS | Reported | 0.39 | 0.42 | 0.45 | -19.2% | Lower New | Guidance: 0.52 for Q2 2026 | |
Q1 2026 Earnings Reported 2/25/2026
| Forward Guidance | Guidance Change | |||||||
|---|---|---|---|---|---|---|---|---|
| Metric | Source | Low | Mid | High | % Chg | % Delta | Change | Prior |
| Q2 2026 Revenue | Reported | 212.00 Mil | 216.00 Mil | 220.00 Mil | -2.3% | Lower New | Guidance: 221.00 Mil for Q1 2026 | |
| Q2 2026 Non-GAAP Diluted EPS | Reported | 0.49 | 0.52 | 0.55 | -5.5% | -3.0% | Lower New | Guidance: 0.55 for Q1 2026 |
Q4 2025 Earnings Reported 12/10/2025
| Forward Guidance | Guidance Change | |||||||
|---|---|---|---|---|---|---|---|---|
| Metric | Source | Low | Mid | High | % Chg | % Delta | Change | Prior |
| Q1 2026 Revenue | Reported | 217.00 Mil | 221.00 Mil | 225.00 Mil | 7.8% | Higher New | Guidance: 205.00 Mil for Q4 2025 | |
| Q1 2026 Non-GAAP EPS | Reported | 0.51 | 0.55 | 0.59 | 22.2% | Higher New | Guidance: 0.45 for Q4 2025 | |
Insider Activity
Updated 10/2/2026| # | Owner | Title | Holding | Action | Filing Date | Price | Shares | Transacted Value | Value of Held Shares | Form |
|---|---|---|---|---|---|---|---|---|---|---|
| 1 | Lee, Kang Jyh | Direct | Sell | 10012026 | 30.75 | 10,000 | 307,500 | 10,373,512 | Form | |
| 2 | Park, Han Kyung | SVP & GM of FPD Ops | Direct | Sell | 9292026 | 30.37 | 9,500 | 288,515 | 2,004,420 | Form |
| 3 | Lee, Kang Jyh | Direct | Sell | 9282026 | 29.50 | 7,500 | 221,250 | 10,246,825 | Form | |
| 4 | Lee, Kang Jyh | Direct | Sell | 9242026 | 29.70 | 10,000 | 297,000 | 10,539,045 | Form | |
| 5 | Zhang, Rui | VP, CAO & Corporate Controller | Direct | Sell | 4212026 | 46.70 | 4,556 | 212,765 | 1,264,589 | Form |
| # | Owner | Title | Holding | Action | Filing Date | Price | Shares | Transacted Value | Value of Held Shares | Form |
|---|---|---|---|---|---|---|---|---|---|---|
| 1 | Lee, Kang Jyh | Direct | Sell | 10012026 | 30.75 | 10,000 | 307,500 | 10,373,512 | Form | |
| 2 | Park, Han Kyung | SVP & GM of FPD Ops | Direct | Sell | 9292026 | 30.37 | 9,500 | 288,515 | 2,004,420 | Form |
| 3 | Lee, Kang Jyh | Direct | Sell | 9282026 | 29.50 | 7,500 | 221,250 | 10,246,825 | Form | |
| 4 | Lee, Kang Jyh | Direct | Sell | 9242026 | 29.70 | 10,000 | 297,000 | 10,539,045 | Form | |
| 5 | Zhang, Rui | VP, CAO & Corporate Controller | Direct | Sell | 4212026 | 46.70 | 4,556 | 212,765 | 1,264,589 | Form |
| 6 | Lee, Kang Jyh | Direct | Sell | 4202026 | 45.92 | 20,000 | 918,500 | 16,342,411 | Form | |
| 7 | Lee, Kang Jyh | Direct | Sell | 4172026 | 45.10 | 10,000 | 451,000 | 16,950,835 | Form | |
| 8 | Lee, Kang Jyh | Direct | Sell | 4152026 | 45.00 | 5,000 | 225,000 | 17,363,250 | Form | |
| 9 | Rivera, Eric | President, CFO | Direct | Sell | 4152026 | 44.77 | 1,000 | 44,770 | 6,096,465 | Form |
| 10 | Wang, Hsueh-Chun | SVP/COO IC & US/EU Mnstrm Ops | Direct | Sell | 4132026 | 44.25 | 11,875 | 525,469 | 5,876,842 | Form |
| 11 | Rivera, Eric | President, CFO | Direct | Sell | 4132026 | 44.00 | 41,517 | 1,826,748 | 5,991,612 | Form |
| 12 | Lee, Kang Jyh | Direct | Sell | 4132026 | 44.00 | 5,000 | 220,000 | 16,977,400 | Form | |
| 13 | MacRicostas, George | CEO | Direct | Sell | 4102026 | 42.94 | 121,194 | 5,203,718 | 14,343,908 | Form |
| 14 | Zhang, Rui | VP, CAO & Corporate Controller | Direct | Sell | 4102026 | 43.50 | 1,752 | 76,212 | 1,376,122 | Form |
| 15 | Wang, Hsueh-Chun | SVP/COO IC & US/EU Mnstrm Ops | Direct | Sell | 4102026 | 42.69 | 10,000 | 426,900 | 6,176,603 | Form |
| 16 | Lee, Kang Jyh | Direct | Sell | 4102026 | 43.27 | 5,000 | 216,350 | 16,695,730 | Form | |
| 17 | Lee, Kang Jyh | Direct | Sell | 4082026 | 40.53 | 5,000 | 202,650 | 15,638,500 | Form | |
| 18 | Tyson, Mitchell G | Direct | Sell | 4032026 | 42.31 | 10,000 | 423,100 | 1,404,650 | Form | |
| 19 | Wang, Hsueh-Chun | SVP/COO IC & US/EU Mnstrm Ops | Direct | Sell | 4032026 | 42.08 | 10,000 | 420,831 | 6,509,626 | Form |
| 20 | Lee, Kang Jyh | Direct | Sell | 4032026 | 42.00 | 5,000 | 210,000 | 16,205,700 | Form | |
| 21 | Lee, Kang Jyh | Direct | Sell | 3302026 | 40.80 | 5,000 | 204,000 | 15,742,680 | Form | |
| 22 | Lee, Kang Jyh | Direct | Sell | 3232026 | 35.80 | 10,000 | 358,000 | 14,350,430 | Form | |
| 23 | Lee, Kang Jyh | Direct | Sell | 1202026 | 34.51 | 10,000 | 345,100 | 14,178,434 | Form | |
| 24 | Park, Han Kyung | SVP & GM of FPD Ops | Direct | Sell | 1202026 | 34.89 | 6,250 | 218,062 | 2,634,195 | Form |
| 25 | Park, Han Kyung | SVP & GM of FPD Ops | Direct | Sell | 1202026 | 33.70 | 7,500 | 252,750 | 2,754,975 | Form |
| 26 | Lee, Kang Jyh | Direct | Sell | 1162026 | 34.13 | 10,000 | 341,300 | 14,192,961 | Form | |
| 27 | Lee, Kang Jyh | Direct | Sell | 1152026 | 34.42 | 10,000 | 344,200 | 14,657,757 | Form | |
| 28 | Lee, Kang Jyh | Direct | Sell | 1142026 | 33.05 | 10,000 | 330,500 | 14,404,842 | Form | |
| 29 | Lee, Kang Jyh | Direct | Sell | 1092026 | 34.83 | 10,000 | 348,300 | 15,528,956 | Form | |
| 30 | Lee, Kang Jyh | Direct | Sell | 1062026 | 33.54 | 8,750 | 293,475 | 15,960,009 | Form | |
| 31 | Lee, Kang Jyh | Direct | Sell | 12232025 | 34.31 | 8,750 | 300,212 | 16,626,626 | Form | |
| 32 | Lee, Kang Jyh | Direct | Sell | 12162025 | 36.45 | 20,000 | 729,000 | 17,982,608 | Form | |
| 33 | Progler, Christopher J | EVP, Chief Technology Officer | Direct | Sell | 12162025 | 35.78 | 25,000 | 894,500 | 5,924,846 | Form |
| 34 | Tyson, Mitchell G | Direct | Sell | 12162025 | 36.17 | 5,000 | 180,850 | 1,697,350 | Form | |
| 35 | Park, Han Kyung | SVP & GM of FPD Ops | Direct | Sell | 12162025 | 37.99 | 13,750 | 522,362 | 3,390,608 | Form |
| 36 | Lee, Kang Jyh | Direct | Sell | 12162025 | 38.53 | 20,000 | 770,600 | 19,008,776 | Form | |
| 37 | Progler, Christopher J | EVP, Chief Technology Officer | Direct | Sell | 12022025 | 22.52 | 10,000 | 225,150 | 4,291,156 | Form |
| 38 | Tyson, Mitchell G | Direct | Sell | 10092025 | 25.04 | 5,000 | 125,200 | 1,300,252 | Form | |
| 39 | Lee, Kang Jyh | Direct | Sell | 10082025 | 25.33 | 10,000 | 253,300 | 13,003,156 | Form | |
| 40 | Paladino, Mary | Direct | Sell | 10062025 | 24.00 | 42,750 | 1,026,000 | 811,152 | Form |
Photronics — Investor Video Playlist



Industry Resources
| Information Technology Resources |
| TechCrunch |
| Wired |
| CIO |
| MIT Technology Review |
| Gartner Insights |
| Ars Technica |
| Semiconductor Materials & Equipment Resources |
| SEMI |
| Semiconductor Digest |
| Semiconductor Today |
External Quote Links
| Y Finance | Barrons |
| TradingView | Morningstar |
| SeekingAlpha | ValueLine |
| Motley Fool | Robinhood |
| CNBC | Etrade |
| MarketWatch | Unusual Whales |
| YCharts | Perplexity Finance |
| FinViz |
Prefer one of these to Trefis? Tell us why.