
Transocean (RIG)
Market Price (10/31/2026): $6.93 | Market Cap: $7.7 BilSector: Energy | Industry: Oil & Gas Drilling
Transocean (RIG)
Market Price (10/31/2026): $6.93Market Cap: $7.7 BilSector: EnergyIndustry: Oil & Gas Drilling
Investment Highlights Why It Matters Detailed financial logic regarding cash flow yields vs trend-riding momentum.
Attractive cash flow generationCFO/Rev LTMCash Flow from Operations / Revenue (Sales), Last Twelve Months (LTM) is 24%, FCF/Rev LTMFree Cash Flow / Revenue (Sales), Last Twelve Months (LTM) is 22% Attractive yieldFCF Yield is 12% Low stock price volatilityVol 12M is 50% Megatrend and thematic driversMegatrends include Global Energy Supply. Themes include Offshore Hydrocarbon Extraction Technology, and Deepwater Drilling Solutions. | Weak multi-year price returns3Y Excs Rtn is -84% | Debt is significantNet D/ENet Debt/Equity. Debt net of cash. Negative indicates net cash. Equity is taken as the Market Capitalization is 59% Weak revenue growthRev Chg QQuarterly Revenue Change % is -2.2% Yield minus risk free rate is negativeERPEquity Risk Premium (ERP) = Total Yield - Risk Free Rate, Reflects the premium above risk free assets offered by the investment. is -25% Significant short interestShort Interest % of Basic SharesShort Interest % of Basic Shares = (Short Interest Quantity) / (Basic Shares Outstanding). A high fraction of short interest can indicate potential risk of a short squeeze. is 28% Key risksRIG key risks include [1] a substantial debt load that limits its financial flexibility and [2] potential contract renegotiations and high rig operating costs that threaten revenue stability. |
| Attractive cash flow generationCFO/Rev LTMCash Flow from Operations / Revenue (Sales), Last Twelve Months (LTM) is 24%, FCF/Rev LTMFree Cash Flow / Revenue (Sales), Last Twelve Months (LTM) is 22% |
| Attractive yieldFCF Yield is 12% |
| Low stock price volatilityVol 12M is 50% |
| Megatrend and thematic driversMegatrends include Global Energy Supply. Themes include Offshore Hydrocarbon Extraction Technology, and Deepwater Drilling Solutions. |
| Weak multi-year price returns3Y Excs Rtn is -84% |
| Debt is significantNet D/ENet Debt/Equity. Debt net of cash. Negative indicates net cash. Equity is taken as the Market Capitalization is 59% |
| Weak revenue growthRev Chg QQuarterly Revenue Change % is -2.2% |
| Yield minus risk free rate is negativeERPEquity Risk Premium (ERP) = Total Yield - Risk Free Rate, Reflects the premium above risk free assets offered by the investment. is -25% |
| Significant short interestShort Interest % of Basic SharesShort Interest % of Basic Shares = (Short Interest Quantity) / (Basic Shares Outstanding). A high fraction of short interest can indicate potential risk of a short squeeze. is 28% |
| Key risksRIG key risks include [1] a substantial debt load that limits its financial flexibility and [2] potential contract renegotiations and high rig operating costs that threaten revenue stability. |
Qualitative Assessment
AI Analysis | Feedback
Transocean (RIG) stock has gained about 40% since 6/30/2026 because of the following key factors:
1. Strong Fiscal Q2 2026 Financial Results and Upgraded Outlook.
Transocean reported robust financial performance for its fiscal Q2 2026 on August 5, 2026, with an adjusted EPS of $0.03, significantly surpassing analysts' consensus estimate of $0.01. Quarterly revenue reached $966 million, exceeding estimates of $956.64 million. The company generated $212 million in free cash flow and demonstrated substantial progress in debt reduction, lowering net debt by $1.7 billion over 18 months to $4.3 billion by the end of fiscal Q2 2026. Management also provided an optimistic outlook, raising its 2026 revenue guidance and projecting a 61.11% increase in EPS for the next fiscal year.
2. Significant Contract Backlog Growth.
Since June 30, 2026, Transocean has announced substantial additions to its contract backlog, indicating strong future revenue streams and increasing demand for its specialized drilling services. During its fiscal Q2 2026 earnings report, the company announced $292 million in new contract backlog. More recently, by October 2026, the total backlog saw an increase of approximately $1.1 billion. This included the final approval of a multi-rig Equinor agreement worth over $1 billion and new contracts for two ultra-deepwater drillships in the U.S. Gulf, adding around $550 million in firm backlog starting in fiscal year 2027. As of May 4, 2026 (fiscal Q1 2026), the total backlog stood at approximately $7.1 billion.
Show more
Transocean (RIG) stock has gained about 40% since 6/30/2026 because of the following key factors:
1. Strong Fiscal Q2 2026 Financial Results and Upgraded Outlook.
Transocean reported robust financial performance for its fiscal Q2 2026 on August 5, 2026, with an adjusted EPS of $0.03, significantly surpassing analysts' consensus estimate of $0.01. Quarterly revenue reached $966 million, exceeding estimates of $956.64 million. The company generated $212 million in free cash flow and demonstrated substantial progress in debt reduction, lowering net debt by $1.7 billion over 18 months to $4.3 billion by the end of fiscal Q2 2026. Management also provided an optimistic outlook, raising its 2026 revenue guidance and projecting a 61.11% increase in EPS for the next fiscal year.
2. Significant Contract Backlog Growth.
Since June 30, 2026, Transocean has announced substantial additions to its contract backlog, indicating strong future revenue streams and increasing demand for its specialized drilling services. During its fiscal Q2 2026 earnings report, the company announced $292 million in new contract backlog. More recently, by October 2026, the total backlog saw an increase of approximately $1.1 billion. This included the final approval of a multi-rig Equinor agreement worth over $1 billion and new contracts for two ultra-deepwater drillships in the U.S. Gulf, adding around $550 million in firm backlog starting in fiscal year 2027. As of May 4, 2026 (fiscal Q1 2026), the total backlog stood at approximately $7.1 billion.
3. Proactive Debt Management and Improved Capital Structure.
Transocean actively worked to strengthen its balance sheet and improve its financial flexibility. In October 2026, the company successfully upsized its revolving credit facility to $750 million, extending its maturity to fiscal year 2031. Concurrently, Transocean redeemed $165 million of 8% notes, a move anticipated to reduce future interest expenses by approximately $22 million. This strategic debt management contributed to the reported net debt reduction of $1.7 billion over 18 months, reaching $4.3 billion by the end of fiscal Q2 2026.
4. Regulatory Clearance for Valaris Merger.
The proposed all-stock business combination between Transocean and Valaris received crucial regulatory clearances in Brazil and the U.S. during the specified period, setting the stage for an expected close in fiscal Q4 2026. This merger is expected to create a larger, more diversified fleet, enhancing Transocean's competitive position and operational scale in the offshore drilling market.
5. Favorable Macroeconomic Environment Driven by Rising Oil Prices.
A significant macroeconomic tailwind for Transocean was the substantial increase in crude oil prices, largely driven by geopolitical tensions. Brent crude prices surged from approximately $70 per barrel at the start of fiscal Q3 2026 to over $100 per barrel by October 2026, with some reports indicating peaks of $130 per barrel in September 2026 due to the US-Iran war and attacks on Middle Eastern energy infrastructure. These elevated oil prices typically incentivize increased offshore exploration and production, leading to higher demand for drilling rigs, improved utilization rates, and better dayrates for offshore contractors like Transocean.
Show less
Stock Movement Drivers
Fundamental Drivers
The 41.9% change in RIG stock from 6/30/2026 to 10/30/2026 was primarily driven by a 44.1% change in the company's P/S Multiple.| (LTM values as of) | 6302026 | 10302026 | Change |
|---|---|---|---|
| Stock Price ($) | 4.89 | 6.94 | 41.9% |
| Change Contribution By: | |||
| Total Revenues ($ Mil) | 4,140 | 4,118 | -0.5% |
| P/S Multiple | 1.3 | 1.9 | 44.1% |
| Shares Outstanding (Mil) | 1,109 | 1,120 | -1.0% |
| Cumulative Contribution | 41.9% |
Market Drivers
6/30/2026 to 10/30/2026| Return | Correlation | |
|---|---|---|
| RIG | 41.9% | |
| Market (SPY) | 1.2% | -5.8% |
| Sector (XLE) | 31.8% | 60.6% |
Fundamental Drivers
The 4.7% change in RIG stock from 3/31/2026 to 10/30/2026 was primarily driven by a 3.9% change in the company's Total Revenues ($ Mil).| (LTM values as of) | 3312026 | 10302026 | Change |
|---|---|---|---|
| Stock Price ($) | 6.63 | 6.94 | 4.7% |
| Change Contribution By: | |||
| Total Revenues ($ Mil) | 3,965 | 4,118 | 3.9% |
| P/S Multiple | 1.9 | 1.9 | 2.0% |
| Shares Outstanding (Mil) | 1,107 | 1,120 | -1.2% |
| Cumulative Contribution | 4.7% |
Market Drivers
3/31/2026 to 10/30/2026| Return | Correlation | |
|---|---|---|
| RIG | 4.7% | |
| Market (SPY) | 16.5% | -9.3% |
| Sector (XLE) | 15.1% | 58.9% |
Fundamental Drivers
The 122.4% change in RIG stock from 9/30/2025 to 10/30/2026 was primarily driven by a 158.5% change in the company's P/S Multiple.| (LTM values as of) | 9302025 | 10302026 | Change |
|---|---|---|---|
| Stock Price ($) | 3.12 | 6.94 | 122.4% |
| Change Contribution By: | |||
| Total Revenues ($ Mil) | 3,794 | 4,118 | 8.5% |
| P/S Multiple | 0.7 | 1.9 | 158.5% |
| Shares Outstanding (Mil) | 888 | 1,120 | -20.7% |
| Cumulative Contribution | 122.4% |
Market Drivers
9/30/2025 to 10/30/2026| Return | Correlation | |
|---|---|---|
| RIG | 122.4% | |
| Market (SPY) | 14.4% | 13.6% |
| Sector (XLE) | 60.3% | 55.7% |
Fundamental Drivers
The -15.5% change in RIG stock from 9/30/2023 to 10/30/2026 was primarily driven by a -32.1% change in the company's Shares Outstanding (Mil).| (LTM values as of) | 9302023 | 10302026 | Change |
|---|---|---|---|
| Stock Price ($) | 8.21 | 6.94 | -15.5% |
| Change Contribution By: | |||
| Total Revenues ($ Mil) | 2,675 | 4,118 | 53.9% |
| P/S Multiple | 2.3 | 1.9 | -19.2% |
| Shares Outstanding (Mil) | 761 | 1,120 | -32.1% |
| Cumulative Contribution | -15.5% |
Market Drivers
9/30/2023 to 10/30/2026| Return | Correlation | |
|---|---|---|
| RIG | -15.5% | |
| Market (SPY) | 82.9% | 33.4% |
| Sector (XLE) | 69.3% | 62.9% |
Price Returns Compared
| 2021 | 2022 | 2023 | 2024 | 2025 | 2026 | Total [1] | |
|---|---|---|---|---|---|---|---|
| Returns | |||||||
| RIG Return | 19% | 65% | 39% | -41% | 10% | 68% | 200% |
| Peers Return | 27% | 54% | 25% | -28% | -0% | 80% | 215% |
| S&P 500 Return | 27% | -19% | 24% | 23% | 16% | 13% | 106% |
Monthly Win Rates [3] | |||||||
| RIG Win Rate | 50% | 75% | 42% | 42% | 75% | 70% | |
| Peers Win Rate | 46% | 64% | 42% | 33% | 58% | 70% | |
| S&P 500 Win Rate | 75% | 42% | 67% | 75% | 67% | 50% | |
Max Drawdowns [4] | |||||||
| RIG Max Drawdown | -46% | -53% | -36% | -48% | -50% | -36% | |
| Peers Max Drawdown | -27% | -25% | -42% | -46% | -33% | ||
| S&P 500 Max Drawdown | -5% | -25% | -10% | -8% | -19% | -9% | |
[1] Cumulative total returns since the beginning of 2021
[2] Peers: NE, VAL, SDRL. See RIG Returns vs. Peers.
[3] Win Rate = % of calendar months in which monthly returns were positive
[4] Max drawdown represents maximum peak-to-trough decline within a year
[5] 2026 data is for the year up to 10/30/2026 (YTD)
How Low Can It Go
| Event | RIG | S&P 500 |
|---|---|---|
| 2025 US Tariff Shock | ||
| % Loss | -38.1% | -18.8% |
| % Gain to Breakeven | 61.5% | 23.1% |
| Time to Breakeven | 148 days | 79 days |
| 2023 SVB Regional Banking Crisis | ||
| % Loss | -23.3% | -6.7% |
| % Gain to Breakeven | 30.4% | 7.1% |
| Time to Breakeven | 110 days | 31 days |
| 2022 Inflation Shock & Fed Tightening | ||
| % Loss | -24.4% | -24.5% |
| % Gain to Breakeven | 32.2% | 32.4% |
| Time to Breakeven | 13 days | 427 days |
| 2020 COVID-19 Crash | ||
| % Loss | -80.4% | -33.7% |
| % Gain to Breakeven | 411.3% | 50.9% |
| Time to Breakeven | 317 days | 140 days |
| 2016-2017 Trump Reflation Bond Selloff | ||
| % Loss | -22.3% | -3.7% |
| % Gain to Breakeven | 28.6% | 3.9% |
| Time to Breakeven | 96 days | 6 days |
| 2015-2016 China Devaluation / Global Growth Scare | ||
| % Loss | -40.3% | -12.2% |
| % Gain to Breakeven | 67.5% | 13.9% |
| Time to Breakeven | 285 days | 62 days |
In The Past
Transocean's stock fell -38.1% during the 2025 US Tariff Shock. Such a loss loss requires a 61.5% gain to breakeven.
Preserve Wealth
Limiting losses and compounding gains is essential to preserving wealth.
Asset Allocation
Actively managed asset allocation strategies protect wealth. Learn more.
About Transocean (RIG)
Transocean Ltd. (RIG) is a global provider of offshore contract drilling services, specializing in the exploration and production of oil and gas wells. The company essentially acts as a critical service provider to the energy industry, owning and operating specialized equipment and experienced crews to perform complex drilling operations in various offshore environments.
The core of Transocean's business involves contracting out its advanced fleet of mobile offshore drilling rigs, along with associated equipment and skilled personnel, to energy companies worldwide. As of early 2022, its fleet comprised 37 drilling units, notable for their capabilities in ultra-deepwater and harsh environment conditions, including specialized floaters designed for extreme operational demands.
Transocean serves a diverse clientele within the energy sector, including major integrated energy companies, state-owned or government-controlled oil companies, and various independent energy firms. These clients rely on Transocean's expertise and equipment to access and extract oil and gas reserves located beneath the ocean floor.
AI Analysis | Feedback
Transocean is like United Rentals (URI) for giant offshore oil drilling rigs, complete with specialized crews.
Alternatively, they're like Fluor (FLR) or KBR (KBR), but exclusively providing services to drill oil and gas wells deep under the ocean using their own advanced fleet.
AI Analysis | Feedback
- Offshore Contract Drilling Services: Transocean provides specialized services for drilling oil and gas wells in offshore locations worldwide.
- Ultra-Deepwater Drilling Services: Utilizing its fleet of ultra-deepwater floaters, the company offers drilling solutions for extreme depths.
- Harsh Environment Drilling Services: Transocean provides drilling services designed for challenging and severe offshore conditions using its harsh environment floater rigs.
AI Analysis | Feedback
Transocean (RIG) primarily sells its offshore contract drilling services to other companies in the energy sector.
Based on their 2023 revenues, Transocean's major customers include:
- TotalEnergies (NYSE: TTE)
- Shell (NYSE: SHEL)
- Chevron (NYSE: CVX)
AI Analysis | Feedback
- National Oilwell Varco (NYSE: NOV)
- Schlumberger (NYSE: SLB)
- Seatrium Limited (SGX: 5E2)
AI Analysis | Feedback
Keelan Adamson, President and Chief Executive Officer
Keelan Adamson joined Transocean in 1995 and has held various executive positions including President and Chief Operating Officer (March 2022 - April 2025), Executive Vice President and Chief Operations Officer (August 2018 - February 2022), and Senior Vice President, Operations (October 2017 - July 2018). His responsibilities have encompassed Engineering and Technical Services, Major Capital Projects, Human Resources, and serving as the Managing Director for the company's business in North America, Canada, and Trinidad. Mr. Adamson earned a Bachelor's degree in Aeronautical Engineering from Queen's University Belfast and completed the Advanced Management Program at Harvard Business School. He has over 30 years of experience at Transocean.
R. Thaddeus Vayda, Executive Vice President and Chief Financial Officer
R. Thaddeus Vayda assumed the role of Executive Vice President and Chief Financial Officer for Transocean, effective May 1, 2024, succeeding Mark Mey.
Jeremy D. Thigpen, Chair of the Board of Directors
Jeremy D. Thigpen became the Chair of the Board of Directors following the 2025 Annual General Meeting, transitioning from his role as Chief Executive Officer, which he held since 2015. Prior to joining Transocean, Mr. Thigpen spent 18 years at National Oilwell Varco (NOV), where he served as Senior Vice President and Chief Financial Officer from 2012 to 2015. His tenure at NOV also included leadership roles as President of the Downhole and Pumping Solutions business (2007-2012) and President of the Downhole Tools group (2003-2007). He also held various management and business development capacities at NOV, including Director of Business Development and Special Assistant to the Chairman. He is currently a Director at Sunnova International Inc. and a Trustee at Rice University.
Roddie Mackenzie, Executive Vice President and Chief Commercial Officer
Roddie Mackenzie has served as Executive Vice President and Chief Commercial Officer at Transocean since February 2022. He began his career in the energy sector as a rig-based engineer in 1997 with Sedco Forex, which later merged with Transocean in 1999. Since joining Transocean, he has held various senior leadership positions, including Senior Vice President of Marketing, Innovation and Industry Relations, and Managing Director of Business Development, with responsibilities across global regions. Before joining Transocean, he was a Marketing & Sales Manager at ODS International. Mr. Mackenzie currently serves as Chairman of the International Association of Drilling Contractors.
Paul Johnson, Executive Vice President, Operations
Paul Johnson was appointed Executive Vice President, Operations for Transocean in March 2026. He commenced his career with Transocean in 1990 as a roustabout in the North Sea. Over his extensive career with the company, he progressed through various offshore roles before moving into shore-based management as a Rig Manager. He has held senior management positions in Corporate Planning, Human Resources, and Global Operations, including serving as Operations Director in both the United States and Brazil.
AI Analysis | Feedback
The key risks to Transocean's (RIG) business are primarily financial, operational, and regulatory, reflecting the inherent challenges of the offshore drilling industry and broader energy market dynamics.
- Financial Risks from High Debt and Volatile Oil & Gas Prices
Transocean faces significant financial risks due to its substantial debt load and below-investment-grade credit ratings, which can constrain its access to capital and increase borrowing costs. The company's profitability and demand for its drilling services are highly susceptible to fluctuations in global oil and natural gas prices, operating within a cyclical and competitive offshore drilling industry. Prolonged periods of low commodity prices can lead to decreased demand and lower day rates for its rigs, directly impacting financial performance. - Operational Risks Associated with Offshore Drilling
The nature of offshore drilling inherently involves significant operational hazards, including the potential for accidents, blowouts, explosions, fires, and equipment failures. Furthermore, operations are subject to extreme weather conditions such as hurricanes and storms, which can cause equipment damage, operational delays, and pose safety risks to personnel. Maintaining and reactivating its fleet of specialized drilling units also requires substantial ongoing capital and operating expenditures. - Regulatory and Energy Transition Risks
Transocean operates under an increasingly complex and stringent regulatory environment, particularly concerning environmental and safety standards. Evolving regulations can lead to higher compliance costs and operational restrictions. A longer-term risk stems from the global energy transition, which involves a growing emphasis on renewable energy sources and efforts to discourage investments in fossil fuel companies. This shift could negatively impact the future demand for offshore drilling services and potentially affect the company's stock price and access to capital markets.
AI Analysis | Feedback
AI Analysis | Feedback
Addressable Markets for Transocean (RIG)
The addressable market for Transocean's main products and services, which include offshore contract drilling services for oil and gas wells, can be primarily assessed through the global offshore drilling market and, more specifically, the deepwater and ultra-deepwater drilling market, where Transocean specializes.
Global Offshore Drilling Market
The global offshore drilling market was valued at approximately USD 43.78 billion in 2025. This market is projected to grow significantly, reaching an estimated USD 87.50 billion by 2034, exhibiting a Compound Annual Growth Rate (CAGR) of 7.87% during the forecast period.
Global Deepwater and Ultra-Deepwater Drilling Market
Given Transocean's focus on ultra-deepwater and harsh environment floaters, the global deepwater and ultra-deepwater drilling market represents a key specialized addressable market. This market was valued at approximately USD 15.9 billion in 2024 and is projected to reach USD 19.8 billion by 2030, growing at a CAGR of 3.8%.
AI Analysis | Feedback
- Strong and Expanding Contract Backlog: Transocean benefits from a substantial contract backlog, which provides significant revenue visibility for the coming years. As of February 2026, the total backlog was approximately $6.1 billion, with recent fixtures adding an incremental backlog of about $610 million. The company expects $3.8-$3.95 billion in 2026 contract drilling revenues, with roughly 89% already secured under firm contracts.
- Increasing Demand and Utilization for High-Specification Rigs: The demand for Transocean's specialized ultra-deepwater and harsh-environment rigs is strengthening. Global ultra-deepwater fleet utilization is anticipated to exceed 90% by 2027, with the market expected to tighten by late 2026 and early 2027. This growing demand is driven by the need of energy companies to replace reserves and a strategic shift towards reliable hydrocarbon sources, positioning Transocean to capitalize on global ultra-deepwater tenders.
- Rising Dayrates for Drilling Rigs: Dayrates, the daily rental rates for drilling rigs, have been on an upward trajectory. The tightening market and increased demand for high-specification rigs are expected to continue driving day rates higher. For example, Transocean has secured contracts with average daily revenues around $461,000, and some high-specification rigs command day rates exceeding $500,000.
- Strategic Acquisition of Valaris: The recently announced definitive agreement to combine with Valaris is a transformative event. This merger is expected to create an expanded fleet of best-in-class, high-specification rigs and an industry-leading combined backlog of approximately $10 billion to $11 billion. This significantly increases Transocean's market reach and is anticipated to generate substantial cost synergies.
- Improved Rig Utilization and Operational Efficiency: Transocean is focused on maximizing the operational time of its fleet. The company delivered strong operational performance, achieving a fleet-wide revenue efficiency of 96.5% for the full year 2025 and 98% uptime in Q4 2025. Continued efforts in operational efficiency and cost reductions, including a planned $150 million decrease in costs in 2026, contribute to higher revenue conversion from its existing contracts.
AI Analysis | Feedback
Share Issuance
- Transocean experienced a significant increase in shares outstanding from 902 million in June 2025 to 1.1 billion in February 2026, indicating recent equity issuance or conversions.
- The company raised approximately $616 million in net proceeds from two common stock issuances in the second half of 2025, primarily used to address 2025 exchangeable bonds.
- In February 2026, Transocean entered into an agreement to acquire Valaris through an all-share exchange, with a ratio of 15.235 Transocean shares per Valaris share.
Outbound Investments
- In 2024, Transocean acquired the remaining 67.0% ownership interest in Orion Holdings (Cayman) Limited, which owned the harsh environment floater Transocean Norge, for an aggregate fair value of $431 million, paid via 55.5 million Transocean shares and $130 million in senior notes.
- In February 2023, Transocean acquired a noncontrolling interest in Global Sea Mineral Resources (GSR) through a $10 million cash contribution and an $85 million non-cash contribution of the ultra-deepwater floater Ocean Rig Olympia and related assets.
- In 2025, Transocean evolved its 2023 joint venture with Eneti by forming a more ambitious partnership to construct new, purpose-built offshore wind turbine installation vessels.
Capital Expenditures
- Capital expenditures were $11 million in Q3 2025 and $28 million in Q4 2025.
- Transocean’s capital expenditures peaked in 2022 at $717 million, but have since significantly declined, with the latest twelve months (LTM) as of May 1, 2025, showing $81 million.
- The company allocates resources towards technological investments, including an $85 million R&D investment for 2025, focused on developing proprietary systems like the Digital Rig platform and the Eco-Rig Initiative to reduce non-productive time, lower emissions, and modernize its fleet.
Peer Outperformance in Oil & Gas Drilling
| Industry | Names | 1Y med | 3Y med | 5Y med | Top 3 by 5Y |
|---|---|---|---|---|---|
| Oil & Gas Refining & Marketing | 11 | 95.5% | 132.3% | 353.5% | MPC 654% · VLO 503% · PBF 500% |
| Integrated Oil & Gas | 7 | 57.0% | 88.4% | 211.1% | IMO 361% · SU 275% · XOM 246% |
| Oil & Gas Storage & Transportation | 18 | 48.0% | 125.0% | 199.7% | INSW 975% · LPG 874% · TRGP 542% |
| Oil & Gas Drilling ← | 7 | 77.5% | 22.8% | 96.6% | VAL 199% · NE 130% · RIG 97% |
| Oil & Gas Equipment & Services | 33 | 28.1% | 32.2% | 81.4% | SEI 1004% · FTI 853% · TDW 620% |
| Oil & Gas Exploration & Production | 51 | 51.0% | 14.5% | 60.0% | BTE 1005% · PR 320% · CNQ 238% |
| Coal & Consumable Fuels | 14 | -31.6% | 3.7% | 40.4% | CNR 249% · CCJ 221% · UEC 107% |
Latest Trefis Analyses
| Title | Date | |
|---|---|---|
| DASHBOARDS | ||
| RIG Stock Surges 17% With A 6-day Winning Spree On New Contract Wins | 01/28/2026 | |
| Transocean Earnings Notes | 12/28/2026 | |
| Transocean Stock Surged 40%, Here's Why | 11/18/2025 | |
| Transocean vs Cal-Maine Foods: Which Is A Better Investment? | 08/18/2025 | |
| Transocean vs SM Energy: Which Is A Better Investment? | 08/18/2025 | |
| Transocean vs Helmerich & Payne: Which Is A Better Investment? | 08/18/2025 | |
| How Does Transocean Stock Stack Up Against Its Peers? | 08/13/2025 | |
| Transocean (RIG) Operating Cash Flow Comparison | 08/08/2025 | |
| ARTICLES | ||
| RIG: A Cash Gusher At A Marked-Down Price | 07/09/2026 | |
| Transocean Stock Surged 40%, Here’s Why | 11/18/2025 | |
| Buy Or Fear Transocean Stock? | 09/26/2025 | |
| RIG Lost 21% In A Month. History Suggests More Pain Is Possible. | 07/17/2025 | |
| What’s Happening With Transocean Stock? | 06/11/2025 |
Research & Analysis
Invest in Strategies
Wealth Management
Peer Comparisons
| Peers to compare with: |
Financials
| Median | |
|---|---|
| Name | |
| Mkt Price | 50.59 |
| Mkt Cap | 7.5 |
| Rev LTM | 2,568 |
| Op Inc LTM | 300 |
| FCF LTM | 36 |
| FCF 3Y Avg | 102 |
| CFO LTM | 554 |
| CFO 3Y Avg | 464 |
Growth & Margins
| Median | |
|---|---|
| Name | |
| Rev Chg LTM | -2.3% |
| Rev Chg 3Y Avg | 9.4% |
| Rev Chg Q | -5.5% |
| QoQ Delta Rev Chg LTM | -1.4% |
| Op Inc Chg LTM | 15.9% |
| Op Inc Chg 3Y Avg | 63.2% |
| Op Mgn LTM | 11.7% |
| Op Mgn 3Y Avg | 12.9% |
| QoQ Delta Op Mgn LTM | -0.8% |
| CFO/Rev LTM | 20.5% |
| CFO/Rev 3Y Avg | 15.3% |
| FCF/Rev LTM | 1.1% |
| FCF/Rev 3Y Avg | 2.0% |
Valuation
| Median | |
|---|---|
| Name | |
| Mkt Cap | 7.5 |
| P/S | 2.4 |
| P/Op Inc | 22.9 |
| P/EBIT | 19.0 |
| P/E | 76.8 |
| P/CFO | 9.1 |
| Total Yield | 2.4% |
| Dividend Yield | 0.0% |
| FCF Yield 3Y Avg | 1.6% |
| D/E | 0.2 |
| Net D/E | 0.2 |
Returns
| Median | |
|---|---|
| Name | |
| 1M Rtn | 24.8% |
| 3M Rtn | 23.5% |
| 6M Rtn | 2.2% |
| 12M Rtn | 75.4% |
| 3Y Rtn | 27.8% |
| 1M Excs Rtn | 23.8% |
| 3M Excs Rtn | 26.7% |
| 6M Excs Rtn | -4.9% |
| 12M Excs Rtn | 65.7% |
| 3Y Excs Rtn | -57.2% |
Comparison Analyses
Segment Financials
Revenue by Segment| $ Mil | 2025 | 2024 | 2023 | 2022 | 2021 |
|---|---|---|---|---|---|
| Contract drilling services | 3,965 | 3,524 | 2,832 | 2,575 | |
| Harsh environment floaters | 836 | ||||
| Ultra-deepwater floaters | 1,720 | ||||
| Total | 3,965 | 3,524 | 2,832 | 2,575 | 2,556 |
| $ Mil | 2004 | 1998 | 1997 |
|---|---|---|---|
| Transocean Drilling | 429 | ||
| Todco | -34 | ||
| Drilling Services Operation | 5 | 2 | |
| Mobile Units Operation | 485 | 242 | |
| Total | 395 | 490 | 244 |
| $ Mil | 2004 | 1998 | 1997 |
|---|---|---|---|
| Transocean Drilling | 10,758 | ||
| Drilling Services Operation | 91 | 80 | |
| Mobile Units Operation | 2,988 | 2,545 | |
| Total | 10,758 | 3,079 | 2,625 |
Price Behavior
| Market Price | $6.94 | |
| Market Cap ($ Bil) | 7.8 | |
| First Trading Date | 05/28/1993 | |
| Distance from 52W High | -8.4% | |
| 50 Days | 200 Days | |
| DMA Price | $5.76 | $5.86 |
| DMA Trend | up | up |
| Distance from DMA | 20.6% | 18.4% |
| 3M | 1YR | |
| Volatility | 45.1% | 49.5% |
| Downside Capture | -91.96 | -2.77 |
| Upside Capture | 54.10 | 65.02 |
| Correlation (S&P 500) | -1.2% | 10.9% |
| 1M | 2M | 3M | 6M | 1Y | 3Y | |
|---|---|---|---|---|---|---|
| Beta | -0.37 | -0.35 | -0.15 | -0.31 | 0.61 | 1.21 |
| Up Beta | -4.81 | -0.58 | 0.58 | -1.02 | -0.12 | 0.87 |
| Down Beta | -0.04 | 1.35 | 0.71 | 0.90 | 1.44 | 2.04 |
| Up Capture | -40% | -42% | -33% | -40% | 75% | 52% |
| Bmk +ve Days | 6 | 16 | 27 | 66 | 132 | 424 |
| Stock +ve Days | 8 | 20 | 32 | 60 | 135 | 362 |
| Down Capture | 122% | -43% | -98% | -14% | 33% | 105% |
| Bmk -ve Days | 16 | 26 | 37 | 60 | 120 | 328 |
| Stock -ve Days | 14 | 22 | 32 | 63 | 109 | 372 |
[1] Upside and downside betas calculated using positive and negative benchmark daily returns respectively
Based On 1-Year Data
| Annualized Return | Annualized Volatility | Sharpe Ratio | Correlation with RIG | |
|---|---|---|---|---|
| RIG | 81.6% | 49.5% | 1.36 | - |
| Sector ETF (XLE) | 63.0% | 22.3% | 2.10 | 55.7% |
| Equity (SPY) | 10.9% | 12.8% | 0.52 | 9.4% |
| Gold (GLD) | -2.0% | 28.6% | -0.08 | 14.3% |
| Commodities (DBC) | 48.2% | 20.6% | 1.79 | 35.3% |
| Real Estate (VNQ) | 10.2% | 13.7% | 0.45 | -0.3% |
| Bitcoin (BTCUSD) | -30.3% | 43.5% | -0.71 | 13.4% |
Smart multi-asset allocation framework can stack odds in your favor. Learn How
Based On 5-Year Data
| Annualized Return | Annualized Volatility | Sharpe Ratio | Correlation with RIG | |
|---|---|---|---|---|
| RIG | 13.0% | 60.7% | 0.44 | - |
| Sector ETF (XLE) | 23.4% | 25.5% | 0.80 | 67.3% |
| Equity (SPY) | 12.2% | 17.1% | 0.53 | 34.9% |
| Gold (GLD) | 16.2% | 19.0% | 0.68 | 12.5% |
| Commodities (DBC) | 9.2% | 19.5% | 0.35 | 49.4% |
| Real Estate (VNQ) | 0.9% | 18.9% | -0.06 | 23.8% |
| Bitcoin (BTCUSD) | 4.8% | 51.6% | 0.28 | 18.1% |
Smart multi-asset allocation framework can stack odds in your favor. Learn How
Based On 10-Year Data
| Annualized Return | Annualized Volatility | Sharpe Ratio | Correlation with RIG | |
|---|---|---|---|---|
| RIG | -3.8% | 74.2% | 0.27 | - |
| Sector ETF (XLE) | 11.5% | 29.6% | 0.42 | 65.2% |
| Equity (SPY) | 15.2% | 17.9% | 0.72 | 38.7% |
| Gold (GLD) | 11.4% | 16.5% | 0.56 | 4.9% |
| Commodities (DBC) | 8.2% | 18.1% | 0.37 | 47.3% |
| Real Estate (VNQ) | 5.3% | 20.7% | 0.21 | 27.7% |
| Bitcoin (BTCUSD) | 61.7% | 66.2% | 1.01 | 10.7% |
Smart multi-asset allocation framework can stack odds in your favor. Learn How
Returns Analyses
Earnings Returns History
Updated 10/14/2026| Forward Returns | |||
|---|---|---|---|
| Earnings Date | 1D Returns | 5D Returns | 21D Returns |
| 8/5/2026 | 0.4% | 10.9% | 17.1% |
| 5/4/2026 | -9.2% | -4.8% | -10.2% |
| 2/20/2026 | -2.0% | -0.6% | -0.9% |
| 10/29/2025 | 2.1% | 1.8% | 13.6% |
| 8/4/2025 | 3.6% | 3.6% | 6.4% |
| 4/28/2025 | -4.8% | -0.4% | 11.3% |
| 2/18/2025 | 0.6% | -5.7% | -9.3% |
| 10/30/2024 | 9.0% | 17.3% | 10.6% |
| ... | |||
| SUMMARY STATS | |||
| # Positive | 13 | 13 | 13 |
| # Negative | 11 | 11 | 11 |
| Median Positive | 3.6% | 8.2% | 13.6% |
| Median Negative | -4.8% | -4.8% | -9.3% |
| Max Positive | 20.9% | 48.6% | 190.3% |
| Max Negative | -10.8% | -13.1% | -22.3% |
| Forward Returns | |||
|---|---|---|---|
| Earnings Date | 1D Returns | 5D Returns | 21D Returns |
| 8/5/2026 | 0.4% | 10.9% | 17.1% |
| 5/4/2026 | -9.2% | -4.8% | -10.2% |
| 2/20/2026 | -2.0% | -0.6% | -0.9% |
| 10/29/2025 | 2.1% | 1.8% | 13.6% |
| 8/4/2025 | 3.6% | 3.6% | 6.4% |
| 4/28/2025 | -4.8% | -0.4% | 11.3% |
| 2/18/2025 | 0.6% | -5.7% | -9.3% |
| 10/30/2024 | 9.0% | 17.3% | 10.6% |
| 7/31/2024 | -5.7% | -13.1% | -18.1% |
| 4/30/2024 | 1.0% | 9.6% | 13.0% |
| 2/20/2024 | -4.5% | -2.9% | 23.5% |
| 10/31/2023 | 0.5% | -1.8% | -3.9% |
| 7/31/2023 | -4.9% | -7.6% | -9.8% |
| 5/1/2023 | -3.7% | 1.0% | -3.9% |
| 2/21/2023 | -10.8% | 2.2% | -11.8% |
| 11/2/2022 | 15.2% | 6.6% | 16.1% |
| 8/1/2022 | 16.1% | 7.1% | 12.7% |
| 5/3/2022 | 8.0% | -12.5% | 3.5% |
| 2/22/2022 | 4.8% | 9.0% | 36.1% |
| 11/1/2021 | -1.9% | -1.1% | -22.3% |
| 8/2/2021 | -3.0% | -6.6% | -1.4% |
| 5/3/2021 | 2.4% | 13.8% | 32.6% |
| 2/22/2021 | -6.8% | 8.2% | -6.8% |
| 11/2/2020 | 20.9% | 48.6% | 190.3% |
| SUMMARY STATS | |||
| # Positive | 13 | 13 | 13 |
| # Negative | 11 | 11 | 11 |
| Median Positive | 3.6% | 8.2% | 13.6% |
| Median Negative | -4.8% | -4.8% | -9.3% |
| Max Positive | 20.9% | 48.6% | 190.3% |
| Max Negative | -10.8% | -13.1% | -22.3% |
SEC Filings
Expand for More| Report Date | Filing Date | Filing |
|---|---|---|
| 06/30/2026 | 08/07/2026 | 10-Q |
| 03/31/2026 | 05/05/2026 | 10-Q |
| 12/31/2025 | 02/23/2026 | 10-K |
| 09/30/2025 | 10/30/2025 | 10-Q |
| 06/30/2025 | 08/05/2025 | 10-Q |
| 03/31/2025 | 04/29/2025 | 10-Q |
| 12/31/2024 | 02/18/2025 | 10-K |
| 09/30/2024 | 10/31/2024 | 10-Q |
| 06/30/2024 | 08/01/2024 | 10-Q |
| 03/31/2024 | 04/30/2024 | 10-Q |
| 12/31/2023 | 02/21/2024 | 10-K |
| 09/30/2023 | 10/31/2023 | 10-Q |
| 06/30/2023 | 08/01/2023 | 10-Q |
| 03/31/2023 | 05/02/2023 | 10-Q |
| 12/31/2022 | 02/23/2023 | 10-K |
| 09/30/2022 | 11/04/2022 | 10-Q |
| Report Date | Filing Date | Filing |
|---|---|---|
| 06/30/2026 | 08/07/2026 | 10-Q |
| 03/31/2026 | 05/05/2026 | 10-Q |
| 12/31/2025 | 02/23/2026 | 10-K |
| 09/30/2025 | 10/30/2025 | 10-Q |
| 06/30/2025 | 08/05/2025 | 10-Q |
| 03/31/2025 | 04/29/2025 | 10-Q |
| 12/31/2024 | 02/18/2025 | 10-K |
| 09/30/2024 | 10/31/2024 | 10-Q |
| 06/30/2024 | 08/01/2024 | 10-Q |
| 03/31/2024 | 04/30/2024 | 10-Q |
| 12/31/2023 | 02/21/2024 | 10-K |
| 09/30/2023 | 10/31/2023 | 10-Q |
| 06/30/2023 | 08/01/2023 | 10-Q |
| 03/31/2023 | 05/02/2023 | 10-Q |
| 12/31/2022 | 02/23/2023 | 10-K |
| 09/30/2022 | 11/04/2022 | 10-Q |
| 06/30/2022 | 08/03/2022 | 10-Q |
| 03/31/2022 | 05/03/2022 | 10-Q |
| 12/31/2021 | 02/23/2022 | 10-K |
| 09/30/2021 | 11/02/2021 | 10-Q |
| 06/30/2021 | 08/03/2021 | 10-Q |
| 03/31/2021 | 05/04/2021 | 10-Q |
| 12/31/2020 | 03/01/2021 | 10-K |
| 09/30/2020 | 11/04/2020 | 10-Q |
| 06/30/2020 | 07/31/2020 | 10-Q |
| 03/31/2020 | 04/30/2020 | 10-Q |
| 12/31/2019 | 02/18/2020 | 10-K |
| 09/30/2019 | 10/30/2019 | 10-Q |
Recent Forward Guidance
Updated 10/26/2026Latest: Q2 2026 Earnings Reported 8/5/2026
| Forward Guidance | Guidance Change | |||||||
|---|---|---|---|---|---|---|---|---|
| Metric | Source | Low | Mid | High | % Chg | % Delta | Change | Prior |
| Q3 2026 General and administrative | Reported | 45.00 Mil | ||||||
| Q3 2026 Contract drilling revenues | Reported | 920.00 Mil | 940.00 Mil | 960.00 Mil | ||||
| Q3 2026 Revenue efficiency, fleet wide | Reported | 0.97 | ||||||
| Q3 2026 Operating and maintenance expense | Reported | 595.00 Mil | 610.00 Mil | 625.00 Mil | ||||
| Q3 2026 Interest expense | Reported | 113.00 Mil | ||||||
| Q3 2026 Interest income | Reported | 5.00 Mil | 7.50 Mil | 10.00 Mil | ||||
| Q3 2026 Cash taxes | Reported | 25.00 Mil | 27.50 Mil | 30.00 Mil | ||||
| Q3 2026 Capital expenditures | Reported | 40.00 Mil | 45.00 Mil | 50.00 Mil | ||||
| 2026 General and administrative | Reported | 170.00 Mil | 175.00 Mil | 180.00 Mil | 0.0% | Affirmed | Guidance: 175.00 Mil for 2026 | |
| 2026 Total liquidity | Reported | 1.25 Bil | 1.30 Bil | 1.35 Bil | 0.0% | Affirmed | Guidance: 1.30 Bil for 2026 | |
| 2026 Contract drilling revenues | Reported | 3.90 Bil | 3.94 Bil | 3.98 Bil | 2.3% | Raised | Guidance: 3.85 Bil for 2026 | |
| 2026 Revenue efficiency, fleet wide | Reported | 0.97 | ||||||
| 2026 Operating and maintenance expense | Reported | 2.33 Bil | 2.36 Bil | 2.40 Bil | 2.2% | Raised | Guidance: 2.31 Bil for 2026 | |
| 2026 Interest expense | Reported | 475.00 Mil | -22.1% | Lowered | Guidance: 610.00 Mil for 2026 | |||
| 2026 Interest income | Reported | 30.00 Mil | 32.50 Mil | 35.00 Mil | 18.2% | Raised | Guidance: 27.50 Mil for 2026 | |
| 2026 Cash taxes | Reported | 55.00 Mil | 57.50 Mil | 60.00 Mil | -20.7% | Lowered | Guidance: 72.50 Mil for 2026 | |
| 2026 Capital expenditures | Reported | 150.00 Mil | 0.0% | Affirmed | Guidance: 150.00 Mil for 2026 | |||
Prior: Q1 2026 Earnings Reported 5/4/2026
| Forward Guidance | Guidance Change | |||||||
|---|---|---|---|---|---|---|---|---|
| Metric | Source | Low | Mid | High | % Chg | % Delta | Change | Prior |
| Q2 2026 General and administrative | Reported | 40.00 Mil | 42.50 Mil | 45.00 Mil | -5.6% | Lower New | Guidance: 45.00 Mil for Q1 2026 | |
| Q2 2026 Contract drilling revenues | Reported | 930.00 Mil | 950.00 Mil | 970.00 Mil | -8.2% | Lower New | Guidance: 1.03 Bil for Q1 2026 | |
| Q2 2026 Operating and maintenance expense | Reported | 630.00 Mil | 645.00 Mil | 660.00 Mil | 4.9% | Higher New | Guidance: 615.00 Mil for Q1 2026 | |
| Q2 2026 Interest expense | Reported | 113.00 Mil | ||||||
| Q2 2026 Interest income | Reported | 5.00 Mil | 7.50 Mil | 10.00 Mil | ||||
| Q2 2026 Cash taxes | Reported | 30.00 Mil | ||||||
| Q2 2026 Capital expenditures | Reported | 30.00 Mil | 35.00 Mil | 40.00 Mil | -12.5% | Lower New | Guidance: 40.00 Mil for Q1 2026 | |
| 2026 General and administrative | Reported | 170.00 Mil | 175.00 Mil | 180.00 Mil | 0 | Affirmed | Guidance: 175.00 Mil for 2026 | |
| 2026 Total liquidity | Reported | 1.25 Bil | 1.30 Bil | 1.35 Bil | ||||
| 2026 Contract drilling revenues | Reported | 3.80 Bil | 3.85 Bil | 3.90 Bil | -0.6% | Lowered | Guidance: 3.88 Bil for 2026 | |
| 2026 Operating and maintenance expense | Reported | 2.25 Bil | 2.31 Bil | 2.38 Bil | 0 | Affirmed | Guidance: 2.31 Bil for 2026 | |
| 2026 Interest expense | Reported | 610.00 Mil | ||||||
| 2026 Interest income | Reported | 25.00 Mil | 27.50 Mil | 30.00 Mil | ||||
| 2026 Cash taxes | Reported | 70.00 Mil | 72.50 Mil | 75.00 Mil | ||||
| 2026 Capital expenditures | Reported | 150.00 Mil | 15.4% | Raised | Guidance: 130.00 Mil for 2026 | |||
Insider Activity
Updated 7/7/2026| # | Owner | Title | Holding | Action | Filing Date | Price | Shares | Transacted Value | Value of Held Shares | Form |
|---|---|---|---|---|---|---|---|---|---|---|
| 1 | Deaton, Chad C | Direct | Buy | 7072026 | 4.95 | 35,000 | 173,250 | 1,175,234 | Form | |
| 2 | Long, Brady K | EVP & Chief Legal Officer | Direct | Sell | 5222026 | 7.45 | 81,741 | 608,970 | 8,384,513 | Form |
| 3 | MacKenzie, Roderick James | EVP, Chief Commercial Officer | Direct | Sell | 3052026 | 6.36 | 78,370 | 498,433 | 1,704,639 | Form |
| 4 | Adamson, Keelan | PRESIDENT AND CEO | Direct | Sell | 1282026 | 5.00 | 58,687 | 293,435 | 6,110,910 | Form |
| 5 | Long, Brady K | EVP & Chief Legal Officer | Direct | Sell | 1282026 | 5.00 | 99,293 | 496,465 | 5,230,155 | Form |
| # | Owner | Title | Holding | Action | Filing Date | Price | Shares | Transacted Value | Value of Held Shares | Form |
|---|---|---|---|---|---|---|---|---|---|---|
| 1 | Deaton, Chad C | Direct | Buy | 7072026 | 4.95 | 35,000 | 173,250 | 1,175,234 | Form | |
| 2 | Long, Brady K | EVP & Chief Legal Officer | Direct | Sell | 5222026 | 7.45 | 81,741 | 608,970 | 8,384,513 | Form |
| 3 | MacKenzie, Roderick James | EVP, Chief Commercial Officer | Direct | Sell | 3052026 | 6.36 | 78,370 | 498,433 | 1,704,639 | Form |
| 4 | Adamson, Keelan | PRESIDENT AND CEO | Direct | Sell | 1282026 | 5.00 | 58,687 | 293,435 | 6,110,910 | Form |
| 5 | Long, Brady K | EVP & Chief Legal Officer | Direct | Sell | 1282026 | 5.00 | 99,293 | 496,465 | 5,230,155 | Form |
| 6 | Adamson, Keelan | PRESIDENT AND CEO | Direct | Sell | 1282026 | 5.00 | 22,846 | 114,230 | 6,404,345 | Form |
| 7 | Long, Brady K | EVP & Chief Legal Officer | Direct | Sell | 1282026 | 5.00 | 16,085 | 80,425 | 5,726,620 | Form |
| 8 | Adamson, Keelan | PRESIDENT AND CEO | Direct | Sell | 12082025 | 4.50 | 57,968 | 260,856 | 5,866,718 | Form |
| 9 | Adamson, Keelan | PRESIDENT AND CEO | Direct | Sell | 12082025 | 4.50 | 8,469 | 38,110 | 6,127,574 | Form |
| 10 | MacKenzie, Roderick James | EVP, Chief Commercial Officer | Direct | Sell | 12052025 | 4.48 | 35,000 | 156,800 | 950,083 | Form |
| 11 | Vayda, Robert Thaddeus | EVP, Chief Financial Officer | Direct | Sell | 12012025 | 4.29 | 30,000 | 128,700 | 1,008,811 | Form |
| 12 | Thigpen, Jeremy D | Executive Chair | Direct | Sell | 12012025 | 4.32 | 500,000 | 2,160,000 | 9,228,483 | Form |
| 13 | Perestroika, (cyprus) Ltd | Direct | Buy | 11252025 | 4.02 | 1,500,000 | 6,030,000 | 388,231,074 | Form | |
| 14 | Perestroika | Perestroika (Cyprus) Ltd. | Buy | 11252025 | 4.02 | 1,500,000 | 6,030,000 | 388,231,074 | Form | |
| 15 | Mohn, Frederik Wilhelm | Perestroika (Cyprus) Ltd. | Buy | 11252025 | 4.02 | 1,500,000 | 6,030,000 | 388,231,074 | Form | |
| 16 | MacKenzie, Roderick James | EVP, Chief Commercial Officer | Direct | Sell | 11042025 | 3.86 | 53,769 | 207,548 | 953,698 | Form |
| 17 | Long, Brady K | EVP & Chief Legal Officer | Direct | Sell | 10282025 | 4.00 | 97,090 | 388,360 | 4,645,636 | Form |
| 18 | Adamson, Keelan | PRESIDENT AND CEO | Direct | Sell | 10282025 | 4.00 | 40,942 | 163,768 | 5,480,608 | Form |
| 19 | Perestroika, (cyprus) Ltd | Direct | Buy | 9302025 | 3.05 | 4,000,000 | 12,200,000 | 289,978,427 | Form | |
| 20 | Perestroika | Perestroika (Cyprus) Ltd. | Buy | 9302025 | 3.05 | 4,000,000 | 12,200,000 | 289,978,427 | Form | |
| 21 | Mohn, Frederik Wilhelm | Perestroika (Cyprus) Ltd. | Buy | 9302025 | 3.05 | 4,000,000 | 12,200,000 | 289,978,427 | Form |
Investor Activity (13F)
Updated Oct 31, 2026Active managers (13F portfolio over $250M, at least 3 holdings) with a position over $5M that is either over 10% of their portfolio or held in a concentrated book of 50 or fewer total positions. Index/ETF, sovereign, bank, community-bank and charitable/donor-advised filers are excluded.
| Active Manager | Value | % of Portfolio | Total Positions | QoQ | Filing |
|---|---|---|---|---|---|
| Dalal Street, LLC | $135.2 Mil | 32.0% | 3 | TRIM -24.6% | 13F |
| Pilgrim Global Advisors LLC | $158.5 Mil | 20.5% | 3 | TRIM -24.7% | 13F |
| Solus Alternative Asset Management LP | $29.6 Mil | 8.0% | 10 | Hold | 13F |
| Slate Path Capital LP | $199.3 Mil | 3.0% | 44 | New | 13F |
| Monolith Management Ltd | $6.4 Mil | 2.5% | 31 | New | 13F |
| Masters Capital Management LLC | $13.3 Mil | 2.0% | 44 | ADD +100.0% | 13F |
| Contrarius Group Holdings Ltd | $16.4 Mil | 0.9% | 47 | ADD +49.8% | 13F |
| Elliott Investment Management L.P. | $103.6 Mil | 0.7% | 19 | New | 13F |
| Active Manager | Value | % of Portfolio | Total Positions | QoQ | Filing |
|---|---|---|---|---|---|
| Slate Path Capital LP | $199.3 Mil | 3.0% | 44 | New | 13F |
| Elliott Investment Management L.P. | $103.6 Mil | 0.7% | 19 | New | 13F |
| Monolith Management Ltd | $6.4 Mil | 2.5% | 31 | New | 13F |
| Masters Capital Management LLC | $13.3 Mil | 2.0% | 44 | ADD +100.0% | 13F |
| Contrarius Group Holdings Ltd | $16.4 Mil | 0.9% | 47 | ADD +49.8% | 13F |
| Active Manager | Value | % of Portfolio | Total Positions | QoQ | Filing |
|---|---|---|---|---|---|
| Slate Path Capital LP | $199.3 Mil | 3.0% | 44 | New | 13F |
| Pilgrim Global Advisors LLC | $158.5 Mil | 20.5% | 3 | TRIM -24.7% | 13F |
| Dalal Street, LLC | $135.2 Mil | 32.0% | 3 | TRIM -24.6% | 13F |
| Elliott Investment Management L.P. | $103.6 Mil | 0.7% | 19 | New | 13F |
| Solus Alternative Asset Management LP | $29.6 Mil | 8.0% | 10 | Hold | 13F |
| Contrarius Group Holdings Ltd | $16.4 Mil | 0.9% | 47 | ADD +49.8% | 13F |
| Masters Capital Management LLC | $13.3 Mil | 2.0% | 44 | ADD +100.0% | 13F |
| Monolith Management Ltd | $6.4 Mil | 2.5% | 31 | New | 13F |
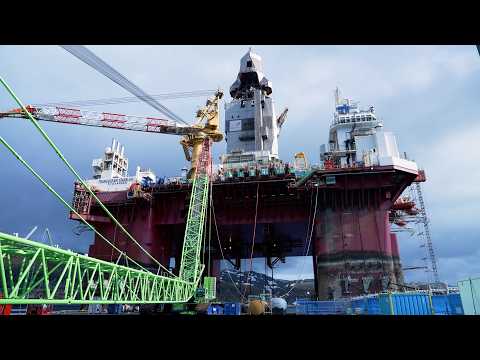
Transocean — Investor Video Playlist



Industry Resources
External Quote Links
| Y Finance | Barrons |
| TradingView | Morningstar |
| SeekingAlpha | ValueLine |
| Motley Fool | Robinhood |
| CNBC | Etrade |
| MarketWatch | Unusual Whales |
| YCharts | Perplexity Finance |
| FinViz |
Prefer one of these to Trefis? Tell us why.