
Chevron (CVX)
Market Price (11/6/2026): $213.21 | Market Cap: $416.0 BilInvestor Relations Sector: Energy | Industry: Integrated Oil & Gas
Chevron (CVX)
Market Price (11/6/2026): $213.21Market Cap: $416.0 BilSector: EnergyIndustry: Integrated Oil & Gas
Investment Highlights Why It Matters Detailed financial logic regarding cash flow yields vs trend-riding momentum.
Attractive yieldTotal YieldTotal Yield = Earnings Yield + Dividend Yield, Earnings Yield = Net Income / Market Cap Dividend Yield = Total Dividends / Market Cap is 9.8%, Dividend Yield is 3.3%, ERPEquity Risk Premium (ERP) = Total Yield - Risk Free Rate, Reflects the premium above risk free assets offered by the investment. is 4.5%, FCF Yield is 8.2% Strong revenue growthRev Chg LTMRevenue Change % Last Twelve Months (LTM) is 21% Attractive cash flow generationCFO/Rev LTMCash Flow from Operations / Revenue (Sales), Last Twelve Months (LTM) is 23%, FCF/Rev LTMFree Cash Flow / Revenue (Sales), Last Twelve Months (LTM) is 15%, CFO LTM is 52 Bil, FCF LTM is 34 Bil Stock buyback supportStock Buyback 3Y Total is 39 Bil Low stock price volatilityVol 12M is 25% Megatrend and thematic driversMegatrends include US Energy Independence, Energy Transition & Decarbonization, and Hydrogen Economy. Themes include US LNG, Show more. | Weak multi-year price returns3Y Excs Rtn is -18% | Key risksCVX key risks include [1] increasing regulatory pressures, Show more. |
| Attractive yieldTotal YieldTotal Yield = Earnings Yield + Dividend Yield, Earnings Yield = Net Income / Market Cap Dividend Yield = Total Dividends / Market Cap is 9.8%, Dividend Yield is 3.3%, ERPEquity Risk Premium (ERP) = Total Yield - Risk Free Rate, Reflects the premium above risk free assets offered by the investment. is 4.5%, FCF Yield is 8.2% |
| Strong revenue growthRev Chg LTMRevenue Change % Last Twelve Months (LTM) is 21% |
| Attractive cash flow generationCFO/Rev LTMCash Flow from Operations / Revenue (Sales), Last Twelve Months (LTM) is 23%, FCF/Rev LTMFree Cash Flow / Revenue (Sales), Last Twelve Months (LTM) is 15%, CFO LTM is 52 Bil, FCF LTM is 34 Bil |
| Stock buyback supportStock Buyback 3Y Total is 39 Bil |
| Low stock price volatilityVol 12M is 25% |
| Megatrend and thematic driversMegatrends include US Energy Independence, Energy Transition & Decarbonization, and Hydrogen Economy. Themes include US LNG, Show more. |
| Weak multi-year price returns3Y Excs Rtn is -18% |
| Key risksCVX key risks include [1] increasing regulatory pressures, Show more. |
Qualitative Assessment
AI Analysis | Feedback
Chevron (CVX) stock has gained about 10% since 7/31/2026 because of the following key factors:
1. Strong Fiscal Q3 2026 Earnings Beat and Robust Financials. Chevron reported adjusted earnings of $10.4 billion, or $5.28 per share, for fiscal Q3 2026, which ended September 30, 2026. This significantly exceeded analysts' consensus estimate of $4.89 per share. The company's net income attributable to Chevron nearly tripled to $9.92 billion compared to fiscal Q3 2025. Furthermore, Chevron demonstrated strong financial discipline, generating $16.0 billion in cash flow from operations and reducing total debt by $3.5 billion in the quarter.
2. Record Refining Operations and Elevated Global Oil Prices. Chevron's downstream segment achieved record U.S. refinery crude unit throughput of 1.09 million barrels per day with a utilization rate of nearly 98% in fiscal Q3 2026. This operational excellence, combined with higher margins on refined product sales, drove downstream earnings to $4.9 billion, a substantial increase from $1.1 billion in fiscal Q3 2025. Concurrently, the upstream segment benefited from a favorable commodity price environment, with the average Brent spot price at $97 a barrel during fiscal Q3 2026, up from $69 a year earlier, contributing to upstream earnings of $5.7 billion. Geopolitical tensions and tightness in global diesel markets further supported these elevated crude realizations and refining margins.
Show more
Chevron (CVX) stock has gained about 10% since 7/31/2026 because of the following key factors:
1. Strong Fiscal Q3 2026 Earnings Beat and Robust Financials. Chevron reported adjusted earnings of $10.4 billion, or $5.28 per share, for fiscal Q3 2026, which ended September 30, 2026. This significantly exceeded analysts' consensus estimate of $4.89 per share. The company's net income attributable to Chevron nearly tripled to $9.92 billion compared to fiscal Q3 2025. Furthermore, Chevron demonstrated strong financial discipline, generating $16.0 billion in cash flow from operations and reducing total debt by $3.5 billion in the quarter.
2. Record Refining Operations and Elevated Global Oil Prices. Chevron's downstream segment achieved record U.S. refinery crude unit throughput of 1.09 million barrels per day with a utilization rate of nearly 98% in fiscal Q3 2026. This operational excellence, combined with higher margins on refined product sales, drove downstream earnings to $4.9 billion, a substantial increase from $1.1 billion in fiscal Q3 2025. Concurrently, the upstream segment benefited from a favorable commodity price environment, with the average Brent spot price at $97 a barrel during fiscal Q3 2026, up from $69 a year earlier, contributing to upstream earnings of $5.7 billion. Geopolitical tensions and tightness in global diesel markets further supported these elevated crude realizations and refining margins.
3. Strategic Initiatives Driving Future Growth and Shareholder Returns. During fiscal Q3 2026, Chevron unveiled strategic plans to expand its presence in Venezuela, improving commercial terms and expanding acreage with the potential to more than double production to approximately 600,000 barrels per day by 2031 through a planned $7 billion investment. The company also demonstrated its commitment to shareholder returns by declaring a quarterly dividend of $1.78 per share, payable in December 2026. Additionally, positive analyst sentiment, including several upgraded price targets, reinforced investor confidence in Chevron's strategic direction and financial outlook.
Show less
Stock Movement Drivers
Fundamental Drivers
The 9.1% change in CVX stock from 7/31/2026 to 11/5/2026 was primarily driven by a 101.7% change in the company's Net Income Margin (%).| (LTM values as of) | 7312026 | 11052026 | Change |
|---|---|---|---|
| Stock Price ($) | 195.13 | 212.93 | 9.1% |
| Change Contribution By: | |||
| Total Revenues ($ Mil) | 185,887 | 225,779 | 21.5% |
| Net Income Margin (%) | 5.9% | 11.9% | 101.7% |
| P/E Multiple | 35.1 | 15.4 | -56.0% |
| Shares Outstanding (Mil) | 1,980 | 1,957 | 1.2% |
| Cumulative Contribution | 9.1% |
Market Drivers
7/31/2026 to 11/5/2026| Return | Correlation | |
|---|---|---|
| CVX | 9.1% | |
| Market (SPY) | -1.9% | -26.5% |
| Sector (XLE) | 3.5% | 94.4% |
Fundamental Drivers
The 12.1% change in CVX stock from 4/30/2026 to 11/5/2026 was primarily driven by a 79.2% change in the company's Net Income Margin (%).| (LTM values as of) | 4302026 | 11052026 | Change |
|---|---|---|---|
| Stock Price ($) | 189.90 | 212.93 | 12.1% |
| Change Contribution By: | |||
| Total Revenues ($ Mil) | 184,432 | 225,779 | 22.4% |
| Net Income Margin (%) | 6.7% | 11.9% | 79.2% |
| P/E Multiple | 30.7 | 15.4 | -49.8% |
| Shares Outstanding (Mil) | 1,991 | 1,957 | 1.8% |
| Cumulative Contribution | 12.1% |
Market Drivers
4/30/2026 to 11/5/2026| Return | Correlation | |
|---|---|---|
| CVX | 12.1% | |
| Market (SPY) | 2.3% | -36.1% |
| Sector (XLE) | 4.1% | 94.2% |
Fundamental Drivers
The 40.3% change in CVX stock from 10/31/2025 to 11/5/2026 was primarily driven by a 63.5% change in the company's Net Income Margin (%).| (LTM values as of) | 10312025 | 11052026 | Change |
|---|---|---|---|
| Stock Price ($) | 151.74 | 212.93 | 40.3% |
| Change Contribution By: | |||
| Total Revenues ($ Mil) | 187,736 | 225,779 | 20.3% |
| Net Income Margin (%) | 7.3% | 11.9% | 63.5% |
| P/E Multiple | 19.0 | 15.4 | -18.8% |
| Shares Outstanding (Mil) | 1,719 | 1,957 | -12.1% |
| Cumulative Contribution | 40.3% |
Market Drivers
10/31/2025 to 11/5/2026| Return | Correlation | |
|---|---|---|
| CVX | 40.3% | |
| Market (SPY) | 8.4% | -29.9% |
| Sector (XLE) | 43.0% | 91.5% |
Fundamental Drivers
The 65.6% change in CVX stock from 10/31/2023 to 11/5/2026 was primarily driven by a 94.1% change in the company's P/E Multiple.| (LTM values as of) | 10312023 | 11052026 | Change |
|---|---|---|---|
| Stock Price ($) | 128.55 | 212.93 | 65.6% |
| Change Contribution By: | |||
| Total Revenues ($ Mil) | 214,089 | 225,779 | 5.5% |
| Net Income Margin (%) | 14.1% | 11.9% | -15.2% |
| P/E Multiple | 8.0 | 15.4 | 94.1% |
| Shares Outstanding (Mil) | 1,867 | 1,957 | -4.6% |
| Cumulative Contribution | 65.6% |
Market Drivers
10/31/2023 to 11/5/2026| Return | Correlation | |
|---|---|---|
| CVX | 65.6% | |
| Market (SPY) | 81.3% | 20.5% |
| Sector (XLE) | 58.1% | 90.4% |
Price Returns Compared
| 2021 | 2022 | 2023 | 2024 | 2025 | 2026 | Total [1] | |
|---|---|---|---|---|---|---|---|
| Returns | |||||||
| CVX Return | 46% | 58% | -14% | 1% | 10% | 44% | 221% |
| Peers Return | 51% | 75% | 13% | -4% | 17% | 87% | 530% |
| S&P 500 Return | 27% | -19% | 24% | 23% | 16% | 12% | 105% |
Monthly Win Rates [3] | |||||||
| CVX Win Rate | 67% | 58% | 50% | 58% | 75% | 55% | |
| Peers Win Rate | 62% | 70% | 53% | 45% | 67% | 71% | |
| S&P 500 Win Rate | 75% | 42% | 67% | 75% | 67% | 45% | |
Max Drawdowns [4] | |||||||
| CVX Max Drawdown | -13% | -25% | -22% | -15% | -21% | -21% | |
| Peers Max Drawdown | -23% | -30% | -22% | -30% | -24% | -21% | |
| S&P 500 Max Drawdown | -5% | -25% | -10% | -8% | -19% | -9% | |
[1] Cumulative total returns since the beginning of 2021
[2] Peers: XOM, COP, MPC, VLO, PSX. See CVX Returns vs. Peers.
[3] Win Rate = % of calendar months in which monthly returns were positive
[4] Max drawdown represents maximum peak-to-trough decline within a year
[5] 2026 data is for the year up to 11/5/2026 (YTD)
How Low Can It Go
| Event | CVX | S&P 500 |
|---|---|---|
| 2025 US Tariff Shock | ||
| % Loss | -14.9% | -18.8% |
| % Gain to Breakeven | 17.6% | 23.1% |
| Time to Breakeven | 94 days | 79 days |
| Summer-Fall 2023 Five Percent Yield Shock | ||
| % Loss | -11.8% | -9.5% |
| % Gain to Breakeven | 13.4% | 10.5% |
| Time to Breakeven | 140 days | 24 days |
| 2023 SVB Regional Banking Crisis | ||
| % Loss | -10.3% | -6.7% |
| % Gain to Breakeven | 11.5% | 7.1% |
| Time to Breakeven | 97 days | 31 days |
| 2020 COVID-19 Crash | ||
| % Loss | -51.0% | -33.7% |
| % Gain to Breakeven | 104.2% | 50.9% |
| Time to Breakeven | 347 days | 140 days |
| Q4 2018 Fed Policy Error / Growth Scare | ||
| % Loss | -18.6% | -19.2% |
| % Gain to Breakeven | 22.9% | 23.8% |
| Time to Breakeven | 71 days | 105 days |
| 2015-2016 China Devaluation / Global Growth Scare | ||
| % Loss | -15.9% | -12.2% |
| % Gain to Breakeven | 18.9% | 13.9% |
| Time to Breakeven | 41 days | 62 days |
In The Past
Chevron's stock fell -14.9% during the 2025 US Tariff Shock. Such a loss loss requires a 17.6% gain to breakeven.
Preserve Wealth
Limiting losses and compounding gains is essential to preserving wealth.
Asset Allocation
Actively managed asset allocation strategies protect wealth. Learn more.
| Event | CVX | S&P 500 |
|---|---|---|
| 2020 COVID-19 Crash | ||
| % Loss | -51.0% | -33.7% |
| % Gain to Breakeven | 104.2% | 50.9% |
| Time to Breakeven | 347 days | 140 days |
| 2014-2016 Oil Price Collapse | ||
| % Loss | -43.6% | -6.8% |
| % Gain to Breakeven | 77.4% | 7.3% |
| Time to Breakeven | 479 days | 15 days |
| 2008-2009 Global Financial Crisis | ||
| % Loss | -38.1% | -53.4% |
| % Gain to Breakeven | 61.5% | 114.4% |
| Time to Breakeven | 642 days | 1085 days |
In The Past
Chevron's stock fell -14.9% during the 2025 US Tariff Shock. Such a loss loss requires a 17.6% gain to breakeven.
Preserve Wealth
Limiting losses and compounding gains is essential to preserving wealth.
Asset Allocation
Actively managed asset allocation strategies protect wealth. Learn more.
About Chevron (CVX)
Chevron Corporation (CVX) is a global integrated energy and chemicals company engaged in various stages of the energy value chain. It primarily operates through two core segments: Upstream, which focuses on the initial sourcing and production of energy resources, and Downstream, which processes and distributes refined products and chemicals to end-users.
The Upstream segment is responsible for the exploration, development, and production of crude oil and natural gas worldwide. This includes processing, liquefaction, and transportation of liquefied natural gas (LNG), as well as moving crude oil through an extensive pipeline network. This segment's main products are crude oil, natural gas, and LNG, primarily serving global energy markets, industrial users, and other energy companies.
Chevron's Downstream segment refines crude oil into a wide range of petroleum products such as gasoline, diesel, and jet fuel, which are then marketed to consumers and businesses. It also manufactures and sells lubricants, renewable fuels, and various commodity petrochemicals, including plastics and fuel additives. This segment caters to diverse markets including transportation, agriculture, industrial manufacturing, and everyday consumers.
AI Analysis | Feedback
Chevron is like ExxonMobil for global oil and gas.
Chevron is like Shell for integrated energy and chemicals.
AI Analysis | Feedback
- Crude Oil: Explored, developed, produced, and transported globally.
- Natural Gas: Explored, developed, produced, transported, stored, and marketed worldwide.
- Liquefied Natural Gas (LNG): Processed, liquefied, transported, and regasified for global energy markets.
- Petroleum Products: Refined from crude oil into fuels such as gasoline, diesel, and jet fuel.
- Lubricants: Manufactured and marketed for automotive, industrial, and marine applications.
- Renewable Fuels: Produced and marketed as part of its energy transition efforts.
- Commodity Petrochemicals and Plastics: Manufactured and marketed for diverse industrial uses.
- Fuel and Lubricant Additives: Produced and marketed to improve product performance.
- Gas-to-Liquids (GTL) Products: Manufactured from natural gas using advanced conversion technology.
- Energy Exploration & Production Services: Involves the discovery, development, and extraction of crude oil and natural gas reserves.
- Energy Transportation & Logistics Services: Provides transportation for crude oil, natural gas, LNG, and refined products through various networks.
- Natural Gas Marketing & Storage Services: Offers solutions for marketing and storing natural gas.
- Financial Services: Includes cash management and debt financing operations.
- Insurance Operations: Provides internal and external insurance-related services.
- Real Estate Activities: Involves the management and development of real estate assets.
AI Analysis | Feedback
Chevron Corporation (CVX) primarily operates in a business-to-business (B2B) model, serving a diverse global customer base across its integrated energy and chemicals operations. Due to the commodity nature of many of its products and its broad market reach, Chevron typically does not disclose a specific list of its major customers in its public filings. However, based on its business segments, Chevron's major customers generally include large companies in the following categories:
- Airlines: Major air carriers are significant purchasers of jet fuel. Examples of public companies in this category include Delta Air Lines, Inc. (DAL) and United Airlines Holdings, Inc. (UAL).
- Electric and Gas Utilities: These companies purchase natural gas and liquefied natural gas (LNG) for power generation, heating, and distribution. Examples of public utilities include PG&E Corporation (PCG) and Sempra Energy (SRE).
- Industrial and Chemical Manufacturers: Companies across various industrial sectors are buyers of petrochemicals, plastics for industrial uses, and fuel and lubricant additives. Examples of public companies in the chemical sector include Dow Inc. (DOW) and LyondellBasell Industries N.V. (LYB).
AI Analysis | Feedback
AI Analysis | Feedback
Michael K. Wirth
Chairman of the Board and Chief Executive Officer
Michael Wirth has served as Chairman and CEO of Chevron Corporation since 2018. He joined Chevron in 1982 as a design engineer and has held various leadership positions across the company's Downstream and Chemicals, Midstream and Development, and Global Supply and Trading operations over his more than four-decade career. Wirth holds a bachelor's degree in chemical engineering from the University of Colorado, Boulder. There is no information available to indicate that he founded or managed other companies, sold companies he was previously involved with to an acquirer, or has a pattern of managing companies backed by private equity firms.
Eimear P. Bonner
Vice President and Chief Financial Officer
Eimear P. Bonner became Chevron's Vice President and Chief Financial Officer on March 1, 2024. She is responsible for audit, controllership, investor relations, tax, and treasury activities worldwide. Bonner joined Chevron in 1998 as an offshore petroleum engineer in the United Kingdom. Her career at Chevron includes roles such as President of the Chevron Technical Center and Chief Technology Officer, and General Director of Tengizchevroil (TCO), a Chevron joint venture in Kazakhstan. She holds a bachelor's degree in chemical engineering from Queen's University Belfast and master's degrees in advanced chemical engineering and petroleum engineering from Imperial College, London. There is no information available to indicate that she founded or managed other companies, sold companies she was previously involved with to an acquirer, or has a pattern of managing companies backed by private equity firms.
Mark A. Nelson
Vice Chairman, Executive Vice President, Oil, Products & Gas
Mark A. Nelson is Vice Chairman and Executive Vice President of Oil, Products & Gas for Chevron Corporation. In this role, he is responsible for the entire value chain, focusing on integrated capital allocation, asset class excellence, and value chain optimization. Nelson joined Chevron U.S.A. Inc. in 1985 as an engineer and has held numerous leadership positions across various segments of the business, including executive vice president of Downstream & Chemicals, vice president of Midstream, Strategy & Policy, and president of International Products. He holds a bachelor's degree in civil engineering from California Polytechnic State University.
R. Hewitt Pate
Chief Legal Officer
R. Hewitt Pate has served as Vice President and General Counsel (Chief Legal Officer) of Chevron Corporation since 2009. He directs the company's worldwide legal affairs and is a member of its Executive Committee. Prior to joining Chevron, Pate was a partner at Hunton & Williams LLP, where he headed the firm's Global Competition practice. He also served as Assistant Attorney General for the Antitrust Division of the U.S. Department of Justice from 2003 to 2005, and as Deputy Assistant Attorney General from 2001 to 2003. He earned his bachelor's degree from the University of North Carolina and his law degree from the University of Virginia.
Kevin Lyon
Chief Strategy Officer
Kevin Lyon is the Chief Strategy Officer for Chevron Corporation, a position he assumed effective March 1, 2026. In this role, he leads the development of the company's enterprise strategy, overseeing capital allocation, enterprise portfolio optimization, and sustainability initiatives. Lyon joined Chevron in 1988 and has held senior leadership positions across downstream, midstream, and upstream operations in various international locations. Most recently, he led Chevron's integration of Hess. He holds a bachelor of science in electrical and electronic engineering from the University of Wyoming.
AI Analysis | Feedback
- Commodity Price Volatility: Chevron's financial performance is highly sensitive to fluctuations in the global prices of crude oil, natural gas, and natural gas liquids. Extended periods of low prices, driven by factors such as oversupply or reduced demand due to economic conditions and the energy transition, can significantly impact the company's earnings, cash flows, and capital expenditure programs.
- Geopolitical Tensions and Operational Disruptions: As a global energy company, Chevron's operations are exposed to geopolitical risks, including conflicts, civil unrest, and political instability in regions where it operates (e.g., the Middle East, Venezuela, Kazakhstan). These tensions can lead to supply chain disruptions, operational interruptions (such as the shutdown of facilities), and potential changes in regulatory environments, directly affecting production volumes and project economics.
- Energy Transition and Regulatory/Environmental Pressures: The accelerating global shift towards lower-carbon energy sources and increasing regulatory scrutiny on greenhouse gas emissions and climate change pose significant challenges. This includes the pressure to adopt cleaner energy solutions, comply with evolving environmental policies, and achieve ambitious ESG (Environmental, Social, and Governance) targets. Failure to adapt to these trends can result in increased operational costs, limitations on future development, and reputational damage.
AI Analysis | Feedback
Accelerated global energy transition and decarbonization efforts, driven by policy shifts, technological advancements in renewable energy and electric vehicles, and changing consumer and investor preferences, which threaten the long-term demand for Chevron's core fossil fuel products and associated infrastructure.
AI Analysis | Feedback
Chevron (symbol: CVX) operates in several large addressable markets for its main products and services:
- Crude Oil: The global crude oil market size is projected to reach approximately $3,188.67 billion in 2026. In terms of volume, the global crude oil market reached approximately 101.40 million barrels per day (MB/d) in 2025.
- Natural Gas: The global natural gas market size is estimated to be $1,591.93 billion in 2026.
- Refined Petroleum Products: The global refined petroleum products market size is projected to grow from $3,128.22 billion in 2025 to $3,254.8 billion in 2026. Asia-Pacific was the largest region in this market in 2025.
- Lubricants: The global lubricants market size was valued at USD 178.98 billion in 2025 and is projected to be worth USD 182.53 billion in 2026. Asia Pacific dominated the global lubricants market with a market share of 36.80% in 2025. The U.S. lubricants market is projected to reach an estimated value of USD 18.82 billion by 2032.
- Renewable Fuels: The global Renewable Fuel Market size is estimated at USD 136.66 billion in 2025 and is expected to reach USD 276.31 billion by 2030. Specifically, the global renewable diesel market was estimated at USD 25.8 billion in 2025, with a projection to reach USD 27.3 billion in 2026 and USD 57.9 billion by 2035. The North America renewable diesel market alone accounted for USD 12.4 billion in 2025.
- Petrochemicals and Plastics: The global petrochemical market size was calculated at USD 700.10 billion in 2025 and is predicted to increase from USD 743.50 billion in 2026 to approximately USD 1,257.50 billion by 2035. Asia Pacific dominated the petrochemicals market with a market share of 52.50% in 2025.
AI Analysis | Feedback
Here are 3-5 expected drivers of future revenue growth for Chevron (CVX) over the next 2-3 years:
- Increased Oil and Gas Production: Chevron anticipates increasing its overall oil and gas production by 2% to 3% annually through 2030, with a projected year-over-year production growth of 7% to 10% in 2026, excluding asset sales. This growth is expected from high-margin assets, particularly in the Permian Basin, where output is targeted to increase by 9% to 10% in 2025. Significant contributions are also expected from offshore projects in Guyana, the Gulf of America, and the Eastern Mediterranean.
- Hess Acquisition and Synergy Realization: The acquisition of Hess Corporation is a significant driver, projected to add approximately 465,000 barrels of oil equivalent per day (boe/d) to Chevron's production. The deal also aims to achieve substantial cost synergies, initially targeting $1 billion, and subsequently boosted to $1.5 billion, coupled with structural cost reductions of $3 billion to $4 billion by the end of 2026. This acquisition grants Chevron a 30% interest in Guyana's Stabroek Block, a low-cost, high-growth asset.
- Cost Reduction and Capital Discipline: Chevron is focused on achieving structural cost reductions of $3 billion to $4 billion by the end of 2026. This commitment to capital discipline and efficiency gains is expected to improve net margins and free cash flow, indirectly supporting revenue growth by enhancing overall profitability.
- Strategic Project Start-ups and Ramp-ups: The company expects revenue growth from several major projects that are starting up or ramping up. These include the Future Growth Project at Tengiz, the start-up of Ballymore and Whale, and the ramp-up of Anchor in the Gulf of America. Additionally, projects in the Eastern Mediterranean, such as the Leviathan capacity expansion, Tamar optimization, and Aphrodite entering Front-End Engineering Design (FEED), are anticipated to contribute to increased earnings and free cash flow.
- New Energy Ventures: Chevron is diversifying its operations by venturing into new energy solutions. The company plans to launch its first AI-powered data center project in West Texas, targeting operational status by 2027. This initiative represents a step towards expanding revenue streams beyond traditional oil and gas.
AI Analysis | Feedback
Share Repurchases
- Chevron expects to repurchase between $10 billion and $20 billion of shares annually through 2030.
- In 2024, Chevron repurchased $15.23 billion in stock, following $14.94 billion in 2023 and $11.26 billion in 2022.
- In the first quarter of 2025, share buybacks totaled $3.9 billion, with plans for $2.5 billion to $3 billion in the second quarter of 2025.
Share Issuance
- Chevron issued approximately 301 million shares of common stock to Hess Corporation stockholders upon the completion of the Hess acquisition in July 2025.
- Shares were issued to PDC Energy shareholders as part of the acquisition, with 0.4638 of a Chevron share exchanged for each PDC share.
- Chevron's shares outstanding increased to 1.997 billion by the end of 2025, representing a 9.91% increase year-over-year.
Inbound Investments
- BlackRock and Vanguard increased their Chevron holdings by 20.1 million and 27.9 million shares, respectively, in Q3 2025.
Outbound Investments
- Chevron completed the acquisition of Hess Corporation for $53 billion in an all-stock deal in July 2025, securing a 30% stake in Guyana's Stabroek Block and Bakken assets.
- Chevron acquired PDC Energy for $7.6 billion in an all-stock deal in 2023.
- In February 2022, Chevron acquired Renewable Energy Group (REG) for $3.1 billion, expanding its biofuels production in the U.S.
Capital Expenditures
- Chevron's organic capital expenditure for 2026 is projected to be in the range of $18 billion to $19 billion, with approximately $17 billion allocated to upstream spending, focusing on U.S. shale assets ($6 billion) and global offshore projects ($7 billion).
- For 2025, the organic capital expenditure range was $14.5 billion to $15.5 billion, including about $1.5 billion dedicated to lowering carbon intensity and growing new energies businesses.
- Chevron's capital expenditures for fiscal year 2024 were $72.458 billion.

Peer Outperformance in Integrated Oil & Gas
| Ticker | Name | Rev Growth 3Y Avg | P/E | 1Y | 3Y | 5Y | 5Y Gap |
|---|---|---|---|---|---|---|---|
| CVX | Chevron | 4.3% | 15.4x | 45.0% | 64.2% | 126.8% | — |
| IMO | Imperial Oil | 4.0% | 9.9x | 44.2% | 136.2% | 318.7% | +192pp |
| XOM | Exxon Mobil | 4.4% | 16.8x | 49.6% | 72.3% | 202.9% | +76pp |
| Industry | Names | 1Y med | 3Y med | 5Y med | Top 3 by 5Y |
|---|---|---|---|---|---|
| Oil & Gas Refining & Marketing | 11 | 82.5% | 105.8% | 280.9% | MPC 541% · VLO 426% · PBF 423% |
| Oil & Gas Storage & Transportation | 18 | 35.6% | 101.1% | 159.7% | INSW 749% · TRGP 434% · DHT 394% |
| Integrated Oil & Gas ← | 7 | 44.6% | 64.2% | 150.3% | IMO 319% · SU 223% · XOM 203% |
| Oil & Gas Equipment & Services | 33 | 4.8% | 13.5% | 51.2% | FTI 749% · SEI 616% · TDW 453% |
| Oil & Gas Drilling | 7 | 37.8% | -3.3% | 42.5% | VAL 122% · NE 88% · RIG 42% |
| Oil & Gas Exploration & Production | 50 | 20.7% | 0.8% | 41.2% | BTE 767% · PR 224% · CNQ 188% |
| Coal & Consumable Fuels | 14 | -44.3% | -4.4% | 25.1% | CNR 248% · CCJ 156% · UEC 41% |
Latest Trefis Analyses
| Title | Date | |
|---|---|---|
| DASHBOARDS | ||
| Chevron stock vs Imperial Oil stock: Which Is A Better Investment? | 08/05/2026 | |
| Chevron Earnings Notes | 04/30/2026 | |
| Now Is Not The Time To Buy Chevron Stock | 04/08/2026 | |
| Chevron Stock On Fire: Up 5.1% With 7-Day Winning Streak | 03/25/2026 | |
| Should You Pay Attention To Chevron Stock's Momentum? | 03/04/2026 | |
| How Low Can Chevron Stock Really Go? | 01/07/2026 | |
| CVX Stock Surges 9.2% With A 5-day Winning Spree On Venezuela Catalyst | 01/06/2026 | |
| Chevron vs ConocoPhillips: Which Is A Better Investment? | 08/18/2025 | |
| ARTICLES | ||
| The Events That Matter Most For Chevron Stock | 10/27/2026 | |
| Which Stocks Are Paying For $4.33 Gas? | 10/20/2026 | |
| Is Chevron Stock Worth More Than Its Competitors? | 10/19/2026 | |
| 14 Large Cap Stocks Just Made New 52-Week Highs | 10/15/2026 | |
| How Has Chevron’s Story Changed? | 10/13/2026 |
Research & Analysis
Invest in Strategies
Wealth Management
Peer Comparisons
| Peers to compare with: |
Financials
| Median | |
|---|---|
| Name | |
| Mkt Price | 230.60 |
| Mkt Cap | 134.0 |
| Rev LTM | 171,496 |
| Op Inc LTM | 18,716 |
| FCF LTM | 17,960 |
| FCF 3Y Avg | 9,649 |
| CFO LTM | 24,246 |
| CFO 3Y Avg | 17,388 |
Growth & Margins
| Median | |
|---|---|
| Name | |
| Rev Chg LTM | 22.7% |
| Rev Chg 3Y Avg | 4.5% |
| Rev Chg Q | 39.4% |
| QoQ Delta Rev Chg LTM | 9.1% |
| Op Inc Chg LTM | 218.9% |
| Op Inc Chg 3Y Avg | 49.9% |
| Op Mgn LTM | 11.9% |
| Op Mgn 3Y Avg | 8.9% |
| QoQ Delta Op Mgn LTM | 2.8% |
| CFO/Rev LTM | 16.3% |
| CFO/Rev 3Y Avg | 12.7% |
| FCF/Rev LTM | 11.5% |
| FCF/Rev 3Y Avg | 7.8% |
Valuation
| Median | |
|---|---|
| Name | |
| Mkt Cap | 134.0 |
| P/S | 1.2 |
| P/Op Inc | 8.8 |
| P/EBIT | 7.2 |
| P/E | 10.9 |
| P/CFO | 6.8 |
| Total Yield | 12.1% |
| Dividend Yield | 2.3% |
| FCF Yield 3Y Avg | 7.0% |
| D/E | 0.1 |
| Net D/E | 0.1 |
Returns
| Median | |
|---|---|
| Name | |
| 1M Rtn | -3.7% |
| 3M Rtn | 16.5% |
| 6M Rtn | 34.5% |
| 12M Rtn | 73.7% |
| 3Y Rtn | 103.4% |
| 1M Excs Rtn | -2.4% |
| 3M Excs Rtn | 17.9% |
| 6M Excs Rtn | 29.7% |
| 12M Excs Rtn | 60.1% |
| 3Y Excs Rtn | 22.7% |
Comparison Analyses
Segment Financials
Revenue by Segment| $ Mil | 2025 | 2024 | 2023 | 2022 | 2021 |
|---|---|---|---|---|---|
| Downstream | 142,410 | 157,847 | 161,625 | 179,565 | 115,307 |
| Upstream | 88,379 | 87,768 | 83,920 | 106,978 | 70,140 |
| All Other | 581 | 617 | 597 | 518 | 508 |
| Intersegment revenue elimination | -46,938 | -52,818 | -49,229 | -51,344 | -30,349 |
| Total | 184,432 | 193,414 | 196,913 | 235,717 | 155,606 |
| $ Mil | 2007 | 2001 |
|---|---|---|
| Upstream | 14,816 | |
| Downstream | 3,502 | |
| Chemicals | 396 | -128 |
| Exploration and Production | 4,312 | |
| Refining, Marketing and Transportation | 1,814 | |
| Total | 18,714 | 5,998 |
| $ Mil | 2025 | 2024 | 2023 | 2022 | 2021 |
|---|---|---|---|---|---|
| Upstream | 12,822 | 18,602 | 17,438 | 30,284 | 15,818 |
| Downstream | 3,022 | 1,727 | 6,137 | 8,155 | 2,914 |
| All Other | -3,545 | -2,668 | -2,206 | -2,974 | -3,107 |
| Total | 12,299 | 17,661 | 21,369 | 35,465 | 15,625 |
| $ Mil | 2025 | 2024 | 2023 | 2022 | 2021 |
|---|---|---|---|---|---|
| Upstream | 256,975 | 188,483 | 194,805 | 183,105 | 184,412 |
| Downstream | 55,243 | 56,770 | 54,488 | 53,221 | 45,224 |
| All Other | 11,794 | 11,685 | 12,339 | 21,383 | 9,899 |
| Total | 324,012 | 256,938 | 261,632 | 257,709 | 239,535 |
Price Behavior
| Market Price | $212.93 | |
| Market Cap ($ Bil) | 416.6 | |
| First Trading Date | 01/02/1970 | |
| Distance from 52W High | -9.6% | |
| 50 Days | 200 Days | |
| DMA Price | $214.64 | $192.44 |
| DMA Trend | up | up |
| Distance from DMA | -0.8% | 10.6% |
| 3M | 1YR | |
| Volatility | 24.6% | 24.6% |
| Downside Capture | -150.67 | -102.33 |
| Upside Capture | -58.62 | -40.71 |
| Correlation (S&P 500) | -43.4% | -34.9% |
| 1M | 2M | 3M | 6M | 1Y | 3Y | |
|---|---|---|---|---|---|---|
| Beta | -1.03 | -0.93 | -0.98 | -0.93 | -0.64 | 0.31 |
| Up Beta | -1.55 | -1.55 | -1.25 | -1.48 | -1.04 | 0.35 |
| Down Beta | -0.35 | -1.32 | -0.82 | -0.39 | -0.03 | 0.80 |
| Up Capture | -5% | -24% | -40% | -44% | -21% | 3% |
| Bmk +ve Days | 12 | 18 | 28 | 62 | 130 | 427 |
| Stock +ve Days | 14 | 24 | 36 | 71 | 142 | 418 |
| Down Capture | -238% | -146% | -202% | -206% | -229% | -31% |
| Bmk -ve Days | 10 | 25 | 36 | 64 | 121 | 325 |
| Stock -ve Days | 8 | 19 | 28 | 55 | 109 | 334 |
[1] Upside and downside betas calculated using positive and negative benchmark daily returns respectively
Based On 1-Year Data
| Annualized Return | Annualized Volatility | Sharpe Ratio | Correlation with CVX | |
|---|---|---|---|---|
| CVX | 44.5% | 24.6% | 1.43 | - |
| Sector ETF (XLE) | 44.8% | 23.4% | 1.50 | 91.9% |
| Equity (SPY) | 9.5% | 13.6% | 0.41 | -30.2% |
| Gold (GLD) | 3.6% | 28.7% | 0.11 | -17.0% |
| Commodities (DBC) | 37.7% | 21.2% | 1.40 | 57.9% |
| Real Estate (VNQ) | 12.0% | 14.2% | 0.55 | -8.5% |
| Bitcoin (BTCUSD) | -20.8% | 43.3% | -0.42 | -9.2% |
Smart multi-asset allocation framework can stack odds in your favor. Learn How
Based On 5-Year Data
| Annualized Return | Annualized Volatility | Sharpe Ratio | Correlation with CVX | |
|---|---|---|---|---|
| CVX | 18.1% | 25.3% | 0.63 | - |
| Sector ETF (XLE) | 20.4% | 25.6% | 0.70 | 90.9% |
| Equity (SPY) | 11.3% | 17.3% | 0.48 | 29.9% |
| Gold (GLD) | 17.5% | 19.1% | 0.74 | 4.4% |
| Commodities (DBC) | 8.0% | 19.6% | 0.29 | 56.3% |
| Real Estate (VNQ) | 1.2% | 18.9% | -0.05 | 25.2% |
| Bitcoin (BTCUSD) | 5.9% | 51.5% | 0.29 | 10.2% |
Smart multi-asset allocation framework can stack odds in your favor. Learn How
Based On 10-Year Data
| Annualized Return | Annualized Volatility | Sharpe Ratio | Correlation with CVX | |
|---|---|---|---|---|
| CVX | 12.4% | 29.4% | 0.45 | - |
| Sector ETF (XLE) | 10.2% | 29.7% | 0.38 | 91.3% |
| Equity (SPY) | 14.9% | 18.0% | 0.70 | 52.5% |
| Gold (GLD) | 12.0% | 16.5% | 0.59 | 4.4% |
| Commodities (DBC) | 7.6% | 18.1% | 0.33 | 53.4% |
| Real Estate (VNQ) | 5.7% | 20.7% | 0.23 | 45.0% |
| Bitcoin (BTCUSD) | 61.3% | 66.2% | 1.01 | 12.3% |
Smart multi-asset allocation framework can stack odds in your favor. Learn How
Returns Analyses
Earnings Returns History
Updated 11/4/2026| Forward Returns | |||
|---|---|---|---|
| Earnings Date | 1D Returns | 5D Returns | 21D Returns |
| 10/30/2026 | 1.8% | ||
| 7/31/2026 | 2.4% | -1.6% | 5.9% |
| 5/1/2026 | -1.4% | -5.6% | -3.0% |
| 1/30/2026 | 3.3% | 4.7% | 11.8% |
| 10/31/2025 | 2.7% | -0.4% | -1.0% |
| 8/1/2025 | -0.2% | 1.0% | 7.1% |
| 5/2/2025 | 1.6% | 0.6% | 2.4% |
| 1/31/2025 | -4.6% | -2.8% | -1.0% |
| ... | |||
| SUMMARY STATS | |||
| # Positive | 12 | 11 | 13 |
| # Negative | 12 | 12 | 10 |
| Median Positive | 2.1% | 1.8% | 7.1% |
| Median Negative | -3.3% | -2.8% | -2.8% |
| Max Positive | 8.9% | 5.3% | 16.3% |
| Max Negative | -6.7% | -10.0% | -12.5% |
| Forward Returns | |||
|---|---|---|---|
| Earnings Date | 1D Returns | 5D Returns | 21D Returns |
| 10/30/2026 | 1.8% | ||
| 7/31/2026 | 2.4% | -1.6% | 5.9% |
| 5/1/2026 | -1.4% | -5.6% | -3.0% |
| 1/30/2026 | 3.3% | 4.7% | 11.8% |
| 10/31/2025 | 2.7% | -0.4% | -1.0% |
| 8/1/2025 | -0.2% | 1.0% | 7.1% |
| 5/2/2025 | 1.6% | 0.6% | 2.4% |
| 1/31/2025 | -4.6% | -2.8% | -1.0% |
| 11/1/2024 | 2.9% | 5.3% | 10.1% |
| 8/2/2024 | -2.7% | -5.3% | -2.0% |
| 4/26/2024 | 0.4% | -2.8% | -3.6% |
| 2/2/2024 | 2.9% | 4.2% | 1.8% |
| 10/27/2023 | -6.7% | -3.9% | -5.7% |
| 7/28/2023 | -0.5% | 0.0% | 0.6% |
| 4/28/2023 | 1.0% | -6.4% | -6.8% |
| 1/27/2023 | -4.4% | -10.0% | -12.5% |
| 10/28/2022 | 1.2% | 1.8% | 1.0% |
| 7/29/2022 | 8.9% | 0.5% | 9.6% |
| 4/29/2022 | -3.2% | 2.8% | 11.1% |
| 1/28/2022 | -3.5% | -0.9% | 7.5% |
| 10/29/2021 | 1.2% | 0.3% | 2.7% |
| 7/30/2021 | -0.7% | -1.3% | -2.5% |
| 4/30/2021 | -3.6% | 2.0% | -1.7% |
| 1/29/2021 | -4.3% | -0.0% | 16.3% |
| SUMMARY STATS | |||
| # Positive | 12 | 11 | 13 |
| # Negative | 12 | 12 | 10 |
| Median Positive | 2.1% | 1.8% | 7.1% |
| Median Negative | -3.3% | -2.8% | -2.8% |
| Max Positive | 8.9% | 5.3% | 16.3% |
| Max Negative | -6.7% | -10.0% | -12.5% |
SEC Filings
Expand for More| Report Date | Filing Date | Filing |
|---|---|---|
| 09/30/2026 | 11/05/2026 | 10-Q |
| 06/30/2026 | 08/06/2026 | 10-Q |
| 03/31/2026 | 05/07/2026 | 10-Q |
| 12/31/2025 | 02/24/2026 | 10-K |
| 09/30/2025 | 11/06/2025 | 10-Q |
| 06/30/2025 | 08/07/2025 | 10-Q |
| 03/31/2025 | 05/08/2025 | 10-Q |
| 12/31/2024 | 02/21/2025 | 10-K |
| 09/30/2024 | 11/07/2024 | 10-Q |
| 06/30/2024 | 08/07/2024 | 10-Q |
| 03/31/2024 | 05/02/2024 | 10-Q |
| 12/31/2023 | 02/26/2024 | 10-K |
| 09/30/2023 | 11/02/2023 | 10-Q |
| 06/30/2023 | 08/03/2023 | 10-Q |
| 03/31/2023 | 05/04/2023 | 10-Q |
| 12/31/2022 | 02/23/2023 | 10-K |
| Report Date | Filing Date | Filing |
|---|---|---|
| 09/30/2026 | 11/05/2026 | 10-Q |
| 06/30/2026 | 08/06/2026 | 10-Q |
| 03/31/2026 | 05/07/2026 | 10-Q |
| 12/31/2025 | 02/24/2026 | 10-K |
| 09/30/2025 | 11/06/2025 | 10-Q |
| 06/30/2025 | 08/07/2025 | 10-Q |
| 03/31/2025 | 05/08/2025 | 10-Q |
| 12/31/2024 | 02/21/2025 | 10-K |
| 09/30/2024 | 11/07/2024 | 10-Q |
| 06/30/2024 | 08/07/2024 | 10-Q |
| 03/31/2024 | 05/02/2024 | 10-Q |
| 12/31/2023 | 02/26/2024 | 10-K |
| 09/30/2023 | 11/02/2023 | 10-Q |
| 06/30/2023 | 08/03/2023 | 10-Q |
| 03/31/2023 | 05/04/2023 | 10-Q |
| 12/31/2022 | 02/23/2023 | 10-K |
| 09/30/2022 | 11/03/2022 | 10-Q |
| 06/30/2022 | 08/04/2022 | 10-Q |
| 03/31/2022 | 05/04/2022 | 10-Q |
| 12/31/2021 | 02/24/2022 | 10-K |
| 09/30/2021 | 11/04/2021 | 10-Q |
| 06/30/2021 | 08/05/2021 | 10-Q |
| 03/31/2021 | 05/06/2021 | 10-Q |
| 12/31/2020 | 02/25/2021 | 10-K |
| 09/30/2020 | 11/05/2020 | 10-Q |
| 06/30/2020 | 08/05/2020 | 10-Q |
| 03/31/2020 | 05/06/2020 | 10-Q |
| 12/31/2019 | 02/21/2020 | 10-K |
Recent Forward Guidance
Updated 10/31/2026Latest: Q3 2026 Earnings Reported 10/30/2026
| Forward Guidance | Guidance Change | |||||||
|---|---|---|---|---|---|---|---|---|
| Metric | Source | Low | Mid | High | % Chg | % Delta | Change | Prior |
| Q4 2026 Dividends Per Share | Reported | 1.78 | ||||||
Prior: Q4 2025 Earnings Reported 1/30/2026
| Forward Guidance | Guidance Change | |||||||
|---|---|---|---|---|---|---|---|---|
| Metric | Source | Low | Mid | High | % Chg | % Delta | Change | Prior |
| 2026 Structural Cost Reductions | Reported | 3.00 Bil | 3.50 Bil | 4.00 Bil | ||||
Insider Activity
Updated 11/4/2026| # | Owner | Title | Holding | Action | Filing Date | Price | Shares | Transacted Value | Value of Held Shares | Form |
|---|---|---|---|---|---|---|---|---|---|---|
| 1 | Gustavson, Jeff B | President, New Energies | Direct | Sell | 11042026 | 230.71 | 24,439 | 5,638,275 | 880,844 | Form |
| 2 | Pate, R. Hewitt | Chief Legal Officer | Direct | Sell | 10212026 | 226.65 | 40,700 | 9,224,777 | 1,992,507 | Form |
| 3 | Pate, R. Hewitt | Chief Legal Officer | Direct | Sell | 10212026 | 225.61 | 2,400 | 541,466 | 1,983,345 | Form |
| 4 | Pate, R. Hewitt | Chief Legal Officer | Spouse Trust | Sell | 8202026 | 205.11 | 2,470 | 506,619 | 2,213,944 | Form |
| 5 | Walz, Andrew Benjamin | President, DM&C | Direct | Sell | 8192026 | 201.06 | 16,800 | 3,377,833 | 2,815 | Form |
| # | Owner | Title | Holding | Action | Filing Date | Price | Shares | Transacted Value | Value of Held Shares | Form |
|---|---|---|---|---|---|---|---|---|---|---|
| 1 | Gustavson, Jeff B | President, New Energies | Direct | Sell | 11042026 | 230.71 | 24,439 | 5,638,275 | 880,844 | Form |
| 2 | Pate, R. Hewitt | Chief Legal Officer | Direct | Sell | 10212026 | 226.65 | 40,700 | 9,224,777 | 1,992,507 | Form |
| 3 | Pate, R. Hewitt | Chief Legal Officer | Direct | Sell | 10212026 | 225.61 | 2,400 | 541,466 | 1,983,345 | Form |
| 4 | Pate, R. Hewitt | Chief Legal Officer | Spouse Trust | Sell | 8202026 | 205.11 | 2,470 | 506,619 | 2,213,944 | Form |
| 5 | Walz, Andrew Benjamin | President, DM&C | Direct | Sell | 8192026 | 201.06 | 16,800 | 3,377,833 | 2,815 | Form |
| 6 | Wirth, Michael K | Chairman and CEO | Direct | Sell | 8182026 | 200.46 | 317,100 | 63,566,861 | 5,273,784 | Form |
| 7 | Gustavson, Jeff B | President, New Energies | Direct | Sell | 8132026 | 194.95 | 14,044 | 2,737,867 | 738,078 | Form |
| 8 | Wirth, Michael K | Chairman and CEO | Direct | Sell | 8072026 | 187.00 | 5,547 | 1,037,266 | 4,919,486 | Form |
| 9 | Hess, John B | Trust | Sell | 8052026 | 194.26 | 100,000 | 19,426,032 | 34,587,078 | Form | |
| 10 | Hess, John B | Direct | Sell | 8052026 | 194.10 | 710,665 | 137,942,701 | 70,597,649 | Form | |
| 11 | Hess, John B | Trust | Sell | 5222026 | 193.20 | 380,000 | 73,414,765 | 53,717,391 | Form | |
| 12 | Hess, John B | Trust | Sell | 5082026 | 184.78 | 195,000 | 36,031,524 | 121,591,610 | Form | |
| 13 | Pate, R. Hewitt | Chief Legal Officer | Direct | Sell | 4012026 | 213.30 | 40,200 | 8,574,857 | 1,842,528 | Form |
| 14 | Pate, R. Hewitt | Chief Legal Officer | Direct | Sell | 3102026 | 192.12 | 47,200 | 9,068,064 | 1,644,163 | Form |
| 15 | Pate, R. Hewitt | Chief Legal Officer | Direct | Sell | 3032026 | 188.65 | 58,000 | 10,941,854 | 1,614,489 | Form |
| 16 | Bonner, Eimear P | Chief Financial Officer | Direct | Sell | 3032026 | 190.60 | 17,400 | 3,316,440 | 1,606,186 | Form |
| 17 | Pate, R. Hewitt | Chief Legal Officer | Direct | Sell | 3032026 | 186.06 | 35,475 | 6,600,564 | 1,592,322 | Form |
| 18 | Bonner, Eimear P | Chief Financial Officer | Direct | Sell | 3032026 | 186.06 | 28,400 | 5,284,075 | 1,568,105 | Form |
| 19 | Gustavson, Jeff B | President, New Energies | Direct | Sell | 3032026 | 186.04 | 6,667 | 1,240,325 | 691,322 | Form |
| 20 | Walz, Andrew Benjamin | President, DM&C | Direct | Sell | 2202026 | 183.83 | 1,463 | Form | ||
| 21 | Knowles, Alana K | Controller | Direct | Sell | 2202026 | 183.28 | 2,408 | Form | ||
| 22 | Booth, Thomas Ryder | Chief Technology & Eng Ofr | Direct | Sell | 2172026 | 182.37 | 1,122 | Form | ||
| 23 | Booth, Thomas Ryder | Chief Technology & Eng Ofr | Direct | Sell | 2172026 | 184.40 | 11,076 | 2,042,375 | 206,893 | Form |
| 24 | Walz, Andrew Benjamin | President, DM&C | Direct | Sell | 2172026 | 183.40 | 666 | 122,144 | 268,314 | Form |
| 25 | Booth, Thomas Ryder | Chief Technology & Eng Ofr | Booth Family Trust | Sell | 2122026 | 184.77 | 5 | Form | ||
| 26 | Walz, Andrew Benjamin | President, DM&C | Direct | Sell | 2052026 | 176.53 | 22,200 | 3,919,050 | 117,572 | Form |
| 27 | Booth, Thomas Ryder | Chief Technology & Eng Ofr | Direct | Sell | 2052026 | 178.43 | 6,000 | 1,070,566 | 84,932 | Form |
| 28 | Nelson, Mark A | Vice Chairman | Direct | Sell | 2032026 | 174.17 | 45,800 | 7,976,844 | 1,247,209 | Form |
| 29 | Bonner, Eimear P | Chief Financial Officer | Direct | Sell | 2032026 | 175.01 | 32,100 | 5,617,731 | 764,081 | Form |
| 30 | Pate, R. Hewitt | Chief Legal Officer | Direct | Sell | 2032026 | 176.40 | 41,134 | 7,256,038 | 735,412 | Form |
| 31 | Knowles, Alana K | Controller | Direct | Sell | 1152026 | 168.00 | 3,200 | 537,600 | 202,776 | Form |
| 32 | Gustavson, Jeff B | Vice President | Direct | Sell | 11252025 | 150.27 | 9,325 | 1,401,283 | 251,705 | Form |
| 33 | Hess, John B | Trust | Sell | 11242025 | 150.16 | 275,000 | 41,293,418 | 128,091,433 | Form | |
| 34 | Hess, John B | Trust | Sell | 11242025 | 150.75 | 275,000 | 41,456,131 | 170,052,296 | Form |
Investor Activity (13F)
Updated Nov 6, 2026Active managers (13F portfolio over $250M, at least 3 holdings) with a position over $5M that is either over 10% of their portfolio or held in a concentrated book of 50 or fewer total positions. Index/ETF, sovereign, bank, community-bank and charitable/donor-advised filers are excluded.
| Active Manager | Value | % of Portfolio | Total Positions | QoQ | Filing |
|---|---|---|---|---|---|
| Adams Natural Resources Fund, Inc. | $127.2 Mil | 14.7% | 54 | Hold | 13F |
| Drummond Knight Asset Management Pty Ltd | $31.1 Mil | 11.0% | 14 | New | 13F |
| Solus Alternative Asset Management LP | $36.8 Mil | 9.9% | 10 | Hold | 13F |
| Colrain Capital LLC | $24.1 Mil | 9.3% | 26 | ADD +19.8% | 13F |
| 59 North Capital Management, LP | $211.6 Mil | 6.3% | 17 | New | 13F |
| Turas Capital Management LP | $19.3 Mil | 4.9% | 37 | New | 13F |
| Central Securities Corp | $53.0 Mil | 4.4% | 30 | Hold | 13F |
| Kinsale Capital Group, Inc. | $11.0 Mil | 1.8% | 41 | ADD +6.0% | 13F |
| Haverford Financial Services, Inc. | $5.8 Mil | 1.7% | 46 | Hold | 13F |
| Boothe Investment Group, Inc. | $5.0 Mil | 1.6% | 40 | Hold | 13F |
| Keystone Financial Planning, Inc. | $5.1 Mil | 1.4% | 40 | TRIM -67.7% | 13F |
| Active Manager | Value | % of Portfolio | Total Positions | QoQ | Filing |
|---|---|---|---|---|---|
| 59 North Capital Management, LP | $211.6 Mil | 6.3% | 17 | New | 13F |
| Drummond Knight Asset Management Pty Ltd | $31.1 Mil | 11.0% | 14 | New | 13F |
| Turas Capital Management LP | $19.3 Mil | 4.9% | 37 | New | 13F |
| Colrain Capital LLC | $24.1 Mil | 9.3% | 26 | ADD +19.8% | 13F |
| Kinsale Capital Group, Inc. | $11.0 Mil | 1.8% | 41 | ADD +6.0% | 13F |
| Active Manager | Value | % of Portfolio | Total Positions | QoQ | As Of | Filing |
|---|---|---|---|---|---|---|
| Fidelity National Financial, Inc. | $25.9 Mil | 0.8% | 22 | Exited | Dec 31, 2025 | 13F |
| Vantage Wealth | $18.6 Mil | 4.0% | 30 | Exited | Dec 31, 2025 | 13F |
| Campbell Capital Management Inc | $7.2 Mil | 2.4% | 46 | Exited | Dec 31, 2025 | 13F |
| Keystone Financial Planning, Inc. | $5.1 Mil | 1.4% | 40 | TRIM -67.7% | Mar 31, 2026 | 13F |
| Active Manager | Value | % of Portfolio | Total Positions | QoQ | Filing |
|---|---|---|---|---|---|
| 59 North Capital Management, LP | $211.6 Mil | 6.3% | 17 | New | 13F |
| Adams Natural Resources Fund, Inc. | $127.2 Mil | 14.7% | 54 | Hold | 13F |
| Central Securities Corp | $53.0 Mil | 4.4% | 30 | Hold | 13F |
| Solus Alternative Asset Management LP | $36.8 Mil | 9.9% | 10 | Hold | 13F |
| Drummond Knight Asset Management Pty Ltd | $31.1 Mil | 11.0% | 14 | New | 13F |
| Colrain Capital LLC | $24.1 Mil | 9.3% | 26 | ADD +19.8% | 13F |
| Turas Capital Management LP | $19.3 Mil | 4.9% | 37 | New | 13F |
| Kinsale Capital Group, Inc. | $11.0 Mil | 1.8% | 41 | ADD +6.0% | 13F |
| Haverford Financial Services, Inc. | $5.8 Mil | 1.7% | 46 | Hold | 13F |
| Keystone Financial Planning, Inc. | $5.1 Mil | 1.4% | 40 | TRIM -67.7% | 13F |
| Boothe Investment Group, Inc. | $5.0 Mil | 1.6% | 40 | Hold | 13F |
CVX Trade Sentinel
High Conviction
CONVICTION RATIONALE
Strong free cash flow more than funds a total shareholder yield of 10.2%, demonstrating a clear commitment to capital returns.
STOCK ARCHETYPE
Commodity ProducerRevenue = Production Volume (BOE) x Average Realized Price ($/BOE) Upstream segment profitability, driven by the spread between realized commodity prices and the cost of production (cost of supply).
INVESTMENT THESIS
Evidence suggests yes. The company is successfully integrating new assets, cutting structural costs, and translating operational gains directly into shareholder distributions.
- Achieved $3 billion in structural cost savings 6 months early.
- Total shareholder yield is 10.2%.
- Free cash flow covers total shareholder payouts by a factor of 1.36.
- Net debt was reduced from $33.8 billion to $20.7 billion YoY.
PRIMARY RISK
The stock's 48% gain over the last twelve months has been heavily influenced by high energy prices. A significant drop in crude oil or natural gas prices would directly impact earnings and could challenge the current valuation.
- Upstream earnings are closely aligned with volatile industry prices.
- A June analyst note cited geopolitical premiums for a downgrade.
- The stock has returned 48% over the last twelve months.
| KPI | Status | Rationale |
|---|---|---|
| Worldwide Net Oil-Equivalent Production | Nearly 4 million barrels of oil equivalent per day (MMbpd) for the third quarter of 2026. - Stable | The trend reflects a new, higher production plateau following the Hess acquisition, with strong underlying performance from core assets. The slight sequential dip in Q3 is due to normal operational cadence, not a sign of weakening fundamentals. |
| Structural Cost Reductions | Achieved $3 billion in annual run-rate savings as of the second quarter of 2026. - Accelerating | Management has successfully accelerated its cost-cutting initiatives, with over 70% of the savings attributed to durable efficiency gains. The company expanded its target to $3 billion to $4 billion by 2026. |
| U.S. Refinery Crude Unit Inputs | 1,063 thousand barrels per day (First six months of 2026) | Measures the volume of crude oil processed by U.S. refineries, indicating operational utilization and the scale of the Downstream business. High throughput is critical for meeting product demand. |
| Total Shareholder Yield | 10.2% (Trailing-twelve-months as of 11/4/2026) | Represents the total return to shareholders from buybacks and dividends as a percentage of market value, reflecting the company's commitment to shareholder distributions. |
Operational Gains vs. Price Volatility
BULL VIEW
CORE TENSION
PREVAILING SENTIMENT
Current evidence favors the bulls. The company is delivering on volume and cost targets, providing a tangible, operational buffer against price volatility.
BEAR VIEW
Bears argue the stock is a leveraged bet on high oil prices, and operational gains will not be enough to offset a significant price downturn, given the high earnings sensitivity.
| Timeline | Event & Metric To Watch |
|---|---|
by the end of 2026 | Structural Cost Reduction Target Watch: The company's structural cost reduction target of $3-4 billion is planned to be achieved. |
in 2026 | Angola Gas Project First Production Watch: The New Gas Consortium Project in Angola is expected to achieve first production. |
in 2026 | Guyana Uaru Project First Oil Watch: The Uaru development in Guyana is expected to achieve first production. |
by year-end | Venezuela Production Milestone Watch: Company is on track to reach approximately 300,000 barrels per day of gross production in Venezuela. |
1/27/2027 - 2/3/2027 | Negative Read-Through From Peer Reports Watch: Peer commentary on cost inflation, production issues in shared basins (Permian, Guyana), or weaker-than-expected downstream margins. |
1/28/2027 | Earnings Miss From Volatile Timing Effects Watch: Sharp commodity price swings near quarter-end, which could create a large, non-cash accounting impact on reported earnings. |
1/28/2027 | Company Earnings Report Watch: Company is scheduled to report its next earnings. |
No set date | Geopolitical Production And Logistics Disruption Watch: News of escalating conflict impacting the Strait of Hormuz, Israeli assets, or the CPC pipeline, leading to wider production shut-ins. |
December | Unexpected Increase In Capital Budget Watch: A 2027 capex budget significantly higher than the current $18 billion to $19 billion range, suggesting cost overruns or lower capital efficiency. |
in December | Capital Program Update Watch: Company to provide an update on its 2027 capital program. |
| Date | Event | Stock Impact |
|---|---|---|
2026-10-30 | Reported Strong Q3 Earnings Details: Chevron reported third-quarter earnings of $9.9 billion, or $5.06 per share. Adjusted earnings were $10.4 billion, or $5.28 per share. | -1.6% $231.46 -> $227.77 |
2026-10-06 | Bakken Midstream Asset Restructuring Details: Chevron announced agreements with Hess Midstream to restructure Bakken midstream contracts, which are expected to reduce unit midstream costs by approximately 50%. | -0.6% $206.47 -> $205.15 |
2026-09-02 | Venezuela Position Expansion Details: Chevron announced agreements with Venezuela establishing updated terms for its joint ventures to support future investment, project development, and production growth. | +0.1% $211.05 -> $211.32 |
2026-08-17 | Angola Oil And Gas Discovery Details: The company confirmed an oil and gas condensate discovery at the 105-4X exploration well in Block 0, offshore Angola, encountering a column of over 600 meters. | +2.9% $198.27 -> $203.96 |
2026-07-31 | Strong Q2 Results And Production Records Details: The company achieved a new U.S. upstream production record of nearly 2.1 million barrels of oil equivalent per day and record refinery throughput of over 1 million barrels per day. | +0.5% $190.65 -> $191.51 |
2026-06-05 | Analyst Rating Downgrade Details: An analyst note downgraded Chevron from bullish to neutral, citing a 24% year-to-date rally driven by geopolitical oil premiums rather than fundamentals. | +0.5% $186.72 -> $187.60 |
Position Sizing
4% - 6%
NORMAL POSITION
Sizing is volatility-based: CVX trades at roughly 23% annualized realized (three-month) volatility versus about 10% for the S&P 500 (2.4x the market). A 4% - 6% position keeps a single-name swing of that size within a diversified portfolio's risk budget.
Diversification Alternatives
XOM - Exxon Mobil
Global Scale LeaderExxon Mobil offers significantly larger scale, with revenue 1.7 times that of Chevron and a larger capital budget, making it a primary choice for investors prioritizing global supply security.
COP - ConocoPhillips
Pure-Play E&PAs a large independent exploration and production company, ConocoPhillips offers more direct exposure to upstream fundamentals without the integrated downstream and chemicals businesses.
A disciplined capital allocator executing on a high-quality, integrated energy portfolio, focused on generating free cash flow and shareholder returns through commodity cycles.
Chevron leverages its scale and integrated model to navigate the volatile energy market. The company's strategy focuses on investing in advantaged, low-cost Upstream projects (like the Permian and Guyana) and optimizing its complex Downstream assets to maximize margins. This disciplined approach, combined with a strong balance sheet, is designed to support consistent and growing shareholder returns via dividends and buybacks, irrespective of commodity price fluctuations.
News of successful project start-ups, continued capital efficiency gains in shale, favorable fiscal term renegotiations in key regions (e.g., Venezuela, Kazakhstan), and consistent or increased shareholder distributions.
Sustained low commodity prices, major project delays or cost overruns, significant operational disruptions in key assets (e.g., TCO, Australian LNG), or a shift away from capital discipline and shareholder return priorities.
Short-term commodity price swings, minor non-operated production disruptions, or executive leadership changes that do not alter the stated strategy.
Repricing Catalyst
Successful execution and ramp-up of major growth projects (Guyana, Gulf of America), continued production growth, and delivering on structural cost reduction targets, which collectively drive higher free cash flow and shareholder returns.
Upstream
$190.6B TTM (49% of Total)What It Is
Sells crude oil and natural gas. Operations consist of exploring for, developing, producing, and transporting crude oil and natural gas; processing and transportation associated with liquefied natural gas (LNG); and transporting crude oil via pipelines.
Who Pays & How
Refiners, marketers, and utilities pay for crude oil and natural gas as essential feedstocks and energy sources. They choose suppliers based on availability, logistics, and pricing, which are influenced by global markets.
Competition
Downstream
$310.3B TTM (79% of Total)What It Is
Sells refined products including gasoline, diesel, jet fuel, lubricants, additives, and petrochemicals. Operations consist of refining crude oil, marketing products, manufacturing renewable fuels, and transporting crude and refined products.
Who Pays & How
Industrial consumers and individual consumers pay for fuels, lubricants, and chemical products for transportation and manufacturing needs. Marketing is conducted under the "Chevron," "Texaco," and "Caltex" brands.
Competition
All Other
$1.1B TTM (0% of Total)What It Is
This segment consists of worldwide cash management and debt financing activities, corporate administrative functions, insurance operations, real estate activities, and technology companies.
Who Pays & How
This is primarily a corporate and support segment, not a customer-facing revenue generator.
Competition
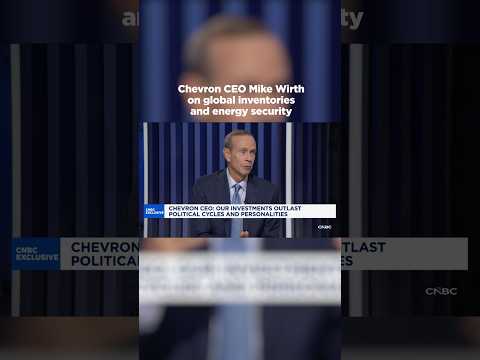
Chevron — Investor Video Playlist


Industry Resources
External Quote Links
| Y Finance | Barrons |
| TradingView | Morningstar |
| SeekingAlpha | ValueLine |
| Motley Fool | Robinhood |
| CNBC | Etrade |
| MarketWatch | Unusual Whales |
| YCharts | Perplexity Finance |
| FinViz |
Prefer one of these to Trefis? Tell us why.