
ONEOK (OKE)
Market Price (10/2/2026): $86.82 | Market Cap: $54.8 BilSector: Energy | Industry: Oil & Gas Storage & Transportation
ONEOK (OKE)
Market Price (10/2/2026): $86.82Market Cap: $54.8 BilSector: EnergyIndustry: Oil & Gas Storage & Transportation
Investment Highlights Why It Matters Detailed financial logic regarding cash flow yields vs trend-riding momentum.
Attractive yieldTotal YieldTotal Yield = Earnings Yield + Dividend Yield, Earnings Yield = Net Income / Market Cap Dividend Yield = Total Dividends / Market Cap is 11%, Dividend Yield is 4.8%, ERPEquity Risk Premium (ERP) = Total Yield - Risk Free Rate, Reflects the premium above risk free assets offered by the investment. is 7.6%, FCF Yield is 5.3% Strong revenue growthRev Chg LTMRevenue Change % Last Twelve Months (LTM) is 41% Attractive cash flow generationCFO/Rev LTMCash Flow from Operations / Revenue (Sales), Last Twelve Months (LTM) is 16%, CFO LTM is 6.2 Bil, FCF LTM is 2.9 Bil Low stock price volatilityVol 12M is 27% Megatrend and thematic driversMegatrends include US Energy Independence, Hydrogen Economy, and Energy Transition & Decarbonization. Themes include US LNG, Show more. | Weak multi-year price returns2Y Excs Rtn is -26%, 3Y Excs Rtn is -22% | Debt is significantNet D/ENet Debt/Equity. Debt net of cash. Negative indicates net cash. Equity is taken as the Market Capitalization is 60% Key risksOKE key risks include [1] challenges integrating major acquisitions and managing the resulting high debt, Show more. |
| Attractive yieldTotal YieldTotal Yield = Earnings Yield + Dividend Yield, Earnings Yield = Net Income / Market Cap Dividend Yield = Total Dividends / Market Cap is 11%, Dividend Yield is 4.8%, ERPEquity Risk Premium (ERP) = Total Yield - Risk Free Rate, Reflects the premium above risk free assets offered by the investment. is 7.6%, FCF Yield is 5.3% |
| Strong revenue growthRev Chg LTMRevenue Change % Last Twelve Months (LTM) is 41% |
| Attractive cash flow generationCFO/Rev LTMCash Flow from Operations / Revenue (Sales), Last Twelve Months (LTM) is 16%, CFO LTM is 6.2 Bil, FCF LTM is 2.9 Bil |
| Low stock price volatilityVol 12M is 27% |
| Megatrend and thematic driversMegatrends include US Energy Independence, Hydrogen Economy, and Energy Transition & Decarbonization. Themes include US LNG, Show more. |
| Weak multi-year price returns2Y Excs Rtn is -26%, 3Y Excs Rtn is -22% |
| Debt is significantNet D/ENet Debt/Equity. Debt net of cash. Negative indicates net cash. Equity is taken as the Market Capitalization is 60% |
| Key risksOKE key risks include [1] challenges integrating major acquisitions and managing the resulting high debt, Show more. |
Qualitative Assessment
AI Analysis | Feedback
ONEOK (OKE) stock has remained largely at the same level since 6/30/2026 because of the following key factors:
1. Robust Fiscal Q2 2026 Financial Performance and Raised Guidance.
ONEOK announced strong financial results for its fiscal second quarter, which ended June 30, 2026. The company reported adjusted earnings per share (EPS) of $1.53, surpassing analysts' consensus estimates of $1.46 by $0.07. Quarterly revenue also exceeded expectations, coming in at $12.05 billion against an $8.95 billion estimate. This performance, fueled by record natural gas liquids (NGLs) volumes and higher natural gas processing activity, led ONEOK to increase its fiscal year 2026 net income guidance to a midpoint of $3.6 billion and adjusted EBITDA guidance to a midpoint of $8.35 billion. While these positive indicators typically drive stock appreciation, the stock remained largely stable, suggesting these developments were either already priced into the market or offset by other factors.
2. Strategic Brazos Midstream Acquisition and Deleveraging Efforts.
In late August 2026, ONEOK completed the strategic acquisition of Brazos Midstream's Permian Midland Basin assets for $4.425 billion. This acquisition was expected to be immediately accretive to the company's earnings and free cash flow per share, while also enhancing its presence in the key Permian basin. The funding structure involved a significant $9 billion non-voting minority equity investment from Apollo Global Management, with a substantial portion of the proceeds used to extinguish $5 billion of debt. This led Fitch Ratings to place ONEOK's long-term ratings on Rating Watch Positive, anticipating a reduction in leverage to below 3.5x in fiscal year 2027. This substantial transaction, aimed at strengthening the company's financial position and operational scale, did not lead to a significant upward shift in the stock price during the period, indicating its implications were likely absorbed by the market.
Show more
ONEOK (OKE) stock has remained largely at the same level since 6/30/2026 because of the following key factors:
1. Robust Fiscal Q2 2026 Financial Performance and Raised Guidance.
ONEOK announced strong financial results for its fiscal second quarter, which ended June 30, 2026. The company reported adjusted earnings per share (EPS) of $1.53, surpassing analysts' consensus estimates of $1.46 by $0.07. Quarterly revenue also exceeded expectations, coming in at $12.05 billion against an $8.95 billion estimate. This performance, fueled by record natural gas liquids (NGLs) volumes and higher natural gas processing activity, led ONEOK to increase its fiscal year 2026 net income guidance to a midpoint of $3.6 billion and adjusted EBITDA guidance to a midpoint of $8.35 billion. While these positive indicators typically drive stock appreciation, the stock remained largely stable, suggesting these developments were either already priced into the market or offset by other factors.
2. Strategic Brazos Midstream Acquisition and Deleveraging Efforts.
In late August 2026, ONEOK completed the strategic acquisition of Brazos Midstream's Permian Midland Basin assets for $4.425 billion. This acquisition was expected to be immediately accretive to the company's earnings and free cash flow per share, while also enhancing its presence in the key Permian basin. The funding structure involved a significant $9 billion non-voting minority equity investment from Apollo Global Management, with a substantial portion of the proceeds used to extinguish $5 billion of debt. This led Fitch Ratings to place ONEOK's long-term ratings on Rating Watch Positive, anticipating a reduction in leverage to below 3.5x in fiscal year 2027. This substantial transaction, aimed at strengthening the company's financial position and operational scale, did not lead to a significant upward shift in the stock price during the period, indicating its implications were likely absorbed by the market.
3. Consistent Dividend Payouts in a Stable Midstream Sector.
ONEOK maintained its quarterly dividend at $1.07 per share in July 2026, resulting in an annualized dividend of $4.28 per share. This consistent return of capital to shareholders is a common characteristic within the midstream energy sector, which generally demonstrated a commitment to increasing payouts during fiscal Q3 2026. The reliable dividend, coupled with a constructive macroeconomic environment for natural gas and NGLs production in North America, likely supported investor confidence and provided a baseline for the stock price, contributing to its stability despite the absence of substantial upward momentum.
4. Neutral Analyst Sentiment and Valuation Equilibrium.
Throughout fiscal Q3 2026, analyst coverage of ONEOK reflected a balanced outlook. Of the 15 analysts covering the stock, approximately 59.52% issued "Hold" ratings, while 40.48% recommended a "Buy". The average price target was $93.54. Despite the positive financial and strategic developments, some analysts noted concerns regarding ONEOK's full valuation and potentially limited immediate upside. This equilibrium in analyst sentiment, where strong fundamentals were perceived to be largely accounted for in the stock's existing price, likely played a role in preventing significant upward movement, with the stock largely holding its ground after briefly touching a 52-week high of $99.85.
Show less
Stock Movement Drivers
Fundamental Drivers
The 1.4% change in OKE stock from 6/30/2026 to 10/1/2026 was primarily driven by a 11.8% change in the company's Total Revenues ($ Mil).| (LTM values as of) | 6302026 | 10012026 | Change |
|---|---|---|---|
| Stock Price ($) | 85.92 | 87.16 | 1.4% |
| Change Contribution By: | |||
| Total Revenues ($ Mil) | 35,204 | 39,366 | 11.8% |
| Net Income Margin (%) | 10.0% | 9.3% | -7.4% |
| P/E Multiple | 15.3 | 15.0 | -2.0% |
| Shares Outstanding (Mil) | 631 | 631 | 0.0% |
| Cumulative Contribution | 1.4% |
Market Drivers
6/30/2026 to 10/1/2026| Return | Correlation | |
|---|---|---|
| OKE | 1.4% | |
| Market (SPY) | 2.3% | -29.8% |
| Sector (XLE) | 18.1% | 70.9% |
Fundamental Drivers
The -1.3% change in OKE stock from 3/31/2026 to 10/1/2026 was primarily driven by a -8.2% change in the company's P/E Multiple.| (LTM values as of) | 3312026 | 10012026 | Change |
|---|---|---|---|
| Stock Price ($) | 88.27 | 87.16 | -1.3% |
| Change Contribution By: | |||
| Total Revenues ($ Mil) | 33,629 | 39,366 | 17.1% |
| Net Income Margin (%) | 10.1% | 9.3% | -8.0% |
| P/E Multiple | 16.4 | 15.0 | -8.2% |
| Shares Outstanding (Mil) | 630 | 631 | -0.2% |
| Cumulative Contribution | -1.3% |
Market Drivers
3/31/2026 to 10/1/2026| Return | Correlation | |
|---|---|---|
| OKE | -1.3% | |
| Market (SPY) | 17.8% | -37.0% |
| Sector (XLE) | 3.1% | 77.0% |
Fundamental Drivers
The 25.9% change in OKE stock from 9/30/2025 to 10/1/2026 was primarily driven by a 40.8% change in the company's Total Revenues ($ Mil).| (LTM values as of) | 9302025 | 10012026 | Change |
|---|---|---|---|
| Stock Price ($) | 69.21 | 87.16 | 25.9% |
| Change Contribution By: | |||
| Total Revenues ($ Mil) | 27,953 | 39,366 | 40.8% |
| Net Income Margin (%) | 11.1% | 9.3% | -16.1% |
| P/E Multiple | 14.0 | 15.0 | 7.2% |
| Shares Outstanding (Mil) | 627 | 631 | -0.6% |
| Cumulative Contribution | 25.9% |
Market Drivers
9/30/2025 to 10/1/2026| Return | Correlation | |
|---|---|---|
| OKE | 25.9% | |
| Market (SPY) | 15.6% | -20.7% |
| Sector (XLE) | 43.5% | 73.3% |
Fundamental Drivers
The 60.0% change in OKE stock from 9/30/2023 to 10/1/2026 was primarily driven by a 105.0% change in the company's Total Revenues ($ Mil).| (LTM values as of) | 9302023 | 10012026 | Change |
|---|---|---|---|
| Stock Price ($) | 54.49 | 87.16 | 60.0% |
| Change Contribution By: | |||
| Total Revenues ($ Mil) | 19,199 | 39,366 | 105.0% |
| Net Income Margin (%) | 12.7% | 9.3% | -26.7% |
| P/E Multiple | 10.0 | 15.0 | 49.9% |
| Shares Outstanding (Mil) | 448 | 631 | -28.9% |
| Cumulative Contribution | 60.0% |
Market Drivers
9/30/2023 to 10/1/2026| Return | Correlation | |
|---|---|---|
| OKE | 60.0% | |
| Market (SPY) | 84.9% | 31.3% |
| Sector (XLE) | 51.6% | 74.6% |
Price Returns Compared
| 2021 | 2022 | 2023 | 2024 | 2025 | 2026 | Total [1] | |
|---|---|---|---|---|---|---|---|
| Returns | |||||||
| OKE Return | 65% | 19% | 13% | 50% | -23% | 20% | 209% |
| Peers Return | 43% | 19% | 8% | 61% | 14% | 18% | 296% |
| S&P 500 Return | 27% | -19% | 24% | 23% | 16% | 12% | 104% |
Monthly Win Rates [3] | |||||||
| OKE Win Rate | 75% | 67% | 58% | 67% | 42% | 78% | |
| Peers Win Rate | 72% | 60% | 53% | 75% | 58% | 64% | |
| S&P 500 Win Rate | 75% | 42% | 67% | 75% | 67% | 44% | |
Max Drawdowns [4] | |||||||
| OKE Max Drawdown | -13% | -29% | -18% | -17% | -38% | -13% | |
| Peers Max Drawdown | -16% | -26% | -16% | -12% | -16% | -14% | |
| S&P 500 Max Drawdown | -5% | -25% | -10% | -8% | -19% | -9% | |
[1] Cumulative total returns since the beginning of 2021
[2] Peers: WMB, TRGP, KMI, ENB, TRP. See OKE Returns vs. Peers.
[3] Win Rate = % of calendar months in which monthly returns were positive
[4] Max drawdown represents maximum peak-to-trough decline within a year
[5] 2026 data is for the year up to 10/1/2026 (YTD)
How Low Can It Go
| Event | OKE | S&P 500 |
|---|---|---|
| 2025 US Tariff Shock | ||
| % Loss | -20.7% | -18.8% |
| % Gain to Breakeven | 26.0% | 23.1% |
| Time to Breakeven | 405 days | 79 days |
| 2023 SVB Regional Banking Crisis | ||
| % Loss | -17.9% | -6.7% |
| % Gain to Breakeven | 21.7% | 7.1% |
| Time to Breakeven | 121 days | 31 days |
| 2022 Inflation Shock & Fed Tightening | ||
| % Loss | -11.8% | -24.5% |
| % Gain to Breakeven | 13.3% | 32.4% |
| Time to Breakeven | 29 days | 427 days |
| 2020 COVID-19 Crash | ||
| % Loss | -80.0% | -33.7% |
| % Gain to Breakeven | 399.4% | 50.9% |
| Time to Breakeven | 586 days | 140 days |
| Q4 2018 Fed Policy Error / Growth Scare | ||
| % Loss | -24.8% | -19.2% |
| % Gain to Breakeven | 33.0% | 23.8% |
| Time to Breakeven | 52 days | 105 days |
| 2015-2016 China Devaluation / Global Growth Scare | ||
| % Loss | -47.3% | -12.2% |
| % Gain to Breakeven | 89.8% | 13.9% |
| Time to Breakeven | 126 days | 62 days |
In The Past
ONEOK's stock fell -20.7% during the 2025 US Tariff Shock. Such a loss loss requires a 26.0% gain to breakeven.
Preserve Wealth
Limiting losses and compounding gains is essential to preserving wealth.
Asset Allocation
Actively managed asset allocation strategies protect wealth. Learn more.
| Event | OKE | S&P 500 |
|---|---|---|
| 2025 US Tariff Shock | ||
| % Loss | -20.7% | -18.8% |
| % Gain to Breakeven | 26.0% | 23.1% |
| Time to Breakeven | 405 days | 79 days |
| 2020 COVID-19 Crash | ||
| % Loss | -80.0% | -33.7% |
| % Gain to Breakeven | 399.4% | 50.9% |
| Time to Breakeven | 586 days | 140 days |
| Q4 2018 Fed Policy Error / Growth Scare | ||
| % Loss | -24.8% | -19.2% |
| % Gain to Breakeven | 33.0% | 23.8% |
| Time to Breakeven | 52 days | 105 days |
| 2015-2016 China Devaluation / Global Growth Scare | ||
| % Loss | -47.3% | -12.2% |
| % Gain to Breakeven | 89.8% | 13.9% |
| Time to Breakeven | 126 days | 62 days |
| 2014-2016 Oil Price Collapse | ||
| % Loss | -71.1% | -6.8% |
| % Gain to Breakeven | 245.8% | 7.3% |
| Time to Breakeven | 755 days | 15 days |
| 2011 US Debt Ceiling Crisis & European Contagion | ||
| % Loss | -21.0% | -17.9% |
| % Gain to Breakeven | 26.6% | 21.8% |
| Time to Breakeven | 80 days | 123 days |
| 2008-2009 Global Financial Crisis | ||
| % Loss | -57.4% | -53.4% |
| % Gain to Breakeven | 134.6% | 114.4% |
| Time to Breakeven | 273 days | 1085 days |
In The Past
ONEOK's stock fell -20.7% during the 2025 US Tariff Shock. Such a loss loss requires a 26.0% gain to breakeven.
Preserve Wealth
Limiting losses and compounding gains is essential to preserving wealth.
Asset Allocation
Actively managed asset allocation strategies protect wealth. Learn more.
About ONEOK (OKE)
ONEOK, Inc. (OKE) is a prominent North American midstream energy company primarily engaged in the gathering, processing, storage, and transportation of natural gas and natural gas liquids (NGLs) across significant production regions in the United States. Its vast network of energy infrastructure is crucial for moving these commodities efficiently from their sources to various market destinations.
The company's core operations are divided into three main segments: Natural Gas Gathering and Processing, Natural Gas Liquids, and Natural Gas Pipelines. This involves owning and operating extensive natural gas gathering pipelines and processing plants, notably in the Mid-Continent and Rocky Mountain regions. Additionally, ONEOK is a leader in the NGL value chain, providing comprehensive services including the gathering, treating, fractionating (separating NGLs into their individual components), storing, and transporting NGL products through its wide-ranging pipeline systems, terminals, and storage facilities. The company also manages regulated interstate and intrastate natural gas transmission pipelines and natural gas storage facilities.
ONEOK serves a broad spectrum of customers within the energy industry. Its primary clientele includes integrated and independent exploration and production (E&P) companies, other natural gas and NGL gathering and processing firms, propane distributors, municipalities, ethanol producers, and large industrial entities such as petrochemical, refining, and NGL marketing companies. The company's strategic infrastructure plays a vital role in connecting energy producers with various end-users and distributors nationwide.
```AI Analysis | Feedback
ONEOK is like the **railroad system for natural gas and natural gas liquids**, owning the pipelines that transport these energy commodities across vast distances.
ONEOK is like the **interstate highway system for natural gas and natural gas liquids**, providing the essential infrastructure for energy to flow.
ONEOK is like a **FedEx or UPS for natural gas and natural gas liquids**, handling the complex logistics of moving, processing, and storing these energy products across the country.
AI Analysis | Feedback
- Natural Gas Gathering & Processing: Services involve collecting raw natural gas from production sites and processing it to remove impurities and separate valuable components.
- Natural Gas Liquids (NGL) Services: These services encompass the gathering, treating, fractionating, transporting, storing, marketing, and distributing various natural gas liquid products.
- Natural Gas Transportation & Storage: The company provides services for moving processed natural gas through regulated interstate and intrastate pipelines and storing it in underground facilities.
AI Analysis | Feedback
AI Analysis | Feedback
AI Analysis | Feedback
Pierce H. Norton II - President and Chief Executive Officer
Pierce H. Norton II is the President and Chief Executive Officer of ONEOK. He previously served as the first-ever President and CEO of ONE Gas, Inc., and a member of its board, following its spin-off from ONEOK in 2014. Norton initially joined ONEOK in 2004 and held various leadership roles, including executive vice president, commercial, and executive vice president and chief operating officer. He also served as president of ONEOK's natural gas distribution companies, which included Oklahoma Natural Gas, Kansas Gas Service, and Texas Gas Service. His career in the energy industry began in 1982 at Delhi Gas Pipeline, and he held operational and leadership positions at American Oil and Gas, KN Energy, and as president of Bear Paw Energy (now ONEOK Rockies Midstream).
Walter S. Hulse III - Executive Vice President, Chief Financial Officer, Treasurer, Investor Relations and Corporate Development
Walter S. Hulse III joined ONEOK in 2015. Prior to this, he was with Spinnaker Strategic Advisory Services, LLC, a consulting firm that provided services such as reviewing merger and acquisition opportunities, debt and equity markets, corporate restructuring, and potential divestitures for publicly traded companies. Hulse consulted for ONEOK for many years, including during the separation of the company's natural gas distribution business into the stand-alone publicly traded company, ONE Gas. Before Spinnaker, he held senior roles at UBS Investment Bank, including vice chairman of the Investment Banking Department, managing director and head of the business development group, and head of the Global Utility Group. He also held various positions at PaineWebber and J.P. Morgan.
Randy N. Lentz - Executive Vice President and Chief Operating Officer
Randy N. Lentz was appointed to the newly created position of Executive Vice President and Chief Operating Officer in January 2025. Before joining ONEOK, Lentz was the Chief Executive Officer and founder of Medallion Midstream, a crude oil gathering and transportation company, which ONEOK acquired. He brings over three decades of experience in the energy industry, having held a variety of operations, commercial, and management positions within the midstream sector.
Kevin L. Burdick - Executive Vice President and Chief Enterprise Services Officer
Kevin L. Burdick is ONEOK's Executive Vice President and Chief Enterprise Services Officer, responsible for cybersecurity, information technology, enterprise optimization, innovation, and integration activities. He joined ONEOK in 2007. Prior to his current role, Burdick served as Executive Vice President and Chief Commercial Officer, and also as Executive Vice President and Chief Operating Officer. He began his career in information technology at CITGO Petroleum in 1992.
Sheridan C. Swords - Executive Vice President and Chief Commercial Officer
Sheridan C. Swords serves as Executive Vice President and Chief Commercial Officer for ONEOK, with commercial responsibility for natural gas liquids, refined products and crude oil, natural gas gathering and processing, and natural gas pipelines business segments. He joined ONEOK in 2005. His previous roles at the company included executive vice president, commercial liquids and natural gas gathering and processing. Swords started his career in the energy industry in 1992 as a division engineer for Koch Gathering Systems Co., and held various positions with Koch companies, including operations management, commercial, and commodity trading. Before joining ONEOK, he was vice president of the Mid-Continent of Koch Hydrocarbon, LP.
AI Analysis | Feedback
The key risks to ONEOK's business are primarily tied to market volatility, regulatory changes, and successful integration of acquisitions.
-
Commodity Price Volatility: ONEOK's revenues and profitability are significantly exposed to fluctuations in the prices of natural gas, natural gas liquids (NGLs), and crude oil. While the company utilizes hedging strategies, lower commodity prices can lead to reduced activity, lower earnings, and impact the renewal of hedges at favorable rates.
-
Regulatory and Environmental Pressures: Operating within the heavily regulated energy industry, ONEOK faces ongoing risks from evolving environmental and safety laws and regulations. These pressures include the broader movement toward decarbonization and ESG (Environmental, Social, and Governance) initiatives, which could impact demand for hydrocarbons, shorten asset lives, and necessitate significant capital expenditures for compliance or adaptation.
-
Integration Risks from Acquisitions: ONEOK has undertaken significant acquisitions, such as EnLink and Medallion. The successful integration of these businesses is crucial, and failure to do so effectively could lead to unforeseen expenses, unknown liabilities, loss of key employees, and disruptions to ongoing operations, ultimately affecting customer and employee relationships and the realization of anticipated synergies and growth.
AI Analysis | Feedback
AI Analysis | Feedback
AI Analysis | Feedback
- Increased Volume from Enhanced Production: The company expects continued volume growth across its natural gas and natural gas liquids (NGL) systems, driven by increased production, particularly within the Permian Basin and Gulf Coast regions.
- Full Impact of Recently Completed Projects: Revenue growth is expected from the full-year contribution of recently completed projects, such as the Elk Creek and West Texas NGL pipeline expansions, and the Denver-area refined products expansion.
- Realization of Acquisition Synergies: ONEOK projects further financial benefits from the ongoing realization of commercial and cost synergies stemming from recent acquisitions, including EnLink and Medallion.
- Commissioning of Major Capital Projects: Significant capital projects are slated to come online, contributing to revenue. These include the phased rebuild of the Medford NGL fractionator (expected completion in late 2026 and early 2027), the start-up of the Bighorn Processing Plant (mid-2027), the Texas City Logistics export terminal and related MBTC Pipeline (early 2028), and the expansion of the Eiger Express Pipeline (mid-2028).
AI Analysis | Feedback
Share Repurchases
- ONEOK's board authorized a $2 billion share repurchase program in January 2024, intended to be largely utilized over the subsequent four years.
- In the fourth quarter of 2023, ONEOK opportunistically repurchased approximately $300 million face value of its outstanding notes at a discount.
- As of December 2025, approximately $1.75 billion remained available under the $2 billion share repurchase authorization.
Share Issuance
- ONEOK's shares outstanding increased from 0.447 billion in 2021 to 0.626 billion in 2025, reflecting significant share issuance.
- The total share count nearly tripled since 2015, particularly influenced by the $18.8 billion Magellan acquisition in 2023.
- In June 2025, ONEOK announced the sale of 4.85 million shares of its common stock on behalf of certain holders.
Outbound Investments
- In September 2023, ONEOK completed the acquisition of Magellan Midstream Partners for $18.8 billion, expanding its operations into refined products and crude oil transportation.
- ONEOK finalized the acquisition of EnLink Midstream, LLC in January 2025.
- In June 2025, ONEOK acquired the remaining 49.9% stake in Delaware G&P LLC for $940 million.
Capital Expenditures
- Capital expenditures for 2025 totaled $3.15 billion and were expected to range between $2.8 billion and $3.2 billion, focusing on projects such as the Medford fractionator rebuild and Permian Basin natural gas processing plants.
- For 2026, projected capital expenditures are anticipated to be between $2.7 billion and $3.2 billion, emphasizing NGL expansions, refined products projects, and Permian gas processing infrastructure.
- Capital expenditures increased significantly in recent years, rising to $1.202 billion in 2022, $1.595 billion in 2023, and $2.021 billion in 2024.
Peer Outperformance in Oil & Gas Storage & Transportation
| Industry | Names | 1Y med | 3Y med | 5Y med | Top 3 by 5Y |
|---|---|---|---|---|---|
| Oil & Gas Refining & Marketing | 9 | 122.1% | 125.5% | 411.1% | MPC 639% · PBF 575% · VLO 548% |
| Coal & Consumable Fuels | 3 | -11.6% | 1.6% | 236.6% | CNR 242% · LEU 237% · BTU 66% |
| Oil & Gas Storage & Transportation ← | 9 | 19.1% | 135.2% | 212.9% | INSW 916% · LPG 862% · TRGP 511% |
| Oil & Gas Equipment & Services | 16 | 44.1% | 15.5% | 113.4% | SEI 917% · FTI 799% · TDW 561% |
| Oil & Gas Exploration & Production | 24 | 23.6% | 22.8% | 82.2% | PR 263% · TPL 174% · EQT 161% |
| Oil & Gas Drilling | 4 | 62.7% | 2.4% | 70.2% | VAL 123% · NE 78% · HP 63% |
Latest Trefis Analyses
| Title | Date | |
|---|---|---|
| DASHBOARDS | ||
| 7-Day Rally Sends ONEOK Stock Up 12% | 08/19/2026 | |
| null | 06/02/2026 | |
| ONEOK Stock Surges 12%, With A 7-Day Winning Spree | 05/20/2026 | |
| ONEOK Stock 7-Day Winning Spree: Stock Climbs 7.5% | 04/29/2026 | |
| ONEOK Stock 7-Day Winning Spree: Stock Climbs 9.0% | 03/28/2026 | |
| ONEOK Stock Rockets 8.6% With 6-Day Winning Streak | 03/27/2026 | |
| OKE Stock Surges 13% With A 7-day Winning Spree On 4% Dividend Hike | 02/12/2026 | |
| Is Wall Street Underestimating ONEOK Stock's Potential? | 01/08/2026 | |
| ONEOK Earnings Notes | 12/26/2025 | |
| ARTICLES | ||
| 6 Large Cap Stocks Just Made New 52-Week Highs | 09/09/2026 | |
| ONEOK Stock Rides A 7-Day Winning Streak To A 12% Gain | 08/19/2026 | |
| Large Cap Stocks Trading At 52-Week High | 05/19/2026 | |
| ONEOK Stock Rockets 7.5% With 7-Day Winning Streak | 04/29/2026 | |
| ONEOK Stock On Fire: Up 9% With 7-Day Winning Streak | 03/28/2026 |
Research & Analysis
Invest in Strategies
Wealth Management
Peer Comparisons
| Peers to compare with: |
Financials
| Median | |
|---|---|
| Name | |
| Mkt Price | 77.96 |
| Mkt Cap | 63.8 |
| Rev LTM | 17,350 |
| Op Inc LTM | 4,948 |
| FCF LTM | 1,823 |
| FCF 3Y Avg | 2,148 |
| CFO LTM | 6,076 |
| CFO 3Y Avg | 5,467 |
Growth & Margins
| Median | |
|---|---|
| Name | |
| Rev Chg LTM | 10.6% |
| Rev Chg 3Y Avg | 2.2% |
| Rev Chg Q | 10.3% |
| QoQ Delta Rev Chg LTM | 2.4% |
| Op Inc Chg LTM | 22.7% |
| Op Inc Chg 3Y Avg | 11.9% |
| Op Mgn LTM | 26.0% |
| Op Mgn 3Y Avg | 23.7% |
| QoQ Delta Op Mgn LTM | 0.7% |
| CFO/Rev LTM | 31.1% |
| CFO/Rev 3Y Avg | 30.0% |
| FCF/Rev LTM | 5.9% |
| FCF/Rev 3Y Avg | 12.3% |
Valuation
| Median | |
|---|---|
| Name | |
| Mkt Cap | 63.8 |
| P/S | 3.7 |
| P/Op Inc | 14.3 |
| P/EBIT | 13.9 |
| P/E | 23.0 |
| P/CFO | 12.2 |
| Total Yield | 7.8% |
| Dividend Yield | 3.4% |
| FCF Yield 3Y Avg | 4.0% |
| D/E | 0.4 |
| Net D/E | 0.4 |
Returns
| Median | |
|---|---|
| Name | |
| 1M Rtn | -6.6% |
| 3M Rtn | -2.1% |
| 6M Rtn | -1.0% |
| 12M Rtn | 18.7% |
| 3Y Rtn | 126.3% |
| 1M Excs Rtn | -7.0% |
| 3M Excs Rtn | -4.5% |
| 6M Excs Rtn | -16.9% |
| 12M Excs Rtn | 4.3% |
| 3Y Excs Rtn | 42.8% |
Comparison Analyses
Segment Financials
Revenue by Segment| $ Mil | 2025 | 2024 | 2023 | 2022 | 2021 |
|---|---|---|---|---|---|
| Natural Gas Liquids | 16,010 | 15,167 | 14,429 | 19,067 | 14,392 |
| Refined Products and Crude | 13,039 | 4,460 | 1,071 | ||
| Natural Gas Gathering and Processing | 7,684 | 4,589 | 4,056 | 6,533 | 4,461 |
| Natural Gas Pipelines | 1,846 | 822 | 623 | 579 | 607 |
| Other and Eliminations | -4,950 | -3,340 | -2,502 | -3,792 | -2,920 |
| Total | 33,629 | 21,698 | 17,677 | 22,387 | 16,540 |
| $ Mil | 2015 | 2014 | 2013 | 2012 | 2011 |
|---|---|---|---|---|---|
| Natural Gas Liquids | 767 | 689 | |||
| Natural Gas Pipelines | 153 | 181 | |||
| Natural Gas Gathering and Processing | 78 | 281 | |||
| Other and Eliminations | -2 | -7 | -11 | 2 | -2 |
| Energy Services | -186 | -78 | 24 | ||
| Natural Gas Distribution | 223 | 216 | 198 | ||
| ONEOK Partners | 901 | 963 | 940 | ||
| Total | 996 | 1,144 | 927 | 1,102 | 1,159 |
| $ Mil | 2025 | 2024 | 2023 | 2022 | 2021 |
|---|---|---|---|---|---|
| Refined Products and Crude | 25,255 | 23,181 | 19,531 | ||
| Natural Gas Liquids | 20,415 | 19,797 | 14,974 | 14,643 | 14,502 |
| Natural Gas Gathering and Processing | 16,757 | 15,856 | 7,078 | 6,980 | 6,769 |
| Natural Gas Pipelines | 4,805 | 5,041 | 2,624 | 2,254 | 2,143 |
| Other and Eliminations | -591 | 194 | 59 | 502 | 208 |
| Total | 66,641 | 64,069 | 44,266 | 24,379 | 23,622 |
Price Behavior
| Market Price | $87.16 | |
| Market Cap ($ Bil) | 55.0 | |
| First Trading Date | 07/01/1985 | |
| Distance from 52W High | -10.6% | |
| 50 Days | 200 Days | |
| DMA Price | $92.15 | $85.27 |
| DMA Trend | up | up |
| Distance from DMA | -5.4% | 2.2% |
| 3M | 1YR | |
| Volatility | 26.1% | 27.0% |
| Downside Capture | -86.20 | -62.59 |
| Upside Capture | -71.39 | -24.84 |
| Correlation (SPY) | -31.2% | -20.6% |
| 1M | 2M | 3M | 6M | 1Y | 3Y | |
|---|---|---|---|---|---|---|
| Beta | -0.17 | -0.43 | -0.73 | -0.85 | -0.43 | 0.54 |
| Up Beta | -0.21 | -0.93 | -0.39 | -1.51 | -1.01 | 0.51 |
| Down Beta | -1.40 | 0.95 | -0.59 | -0.44 | 0.13 | 0.97 |
| Up Capture | -53% | -50% | -71% | -43% | -15% | 13% |
| Bmk +ve Days | 6 | 16 | 27 | 66 | 132 | 424 |
| Stock +ve Days | 9 | 19 | 30 | 63 | 133 | 416 |
| Down Capture | 116% | -16% | -106% | -113% | -110% | 52% |
| Bmk -ve Days | 16 | 26 | 37 | 60 | 120 | 328 |
| Stock -ve Days | 13 | 23 | 34 | 63 | 118 | 333 |
[1] Upside and downside betas calculated using positive and negative benchmark daily returns respectively
Based On 1-Year Data
| Annualized Return | Annualized Volatility | Sharpe Ratio | Correlation with OKE | |
|---|---|---|---|---|
| OKE | 26.0% | 27.0% | 0.83 | - |
| Sector ETF (XLE) | 43.7% | 22.0% | 1.56 | 73.3% |
| Equity (SPY) | 15.7% | 13.0% | 0.85 | -20.7% |
| Gold (GLD) | 7.7% | 29.6% | 0.25 | -7.2% |
| Commodities (DBC) | 43.7% | 20.8% | 1.64 | 41.4% |
| Real Estate (VNQ) | 1.2% | 13.6% | -0.16 | 7.4% |
| Bitcoin (BTCUSD) | -27.0% | 44.5% | -0.58 | -1.8% |
Smart multi-asset allocation framework can stack odds in your favor. Learn How
Based On 5-Year Data
| Annualized Return | Annualized Volatility | Sharpe Ratio | Correlation with OKE | |
|---|---|---|---|---|
| OKE | 14.7% | 27.9% | 0.50 | - |
| Sector ETF (XLE) | 24.1% | 25.5% | 0.83 | 77.2% |
| Equity (SPY) | 13.0% | 17.2% | 0.57 | 45.9% |
| Gold (GLD) | 18.6% | 18.9% | 0.80 | 7.3% |
| Commodities (DBC) | 10.3% | 19.6% | 0.40 | 46.2% |
| Real Estate (VNQ) | 0.4% | 18.9% | -0.08 | 44.1% |
| Bitcoin (BTCUSD) | 13.2% | 52.3% | 0.43 | 17.5% |
Smart multi-asset allocation framework can stack odds in your favor. Learn How
Based On 10-Year Data
| Annualized Return | Annualized Volatility | Sharpe Ratio | Correlation with OKE | |
|---|---|---|---|---|
| OKE | 12.5% | 38.8% | 0.43 | - |
| Sector ETF (XLE) | 10.6% | 29.6% | 0.39 | 78.9% |
| Equity (SPY) | 15.3% | 17.9% | 0.72 | 51.8% |
| Gold (GLD) | 11.6% | 16.4% | 0.58 | 3.8% |
| Commodities (DBC) | 8.2% | 18.1% | 0.37 | 46.2% |
| Real Estate (VNQ) | 4.4% | 20.7% | 0.17 | 49.9% |
| Bitcoin (BTCUSD) | 63.9% | 66.2% | 1.04 | 14.4% |
Smart multi-asset allocation framework can stack odds in your favor. Learn How
Returns Analyses
Earnings Returns History
Updated 8/3/2026| Forward Returns | |||
|---|---|---|---|
| Earnings Date | 1D Returns | 5D Returns | 21D Returns |
| 4/28/2026 | -0.5% | 1.5% | -1.9% |
| 2/23/2026 | -5.1% | -1.4% | 4.1% |
| 10/28/2025 | -2.7% | -5.5% | 5.1% |
| 8/4/2025 | -5.2% | -7.7% | -7.5% |
| 4/29/2025 | -6.5% | -8.6% | -7.0% |
| 2/24/2025 | -2.4% | -1.4% | 4.3% |
| 10/29/2024 | 0.6% | 4.3% | 19.1% |
| 8/5/2024 | 4.7% | 8.3% | 16.2% |
| ... | |||
| SUMMARY STATS | |||
| # Positive | 8 | 15 | 16 |
| # Negative | 15 | 8 | 7 |
| Median Positive | 2.2% | 3.0% | 4.7% |
| Median Negative | -2.3% | -2.7% | -7.0% |
| Max Positive | 4.7% | 8.3% | 32.1% |
| Max Negative | -6.5% | -8.6% | -10.2% |
| Forward Returns | |||
|---|---|---|---|
| Earnings Date | 1D Returns | 5D Returns | 21D Returns |
| 4/28/2026 | -0.5% | 1.5% | -1.9% |
| 2/23/2026 | -5.1% | -1.4% | 4.1% |
| 10/28/2025 | -2.7% | -5.5% | 5.1% |
| 8/4/2025 | -5.2% | -7.7% | -7.5% |
| 4/29/2025 | -6.5% | -8.6% | -7.0% |
| 2/24/2025 | -2.4% | -1.4% | 4.3% |
| 10/29/2024 | 0.6% | 4.3% | 19.1% |
| 8/5/2024 | 4.7% | 8.3% | 16.2% |
| 4/30/2024 | -2.8% | -0.9% | 1.0% |
| 2/26/2024 | 2.0% | 5.0% | 7.9% |
| 10/31/2023 | -1.0% | -0.8% | 5.6% |
| 8/7/2023 | -1.6% | 1.2% | -2.4% |
| 5/2/2023 | 0.1% | 1.8% | -9.3% |
| 2/27/2023 | -3.7% | 1.0% | -10.2% |
| 11/1/2022 | -1.7% | 4.3% | 11.9% |
| 8/8/2022 | 3.7% | 7.2% | 2.0% |
| 5/3/2022 | 3.4% | -4.1% | 3.5% |
| 2/28/2022 | -2.3% | 4.9% | 9.1% |
| 11/2/2021 | -0.2% | 0.9% | -5.3% |
| 8/3/2021 | 0.6% | 2.5% | 1.3% |
| 4/27/2021 | 2.5% | 3.3% | 3.2% |
| 2/22/2021 | -1.0% | 3.0% | 2.9% |
| 10/27/2020 | -0.8% | 1.8% | 32.1% |
| SUMMARY STATS | |||
| # Positive | 8 | 15 | 16 |
| # Negative | 15 | 8 | 7 |
| Median Positive | 2.2% | 3.0% | 4.7% |
| Median Negative | -2.3% | -2.7% | -7.0% |
| Max Positive | 4.7% | 8.3% | 32.1% |
| Max Negative | -6.5% | -8.6% | -10.2% |
SEC Filings
Expand for More| Report Date | Filing Date | Filing |
|---|---|---|
| 06/30/2026 | 08/04/2026 | 10-Q |
| 03/31/2026 | 04/29/2026 | 10-Q |
| 12/31/2025 | 02/24/2026 | 10-K |
| 09/30/2025 | 10/29/2025 | 10-Q |
| 06/30/2025 | 08/05/2025 | 10-Q |
| 03/31/2025 | 04/30/2025 | 10-Q |
| 12/31/2024 | 02/25/2025 | 10-K |
| 09/30/2024 | 10/30/2024 | 10-Q |
| 06/30/2024 | 08/06/2024 | 10-Q |
| 03/31/2024 | 05/01/2024 | 10-Q |
| 12/31/2023 | 02/27/2024 | 10-K |
| 09/30/2023 | 11/01/2023 | 10-Q |
| 06/30/2023 | 08/08/2023 | 10-Q |
| 03/31/2023 | 05/03/2023 | 10-Q |
| 12/31/2022 | 02/28/2023 | 10-K |
| 09/30/2022 | 11/02/2022 | 10-Q |
| Report Date | Filing Date | Filing |
|---|---|---|
| 06/30/2026 | 08/04/2026 | 10-Q |
| 03/31/2026 | 04/29/2026 | 10-Q |
| 12/31/2025 | 02/24/2026 | 10-K |
| 09/30/2025 | 10/29/2025 | 10-Q |
| 06/30/2025 | 08/05/2025 | 10-Q |
| 03/31/2025 | 04/30/2025 | 10-Q |
| 12/31/2024 | 02/25/2025 | 10-K |
| 09/30/2024 | 10/30/2024 | 10-Q |
| 06/30/2024 | 08/06/2024 | 10-Q |
| 03/31/2024 | 05/01/2024 | 10-Q |
| 12/31/2023 | 02/27/2024 | 10-K |
| 09/30/2023 | 11/01/2023 | 10-Q |
| 06/30/2023 | 08/08/2023 | 10-Q |
| 03/31/2023 | 05/03/2023 | 10-Q |
| 12/31/2022 | 02/28/2023 | 10-K |
| 09/30/2022 | 11/02/2022 | 10-Q |
| 06/30/2022 | 08/09/2022 | 10-Q |
| 03/31/2022 | 05/04/2022 | 10-Q |
| 12/31/2021 | 03/01/2022 | 10-K |
| 09/30/2021 | 11/03/2021 | 10-Q |
| 06/30/2021 | 08/04/2021 | 10-Q |
| 03/31/2021 | 04/28/2021 | 10-Q |
| 12/31/2020 | 02/23/2021 | 10-K |
| 09/30/2020 | 10/28/2020 | 10-Q |
| 06/30/2020 | 07/29/2020 | 10-Q |
| 03/31/2020 | 04/29/2020 | 10-Q |
| 12/31/2019 | 02/25/2020 | 10-K |
| 09/30/2019 | 10/30/2019 | 10-Q |
Recent Forward Guidance
Updated 7/8/2026Latest: Q1 2026 Earnings Reported 4/28/2026
| Forward Guidance | Guidance Change | |||||||
|---|---|---|---|---|---|---|---|---|
| Metric | Source | Low | Mid | High | % Chg | % Delta | Change | Prior |
| 2026 Earnings per diluted share | Reported | 5.53 | 1.5% | Raised | Guidance: 5.45 for 2026 | |||
| 2026 Adjusted EBITDA | Reported | 8.00 Bil | 8.25 Bil | 8.50 Bil | 1.9% | Raised | Guidance: 8.10 Bil for 2026 | |
| 2026 Net Income | Reported | 3.21 Bil | 3.50 Bil | 3.79 Bil | 1.4% | Raised | Guidance: 3.45 Bil for 2026 | |
| 2026 Capital Expenditures | Reported | 2.70 Bil | 2.95 Bil | 3.20 Bil | 0 | Affirmed | Guidance: 2.95 Bil for 2026 | |
Prior: Q4 2025 Earnings Reported 2/23/2026
| Forward Guidance | Guidance Change | |||||||
|---|---|---|---|---|---|---|---|---|
| Metric | Source | Low | Mid | High | % Chg | % Delta | Change | Prior |
| 2026 Earnings per diluted share | Reported | 5.04 | 5.45 | 5.86 | ||||
| 2026 Adjusted EBITDA | Reported | 7.90 Bil | 8.10 Bil | 8.30 Bil | ||||
| 2026 Net income | Reported | 3.19 Bil | 3.45 Bil | 3.71 Bil | ||||
| 2026 Total capital expenditures | Reported | 2.70 Bil | 2.95 Bil | 3.20 Bil | ||||
Insider Activity
Updated 9/24/2026| # | Owner | Title | Holding | Action | Filing Date | Price | Shares | Transacted Value | Value of Held Shares | Form |
|---|---|---|---|---|---|---|---|---|---|---|
| 1 | Derksen, Brian L | Direct | Buy | 11052025 | 66.00 | 2,500 | 165,000 | 1,399,200 | Form |
| # | Owner | Title | Holding | Action | Filing Date | Price | Shares | Transacted Value | Value of Held Shares | Form |
|---|---|---|---|---|---|---|---|---|---|---|
| 1 | Derksen, Brian L | Direct | Buy | 11052025 | 66.00 | 2,500 | 165,000 | 1,399,200 | Form |
Investor Activity (13F)
Updated Oct 2, 2026Active managers (13F portfolio over $250M, at least 3 holdings) with a position over $5M that is either over 10% of their portfolio or held in a concentrated book of 50 or fewer total positions. Index/ETF, sovereign, bank, community-bank and charitable/donor-advised filers are excluded.
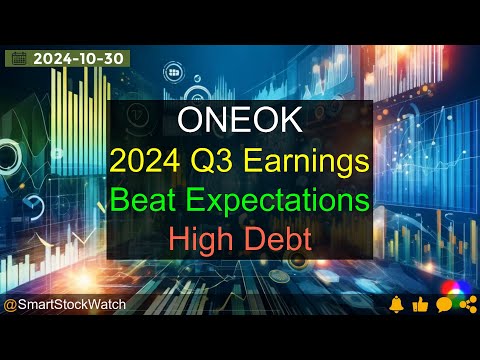
ONEOK — Investor Video Playlist



Industry Resources
External Quote Links
| Y Finance | Barrons |
| TradingView | Morningstar |
| SeekingAlpha | ValueLine |
| Motley Fool | Robinhood |
| CNBC | Etrade |
| MarketWatch | Unusual Whales |
| YCharts | Perplexity Finance |
| FinViz |
Prefer one of these to Trefis? Tell us why.