
Guardant Health (GH)
Market Price (9/18/2026): $182.99 | Market Cap: $24.3 BilSector: Health Care | Industry: Life Sciences Tools & Services
Guardant Health (GH)
Market Price (9/18/2026): $182.99Market Cap: $24.3 BilSector: Health CareIndustry: Life Sciences Tools & Services
Investment Highlights Why It Matters Detailed financial logic regarding cash flow yields vs trend-riding momentum.
Strong revenue growthRev Chg LTMRevenue Change % Last Twelve Months (LTM) is 43% Megatrend and thematic driversMegatrends include Biotechnology & Genomics, Precision Medicine, and Aging Population & Chronic Disease. Themes include Advanced Diagnostics, Show more. | Trading close to highsDist 52W High is 0.0%, Dist 3Y High is 0.0% | Not profitable at operating income levelOp Inc LTMOperating Income, Last Twelve Months is -470 Mil, Op Mgn LTMOperating Margin = Operating Income / Revenue Reflects profitability before taxes and before impact of capital structure (interest payments). is -40% Stock price has recently run up significantly6M Rtn6 month market price return is 106%, 12M Rtn12 month market price return is 220% Significant share based compensationSBC/Rev LTMShare Based Compensation / Revenue (Sales), Last Twelve Months (LTM) is 16% Not cash flow generativeCFO/Rev LTMCash Flow from Operations / Revenue (Sales), Last Twelve Months (LTM) is -16%, FCF/Rev LTMFree Cash Flow / Revenue (Sales), Last Twelve Months (LTM) is -20% Valuation getting more expensiveP/S 6M Chg %Price/Sales change over 6 months. Declining P/S indicates valuation has become less expensive. is 83% Yield minus risk free rate is negativeERPEquity Risk Premium (ERP) = Total Yield - Risk Free Rate, Reflects the premium above risk free assets offered by the investment. is -5.9% Key risksGH key risks include [1] its ongoing unprofitability combined with a high market valuation creating significant execution pressure and [2] considerable insider selling activity. |
| Strong revenue growthRev Chg LTMRevenue Change % Last Twelve Months (LTM) is 43% |
| Megatrend and thematic driversMegatrends include Biotechnology & Genomics, Precision Medicine, and Aging Population & Chronic Disease. Themes include Advanced Diagnostics, Show more. |
| Trading close to highsDist 52W High is 0.0%, Dist 3Y High is 0.0% |
| Not profitable at operating income levelOp Inc LTMOperating Income, Last Twelve Months is -470 Mil, Op Mgn LTMOperating Margin = Operating Income / Revenue Reflects profitability before taxes and before impact of capital structure (interest payments). is -40% |
| Stock price has recently run up significantly6M Rtn6 month market price return is 106%, 12M Rtn12 month market price return is 220% |
| Significant share based compensationSBC/Rev LTMShare Based Compensation / Revenue (Sales), Last Twelve Months (LTM) is 16% |
| Not cash flow generativeCFO/Rev LTMCash Flow from Operations / Revenue (Sales), Last Twelve Months (LTM) is -16%, FCF/Rev LTMFree Cash Flow / Revenue (Sales), Last Twelve Months (LTM) is -20% |
| Valuation getting more expensiveP/S 6M Chg %Price/Sales change over 6 months. Declining P/S indicates valuation has become less expensive. is 83% |
| Yield minus risk free rate is negativeERPEquity Risk Premium (ERP) = Total Yield - Risk Free Rate, Reflects the premium above risk free assets offered by the investment. is -5.9% |
| Key risksGH key risks include [1] its ongoing unprofitability combined with a high market valuation creating significant execution pressure and [2] considerable insider selling activity. |
Qualitative Assessment
AI Analysis | Feedback
Guardant Health (GH) stock has gained about 40% since 5/31/2026 because of the following key factors:
1. Expanded Product Portfolio and Market Approvals. Guardant Health achieved several key FDA approvals that significantly broadened its product utility and market access. Just prior to the period, on May 20, 2026, the company received FDA approval for Guardant360 Liquid CDx, a liquid biopsy panel with a 100x expanded genomic footprint, which analysts anticipated would allow for higher pricing. Subsequently, Guardant360 CDx gained companion diagnostic approvals for Boehringer Ingelheim's HERNEXEOS on June 11, 2026, for non-small cell lung cancer, and for AstraZeneca's ETCAMAH™ in advanced breast cancer on September 4, 2026. The latter made Guardant360 CDx the first FDA-approved liquid biopsy CDx for longitudinal testing in breast cancer, expanding its global companion diagnostic indications to 29.
2. Exceptional Fiscal Q2 2026 Financial Results and Increased Full-Year Guidance. Guardant Health reported robust financial performance for fiscal Q2 2026, with total revenue surging 44% year-over-year to $335 million, exceeding analyst estimates by approximately 6.5%. Oncology revenue increased 38% to $219.1 million with a 63% rise in test volumes, while Screening (Shield) revenue dramatically increased by 250% to $53 million on approximately 66,000 tests. This strong performance, reported on July 30, 2026, led the company to raise its full-year 2026 revenue guidance to a range of $1.34 billion to $1.36 billion, representing 36% to 38% growth compared to 2025, up from previous guidance of 32% to 34% growth.
Show more
Guardant Health (GH) stock has gained about 40% since 5/31/2026 because of the following key factors:
1. Expanded Product Portfolio and Market Approvals. Guardant Health achieved several key FDA approvals that significantly broadened its product utility and market access. Just prior to the period, on May 20, 2026, the company received FDA approval for Guardant360 Liquid CDx, a liquid biopsy panel with a 100x expanded genomic footprint, which analysts anticipated would allow for higher pricing. Subsequently, Guardant360 CDx gained companion diagnostic approvals for Boehringer Ingelheim's HERNEXEOS on June 11, 2026, for non-small cell lung cancer, and for AstraZeneca's ETCAMAH™ in advanced breast cancer on September 4, 2026. The latter made Guardant360 CDx the first FDA-approved liquid biopsy CDx for longitudinal testing in breast cancer, expanding its global companion diagnostic indications to 29.
2. Exceptional Fiscal Q2 2026 Financial Results and Increased Full-Year Guidance. Guardant Health reported robust financial performance for fiscal Q2 2026, with total revenue surging 44% year-over-year to $335 million, exceeding analyst estimates by approximately 6.5%. Oncology revenue increased 38% to $219.1 million with a 63% rise in test volumes, while Screening (Shield) revenue dramatically increased by 250% to $53 million on approximately 66,000 tests. This strong performance, reported on July 30, 2026, led the company to raise its full-year 2026 revenue guidance to a range of $1.34 billion to $1.36 billion, representing 36% to 38% growth compared to 2025, up from previous guidance of 32% to 34% growth.
3. Significant Commercial Momentum and Coverage Expansion for Shield Blood Test. The Shield blood test experienced substantial commercial traction, evidenced by a 250% increase in screening revenue during fiscal Q2 2026. This growth was driven by expanded payer coverage, notably from UnitedHealth Group for approximately 70 million lives and Carelon Health for around 90 million lives. Furthermore, the American Cancer Society's recommendation for Guardant Health's Shield test in its updated colorectal cancer screening guidelines on May 26, 2026, significantly bolstered its market acceptance, with total coverage now reaching 80% of eligible patients, or 94 million people.
Show less
Stock Movement Drivers
Fundamental Drivers
The 41.2% change in GH stock from 5/31/2026 to 9/17/2026 was primarily driven by a 30.5% change in the company's P/S Multiple.| (LTM values as of) | 5312026 | 9172026 | Change |
|---|---|---|---|
| Stock Price ($) | 129.69 | 183.10 | 41.2% |
| Change Contribution By: | |||
| Total Revenues ($ Mil) | 1,080 | 1,183 | 9.5% |
| P/S Multiple | 15.8 | 20.6 | 30.5% |
| Shares Outstanding (Mil) | 131 | 133 | -1.2% |
| Cumulative Contribution | 41.2% |
Market Drivers
5/31/2026 to 9/17/2026| Return | Correlation | |
|---|---|---|
| GH | 41.2% | |
| Market (SPY) | 0.8% | 18.1% |
| Sector (XLV) | 12.9% | 12.2% |
Fundamental Drivers
The 95.0% change in GH stock from 2/28/2026 to 9/17/2026 was primarily driven by a 67.1% change in the company's P/S Multiple.| (LTM values as of) | 2282026 | 9172026 | Change |
|---|---|---|---|
| Stock Price ($) | 93.90 | 183.10 | 95.0% |
| Change Contribution By: | |||
| Total Revenues ($ Mil) | 982 | 1,183 | 20.5% |
| P/S Multiple | 12.3 | 20.6 | 67.1% |
| Shares Outstanding (Mil) | 129 | 133 | -3.1% |
| Cumulative Contribution | 95.0% |
Market Drivers
2/28/2026 to 9/17/2026| Return | Correlation | |
|---|---|---|
| GH | 95.0% | |
| Market (SPY) | 11.5% | 28.4% |
| Sector (XLV) | 5.8% | 24.0% |
Fundamental Drivers
The 171.6% change in GH stock from 8/31/2025 to 9/17/2026 was primarily driven by a 103.7% change in the company's P/S Multiple.| (LTM values as of) | 8312025 | 9172026 | Change |
|---|---|---|---|
| Stock Price ($) | 67.42 | 183.10 | 171.6% |
| Change Contribution By: | |||
| Total Revenues ($ Mil) | 829 | 1,183 | 42.7% |
| P/S Multiple | 10.1 | 20.6 | 103.7% |
| Shares Outstanding (Mil) | 124 | 133 | -6.6% |
| Cumulative Contribution | 171.6% |
Market Drivers
8/31/2025 to 9/17/2026| Return | Correlation | |
|---|---|---|
| GH | 171.6% | |
| Market (SPY) | 19.2% | 19.7% |
| Sector (XLV) | 24.4% | 18.3% |
Fundamental Drivers
The 368.5% change in GH stock from 8/31/2023 to 9/17/2026 was primarily driven by a 146.7% change in the company's P/S Multiple.| (LTM values as of) | 8312023 | 9172026 | Change |
|---|---|---|---|
| Stock Price ($) | 39.08 | 183.10 | 368.5% |
| Change Contribution By: | |||
| Total Revenues ($ Mil) | 510 | 1,183 | 131.9% |
| P/S Multiple | 8.3 | 20.6 | 146.7% |
| Shares Outstanding (Mil) | 109 | 133 | -18.1% |
| Cumulative Contribution | 368.5% |
Market Drivers
8/31/2023 to 9/17/2026| Return | Correlation | |
|---|---|---|
| GH | 368.5% | |
| Market (SPY) | 75.3% | 31.2% |
| Sector (XLV) | 32.7% | 23.6% |
Price Returns Compared
| 2021 | 2022 | 2023 | 2024 | 2025 | 2026 | Total [1] | |
|---|---|---|---|---|---|---|---|
| Returns | |||||||
| GH Return | -22% | -73% | -1% | 13% | 234% | 71% | 36% |
| Peers Return | 30% | -30% | 5% | 27% | 16% | 32% | 85% |
| S&P 500 Return | 27% | -19% | 24% | 23% | 16% | 10% | 101% |
Monthly Win Rates [3] | |||||||
| GH Win Rate | 42% | 25% | 50% | 42% | 58% | 56% | |
| Peers Win Rate | 69% | 25% | 38% | 44% | 47% | 60% | |
| S&P 500 Win Rate | 75% | 42% | 67% | 75% | 67% | 44% | |
Max Drawdowns [4] | |||||||
| GH Max Drawdown | -50% | -75% | -46% | -44% | -28% | -33% | |
| Peers Max Drawdown | -26% | -39% | -32% | -16% | -46% | -35% | |
| S&P 500 Max Drawdown | -5% | -25% | -10% | -8% | -19% | -9% | |
[1] Cumulative total returns since the beginning of 2021
[2] Peers: NTRA, TEM, CAI, ILMN, TMO. See GH Returns vs. Peers.
[3] Win Rate = % of calendar months in which monthly returns were positive
[4] Max drawdown represents maximum peak-to-trough decline within a year
[5] 2026 data is for the year up to 9/17/2026 (YTD)
How Low Can It Go
| Event | GH | S&P 500 |
|---|---|---|
| 2025 US Tariff Shock | ||
| % Loss | -26.9% | -18.8% |
| % Gain to Breakeven | 36.7% | 23.1% |
| Time to Breakeven | 50 days | 79 days |
| Summer-Fall 2023 Five Percent Yield Shock | ||
| % Loss | -44.4% | -9.5% |
| % Gain to Breakeven | 79.8% | 10.5% |
| Time to Breakeven | 438 days | 24 days |
| 2023 SVB Regional Banking Crisis | ||
| % Loss | -24.8% | -6.7% |
| % Gain to Breakeven | 33.0% | 7.1% |
| Time to Breakeven | 19 days | 31 days |
| 2022 Inflation Shock & Fed Tightening | ||
| % Loss | -71.3% | -24.5% |
| % Gain to Breakeven | 248.7% | 32.4% |
| Time to Breakeven | 1290 days | 427 days |
| 2020 COVID-19 Crash | ||
| % Loss | -31.9% | -33.7% |
| % Gain to Breakeven | 46.8% | 50.9% |
| Time to Breakeven | 53 days | 140 days |
In The Past
Guardant Health's stock fell -26.9% during the 2025 US Tariff Shock. Such a loss loss requires a 36.7% gain to breakeven.
Preserve Wealth
Limiting losses and compounding gains is essential to preserving wealth.
Asset Allocation
Actively managed asset allocation strategies protect wealth. Learn more.
| Event | GH | S&P 500 |
|---|---|---|
| 2025 US Tariff Shock | ||
| % Loss | -26.9% | -18.8% |
| % Gain to Breakeven | 36.7% | 23.1% |
| Time to Breakeven | 50 days | 79 days |
| Summer-Fall 2023 Five Percent Yield Shock | ||
| % Loss | -44.4% | -9.5% |
| % Gain to Breakeven | 79.8% | 10.5% |
| Time to Breakeven | 438 days | 24 days |
| 2023 SVB Regional Banking Crisis | ||
| % Loss | -24.8% | -6.7% |
| % Gain to Breakeven | 33.0% | 7.1% |
| Time to Breakeven | 19 days | 31 days |
| 2022 Inflation Shock & Fed Tightening | ||
| % Loss | -71.3% | -24.5% |
| % Gain to Breakeven | 248.7% | 32.4% |
| Time to Breakeven | 1290 days | 427 days |
| 2020 COVID-19 Crash | ||
| % Loss | -31.9% | -33.7% |
| % Gain to Breakeven | 46.8% | 50.9% |
| Time to Breakeven | 53 days | 140 days |
In The Past
Guardant Health's stock fell -26.9% during the 2025 US Tariff Shock. Such a loss loss requires a 36.7% gain to breakeven.
Preserve Wealth
Limiting losses and compounding gains is essential to preserving wealth.
Asset Allocation
Actively managed asset allocation strategies protect wealth. Learn more.
About Guardant Health (GH)
Guardant Health, Inc. (GH) is a precision oncology company dedicated to transforming cancer care through advanced technology. The company develops and provides innovative blood tests, known as liquid biopsies, alongside complementary data sets and analytics platforms. These offerings aim to deliver crucial insights throughout various stages of cancer, from early detection and diagnosis to treatment selection and ongoing monitoring.
The company's main products include a suite of liquid biopsy tests. Guardant360, Guardant360 CDx, and GuardantOMNI are primarily utilized for advanced-stage cancer patients to identify actionable genetic alterations and guide personalized treatment decisions. For patients with early-stage cancer, the Guardant Reveal Test assists in treatment selection. Guardant Health is also actively developing LUNAR-2 for the early detection of colorectal cancer in asymptomatic individuals. Beyond diagnostics, GuardantINFORM serves as a valuable clinical-genomic research platform, while GuardantConnect helps link patients with relevant clinical trials. The company also provides development services, such as companion diagnostic development, to biopharmaceutical partners.
Guardant Health serves a diverse customer base within the global oncology market. Its primary customers include oncologists and other healthcare providers who use the company's tests for patients with advanced or early-stage cancer to inform treatment strategies. Biopharmaceutical companies and medical institutions also form a significant client segment, leveraging Guardant Health's expertise for companion diagnostic development, clinical trial support, and research through its data platforms. The company's services are available to improve cancer patient outcomes in both the United States and internationally.
AI Analysis | Feedback
Here are 1-3 brief analogies for Guardant Health:
- Guardant Health is like a "23andMe for cancer detection."
- It's also like a "Ring doorbell for your body, giving early warnings about cancer."
- Furthermore, it's like a "Bloomberg Terminal for oncology research data."
AI Analysis | Feedback
- Advanced Cancer Liquid Biopsy Tests: Provide comprehensive genomic profiling for advanced stage cancer using blood samples.
- Guardant Reveal Test: Used for neoadjuvant and adjuvant treatment selection in early-stage cancer patients.
- LUNAR-2 Test: In development for the early detection of colorectal cancer in asymptomatic individuals.
- GuardantINFORM: An in-silico research platform comprising a clinical-genomic liquid biopsy dataset.
- Biopharmaceutical Development Services: Offers comprehensive services including companion diagnostic development, clinical study support, and regulatory assistance to biopharma and medical institutions.
AI Analysis | Feedback
Major Customers of Guardant Health (GH)
Guardant Health (GH) primarily sells its products and services to other companies and organizations, rather than directly to individual consumers. The company's major customers, as identified from the provided description, fall into the following categories:
- Biopharmaceutical Companies: Guardant Health offers specialized development services, including companion diagnostic development and regulatory approval, clinical study setup, monitoring and maintenance, and testing development and support. They also provide access to the GuardantINFORM research platform and GuardantConnect solution, which links patients with relevant clinical trials, primarily benefiting biopharmaceutical companies engaged in drug discovery and development.
- Medical Institutions: This category includes hospitals, clinics, and academic medical centers. These institutions are customers for Guardant Health's liquid biopsy-based tests (e.g., Guardant360, GuardantOMNI, Guardant Reveal) for advanced and early-stage cancer detection and treatment selection. They also engage Guardant Health for various development services related to clinical studies and diagnostic support.
The provided company description does not list specific names of individual customer companies within these categories.
AI Analysis | Feedback
- Illumina, Inc. (ILMN)
- Danaher Corporation (DHR)
- Twist Bioscience Corporation (TWST)
- Thermo Fisher Scientific, Inc. (TMO)
AI Analysis | Feedback
Helmy Eltoukhy Co-CEO and Chairman
Helmy Eltoukhy is the Chairman and co-CEO of Guardant Health, which he co-founded in 2012 with Dr. AmirAli Talasaz. Prior to Guardant Health, Eltoukhy co-founded Avantome in 2007 to commercialize semiconductor sequencing, which was acquired by Illumina in 2008. While at Illumina, he served as senior director of Advanced Technology Research. Eltoukhy received his PhD, MS, and BS degrees in electrical engineering from Stanford University.
AmirAli Talasaz Co-CEO
AmirAli Talasaz is the co-CEO of Guardant Health, which he co-founded in 2012 with Helmy Eltoukhy. Before co-founding Guardant Health, Talasaz was senior director of Diagnostics Research at Illumina, where he led efforts for emerging clinical applications of next-generation genomic analysis. He also founded Auriphex Biosciences, a company focused on purifying and genetically analyzing circulating tumor cells for cancer management, whose technology was acquired by Illumina in 2009. Talasaz received his PhD in electrical engineering and MSc in management science from Stanford University.
Michael Bell Chief Financial Officer
Michael Bell is the Chief Financial Officer at Guardant Health, a position he has held since January 2021. He has over 30 years of experience and has previously served as CFO of other clinical diagnostic companies, including CareDx, Metabiota, Singulex, and Novartis Diagnostics. Bell also worked in public accounting and consulting at Deloitte and Ernst & Young. He holds a Bachelor of Science degree in Mathematics with Computing from the University of Leicester and is a Fellow of the Institute of Chartered Accountants in England and Wales.
Darya Chudova Chief Technology Officer
Darya Chudova is the Chief Technology Officer at Guardant Health, where she oversees the company's technology strategy and development. She previously served as Senior Vice President, leading the technical development of Guardant's Shield™ screening product and the Guardant360 LDT and CDx therapy selection portfolio. Before joining Guardant Health, Chudova developed tools for clinical diagnostics and genomic expression data interpretation at Veracyte, Inc., and non-invasive prenatal testing at Illumina, Inc.
Kumud Kalia Chief Information Officer
Kumud Kalia is the Chief Information Officer at Guardant Health, responsible for the company's enterprise applications, information technology, data engineering, and security teams. Prior to Guardant Health, Kalia held CIO and CTO roles at Cylance, Akamai, and Direct Energy, and leadership positions at UBS and Morgan Stanley. He holds degrees in Electronic Engineering from Bangor University and Cybersecurity from UC Berkeley, and is a Fellow of both the Institution of Engineering and Technology and the British Computer Society.
AI Analysis | Feedback
The key risks to Guardant Health (GH) include:
- Ongoing Unprofitability and Significant Cash Burn: Guardant Health continues to incur substantial net losses and negative cash flow, necessitating continuous investment in research, development, and commercialization efforts. This financial weakness could limit the company's ability to expand capacity and commercialize new products, potentially requiring additional external financing through debt or equity dilution in the future. As of December 31, 2025, the company had an accumulated deficit of $3.0 billion.
- Reimbursement and Regulatory Challenges: The company's financial performance is heavily reliant on favorable reimbursement policies from third-party payers, including Medicare and private insurers, for its liquid biopsy tests such as SHIELD and Guardant Reveal. Changes in coverage, reimbursement rates, or evolving regulatory oversight from the FDA for lab-developed tests (LDTs) and screening guidelines could significantly impede the adoption and commercial success of Guardant Health's products. For instance, the clinical trial data for the SHIELD test, particularly its sensitivity compared to competitors, has raised questions about its commercial prospects and ability to secure optimal reimbursement terms.
- Intense Competition and Market Share Pressure: Guardant Health operates in a highly competitive landscape within the precision oncology and liquid biopsy markets. Established diagnostics companies and emerging rivals, including Exact Sciences, Natera, Foundation Medicine (owned by Roche), Thermo Fisher Scientific, Illumina (GRAIL), and Freenome, pose a significant threat. Competitors may develop more effective or cost-efficient diagnostic alternatives, potentially leading to reduced market share, pricing pressures, and a slower uptake of Guardant Health's offerings.
AI Analysis | Feedback
The following are clear emerging threats for Guardant Health:
- Multi-Cancer Early Detection (MCED) Tests from Competitors: The commercialization and increasing adoption of multi-cancer early detection tests, such as GRAIL's Galleri (developed by Illumina), pose a significant threat. While Guardant Health is developing its LUNAR-2 test for early colorectal cancer detection, Galleri targets the broader and potentially massive multi-cancer screening market. If competitors establish a dominant market position and widespread clinical integration in MCED, it could significantly limit Guardant Health's future growth and market share in this highly disruptive and rapidly emerging diagnostic category.
- Advanced Minimal Residual Disease (MRD) Tests from Competitors: The strong market penetration and clinical adoption of highly sensitive and validated minimal residual disease (MRD) tests from competitors, such as Natera's Signatera, represent a clear emerging threat. Guardant Health offers its Guardant Reveal test for MRD monitoring. However, Signatera's tumor-informed personalized approach, robust clinical evidence across multiple cancer types, and established reimbursement pathways have positioned it as a leading contender in this crucial and rapidly expanding segment of cancer diagnostics, potentially challenging Guardant Health's ability to gain significant market share.
AI Analysis | Feedback
Guardant Health (symbol: GH) operates in several significant addressable markets for its main products and services:
- Guardant360 (Therapy Selection for Advanced Cancer): The therapy selection market, where Guardant360 is a primary offering, is estimated to be around $10 billion, primarily focused on the U.S. market.
- Guardant Reveal (Minimal Residual Disease - MRD): The addressable market for Minimal Residual Disease (MRD) detection, which Guardant Reveal targets, is approximately $20 billion. Guardant Reveal also targets a global solid tumor cancer treatment market size of $5.64 billion in 2025.
- Guardant Shield (Colorectal Cancer Screening): The total U.S. addressable market for average-risk individuals eligible for colorectal cancer screening is estimated at a potential value of $50 billion.
- Shield Multi-Cancer Detection (MCD): This pipeline product, aimed at early detection of multiple cancers, has a projected global total addressable market of approximately $2.86 billion by 2030.
AI Analysis | Feedback
Here are 3-5 expected drivers of future revenue growth for Guardant Health (GH) over the next 2-3 years:
- Accelerated Adoption and Expansion of Shield™ for Colorectal Cancer Screening: Guardant Health's blood-based colorectal cancer screening test, Shield, is consistently highlighted as a significant multi-year revenue growth driver. The company saw substantial revenue and volume growth from Shield in Q4 2025, with 2026 guidance projecting a meaningful increase in screening revenue and tests. Key factors include achieving ADLT (Advanced Diagnostic Laboratory Test) status with a favorable reimbursement rate of $1,495, gaining a first-mover advantage, and strong provider adoption. Strategic partnerships, such as with Quest Diagnostics, and direct-to-consumer marketing efforts are further expanding its market reach.
- Continued Growth of the Core Oncology Business: The company's established oncology portfolio, including Guardant360 (Liquid and Tissue), Guardant Reveal, and GuardantOMNI, remains a strong revenue engine. Management expects oncology revenue to grow by 25% to 27% in 2026, with anticipated volume growth of approximately 30%. This growth is driven by expanding clinical utility through new "Smart Liquid Biopsy" applications for Guardant360, leading to increased adoption and test volumes.
- Expansion of Biopharma and Data Partnerships: The biopharma and data segment is expected to contribute consistently to revenue growth, with projections in the low double-digit range for 2026. This growth is fueled by ongoing collaborations with pharmaceutical companies, new program starts, and Guardant Health's leadership in companion diagnostics (CDx), boasting 25 approvals to date across various regions and a robust pipeline of new CDx programs.
- Strategic Market Expansion and Increased Access: Guardant Health is actively pursuing initiatives to broaden access to its tests. Partnerships, such as the collaboration with Quest Diagnostics for Shield, aim to integrate the test into numerous physicians' electronic medical record (EMR) systems, thereby significantly enhancing market penetration. Additionally, the company is undertaking international expansion for Shield, supported by acquisitions like MetaSight.
- Potential for New Product Indications and Enhanced Reimbursement: Beyond the ongoing Shield rollout, Guardant Health is working on securing additional reimbursement coverage for Guardant Reveal in various cancer types through MolDX. There is also an anticipation of FDA approval for Guardant360 in new indications in the latter half of 2026, which could further boost its market potential and revenue.
AI Analysis | Feedback
[1] Share Repurchases
- Guardant Health intended to repurchase approximately $45 million of its common stock in connection with privately negotiated exchange agreements in February 2025.
[2] Share Issuance
- In November 2025, Guardant Health priced an upsized underwritten public offering of 3,333,333 shares of its common stock at $90.00 per share, with an option for underwriters to purchase additional shares.
- Concurrently in November 2025, the company also priced an offering of $350.0 million aggregate principal amount of convertible senior notes due 2033, an amount that was upsized from a previously announced $300.0 million. In total, $402.5 million principal amount of 0% convertible senior notes due 2033 were issued in November 2025.
- In February 2026, Guardant Health filed a shelf registration for $510.17 million for 4,795,700 common shares tied to employee stock plans.
[4] Outbound Investments
- In December 2025, Guardant Health acquired MetaSight Diagnostics Ltd. for $149 million, comprising $59 million in upfront cash and up to $90 million in potential milestone payments.
- In June 2022, Guardant Health acquired Guardant Health AMEA for $178 million.
Peer Outperformance in Life Sciences Tools & Services
| Industry | Names | 1Y med | 3Y med | 5Y med | Top 3 by 5Y |
|---|---|---|---|---|---|
| Health Care Distributors | 7 | 7.8% | 77.2% | 101.1% | CAH 380% · MCK 334% · COR 164% |
| Managed Health Care | 8 | 40.9% | -1.4% | 1.5% | OSCR 83% · HQY 48% · ELV 17% |
| Health Care Services | 20 | 25.4% | 42.2% | -1.8% | HIMS 219% · RDNT 172% · DGX 76% |
| Health Care Facilities | 24 | 5.6% | 0.8% | -12.7% | NHC 274% · THC 259% · ENSG 127% |
| Health Care Equipment | 50 | -0.8% | -4.9% | -21.9% | POCI 10800% · UFPT 334% · GKOS 199% |
| Pharmaceuticals | 62 | -5.1% | 12.4% | -39.8% | LQDA 2442% · INDV 1175% · ETON 1012% |
| Health Care Supplies | 12 | 17.1% | -12.2% | -40.3% | LNTH 294% · HAE 53% · MMSI 19% |
| Life Sciences Tools & Services ← | 109 | 5.4% | -22.1% | -68.8% | SNWV 1586% · MEDP 231% · NTRA 190% |
| Health Care Technology | 21 | -25.5% | -51.1% | -79.7% | SPOK 72% · HSTM 1% · VEEV -13% |
| Biotechnology | 364 | 0.4% | -26.6% | -79.8% | DNTH 1198% · CELZ 1154% · ELVN 1077% |
Latest Trefis Analyses
Research & Analysis
Invest in Strategies
Wealth Management
Peer Comparisons
| Peers to compare with: |
Financials
| Median | |
|---|---|
| Name | |
| Mkt Price | 214.14 |
| Mkt Cap | 30.7 |
| Rev LTM | 2,070 |
| Op Inc LTM | -65 |
| FCF LTM | 88 |
| FCF 3Y Avg | 13 |
| CFO LTM | 198 |
| CFO 3Y Avg | 120 |
Growth & Margins
| Median | |
|---|---|
| Name | |
| Rev Chg LTM | 40.3% |
| Rev Chg 3Y Avg | 32.6% |
| Rev Chg Q | 29.6% |
| QoQ Delta Rev Chg LTM | 6.6% |
| Op Inc Chg LTM | 4.6% |
| Op Inc Chg 3Y Avg | 6.1% |
| Op Mgn LTM | 2.4% |
| Op Mgn 3Y Avg | -16.2% |
| QoQ Delta Op Mgn LTM | 1.0% |
| CFO/Rev LTM | 12.7% |
| CFO/Rev 3Y Avg | 4.6% |
| FCF/Rev LTM | 7.2% |
| FCF/Rev 3Y Avg | -0.5% |
Valuation
| Median | |
|---|---|
| Name | |
| Mkt Cap | 30.7 |
| P/S | 10.1 |
| P/Op Inc | -51.1 |
| P/EBIT | -54.1 |
| P/E | -53.7 |
| P/CFO | 27.1 |
| Total Yield | 0.9% |
| Dividend Yield | 0.0% |
| FCF Yield 3Y Avg | -0.1% |
| D/E | 0.1 |
| Net D/E | 0.0 |
Returns
| Median | |
|---|---|
| Name | |
| 1M Rtn | 23.9% |
| 3M Rtn | 54.7% |
| 6M Rtn | 72.8% |
| 12M Rtn | 74.3% |
| 3Y Rtn | 88.4% |
| 1M Excs Rtn | 24.6% |
| 3M Excs Rtn | 55.0% |
| 6M Excs Rtn | 61.0% |
| 12M Excs Rtn | 57.8% |
| 3Y Excs Rtn | 12.5% |
Comparison Analyses
Price Behavior
| Market Price | $183.10 | |
| Market Cap ($ Bil) | 24.3 | |
| First Trading Date | 10/04/2018 | |
| Distance from 52W High | 0.0% | |
| 50 Days | 200 Days | |
| DMA Price | $160.76 | $119.22 |
| DMA Trend | up | up |
| Distance from DMA | 13.9% | 53.6% |
| 3M | 1YR | |
| Volatility | 55.0% | 58.6% |
| Downside Capture | -11.91 | 40.41 |
| Upside Capture | 164.30 | 169.03 |
| Correlation (SPY) | 11.9% | 20.8% |
| 1M | 2M | 3M | 6M | 1Y | 3Y | |
|---|---|---|---|---|---|---|
| Beta | 0.17 | 1.42 | 0.88 | 1.28 | 0.97 | 1.29 |
| Up Beta | -1.79 | 1.15 | 0.26 | 1.17 | 1.20 | 1.02 |
| Down Beta | -5.21 | -2.26 | 0.63 | 1.10 | 0.51 | 1.32 |
| Up Capture | 139% | 204% | 179% | 220% | 194% | 522% |
| Bmk +ve Days | 10 | 21 | 32 | 68 | 138 | 427 |
| Stock +ve Days | 10 | 19 | 33 | 68 | 135 | 375 |
| Down Capture | 276% | 285% | 77% | 92% | 72% | 107% |
| Bmk -ve Days | 11 | 21 | 32 | 59 | 113 | 324 |
| Stock -ve Days | 11 | 23 | 31 | 58 | 115 | 370 |
[1] Upside and downside betas calculated using positive and negative benchmark daily returns respectively
Based On 1-Year Data
| Annualized Return | Annualized Volatility | Sharpe Ratio | Correlation with GH | |
|---|---|---|---|---|
| GH | 232.1% | 58.6% | 2.25 | - |
| Sector ETF (XLV) | 25.0% | 16.1% | 1.19 | 17.9% |
| Equity (SPY) | 16.6% | 12.9% | 0.92 | 21.0% |
| Gold (GLD) | 17.4% | 29.3% | 0.55 | 17.0% |
| Commodities (DBC) | 45.8% | 20.7% | 1.72 | -9.8% |
| Real Estate (VNQ) | 5.7% | 13.5% | 0.16 | 16.0% |
| Bitcoin (BTCUSD) | -34.9% | 43.9% | -0.85 | 12.7% |
Smart multi-asset allocation framework can stack odds in your favor. Learn How
Based On 5-Year Data
| Annualized Return | Annualized Volatility | Sharpe Ratio | Correlation with GH | |
|---|---|---|---|---|
| GH | 4.6% | 67.8% | 0.35 | - |
| Sector ETF (XLV) | 6.3% | 15.2% | 0.23 | 30.9% |
| Equity (SPY) | 12.6% | 17.2% | 0.56 | 41.1% |
| Gold (GLD) | 18.9% | 18.8% | 0.81 | 8.8% |
| Commodities (DBC) | 11.7% | 19.6% | 0.47 | 5.9% |
| Real Estate (VNQ) | 1.0% | 18.8% | -0.05 | 37.7% |
| Bitcoin (BTCUSD) | 10.4% | 52.5% | 0.38 | 24.1% |
Smart multi-asset allocation framework can stack odds in your favor. Learn How
Based On 10-Year Data
| Annualized Return | Annualized Volatility | Sharpe Ratio | Correlation with GH | |
|---|---|---|---|---|
| GH | 17.7% | 67.6% | 0.59 | - |
| Sector ETF (XLV) | 10.6% | 16.7% | 0.51 | 32.8% |
| Equity (SPY) | 15.1% | 18.0% | 0.71 | 38.8% |
| Gold (GLD) | 12.0% | 16.4% | 0.60 | 6.8% |
| Commodities (DBC) | 8.5% | 18.1% | 0.39 | 9.2% |
| Real Estate (VNQ) | 4.4% | 20.7% | 0.17 | 32.4% |
| Bitcoin (BTCUSD) | 62.0% | 66.1% | 1.02 | 14.8% |
Smart multi-asset allocation framework can stack odds in your favor. Learn How
Returns Analyses
Earnings Returns History
Updated 9/2/2026| Forward Returns | |||
|---|---|---|---|
| Earnings Date | 1D Returns | 5D Returns | 21D Returns |
| 7/30/2026 | 6.3% | 3.4% | 6.0% |
| 5/7/2026 | 3.7% | 6.9% | 35.4% |
| 2/19/2026 | -3.1% | -7.9% | -19.9% |
| 10/29/2025 | 27.9% | 31.5% | 45.6% |
| 7/30/2025 | -9.3% | -1.3% | 42.7% |
| 4/30/2025 | 3.5% | -15.9% | -14.0% |
| 2/20/2025 | -9.6% | -11.2% | -2.7% |
| 11/6/2024 | 13.0% | 25.0% | 45.8% |
| ... | |||
| SUMMARY STATS | |||
| # Positive | 13 | 11 | 11 |
| # Negative | 11 | 13 | 13 |
| Median Positive | 6.4% | 10.2% | 35.4% |
| Median Negative | -7.9% | -11.4% | -14.0% |
| Max Positive | 27.9% | 35.0% | 54.6% |
| Max Negative | -22.5% | -39.2% | -30.1% |
| Forward Returns | |||
|---|---|---|---|
| Earnings Date | 1D Returns | 5D Returns | 21D Returns |
| 7/30/2026 | 6.3% | 3.4% | 6.0% |
| 5/7/2026 | 3.7% | 6.9% | 35.4% |
| 2/19/2026 | -3.1% | -7.9% | -19.9% |
| 10/29/2025 | 27.9% | 31.5% | 45.6% |
| 7/30/2025 | -9.3% | -1.3% | 42.7% |
| 4/30/2025 | 3.5% | -15.9% | -14.0% |
| 2/20/2025 | -9.6% | -11.2% | -2.7% |
| 11/6/2024 | 13.0% | 25.0% | 45.8% |
| 8/7/2024 | -10.9% | -14.5% | -30.1% |
| 5/9/2024 | 15.1% | 35.0% | 54.6% |
| 2/22/2024 | -12.8% | -14.7% | -22.5% |
| 11/6/2023 | -5.4% | -18.4% | -7.2% |
| 8/3/2023 | 6.4% | 1.5% | -1.5% |
| 5/9/2023 | 14.9% | 13.6% | 35.8% |
| 2/23/2023 | 11.7% | 21.8% | -6.5% |
| 11/3/2022 | 4.9% | 9.3% | 15.3% |
| 8/4/2022 | 3.6% | 4.0% | 4.0% |
| 5/5/2022 | -22.5% | -39.2% | -23.1% |
| 2/23/2022 | 10.0% | 10.2% | -0.1% |
| 11/4/2021 | -4.0% | -8.3% | -22.7% |
| 8/5/2021 | -1.2% | -8.2% | 14.2% |
| 5/6/2021 | 0.6% | -18.5% | -13.4% |
| 2/24/2021 | -7.9% | -11.4% | -17.1% |
| 11/5/2020 | -3.8% | -1.2% | 5.7% |
| SUMMARY STATS | |||
| # Positive | 13 | 11 | 11 |
| # Negative | 11 | 13 | 13 |
| Median Positive | 6.4% | 10.2% | 35.4% |
| Median Negative | -7.9% | -11.4% | -14.0% |
| Max Positive | 27.9% | 35.0% | 54.6% |
| Max Negative | -22.5% | -39.2% | -30.1% |
SEC Filings
Expand for More| Report Date | Filing Date | Filing |
|---|---|---|
| 06/30/2026 | 07/30/2026 | 10-Q |
| 03/31/2026 | 05/07/2026 | 10-Q |
| 12/31/2025 | 02/19/2026 | 10-K |
| 09/30/2025 | 10/29/2025 | 10-Q |
| 06/30/2025 | 07/30/2025 | 10-Q |
| 03/31/2025 | 04/30/2025 | 10-Q |
| 12/31/2024 | 02/20/2025 | 10-K |
| 09/30/2024 | 11/06/2024 | 10-Q |
| 06/30/2024 | 08/07/2024 | 10-Q |
| 03/31/2024 | 05/09/2024 | 10-Q |
| 12/31/2023 | 02/22/2024 | 10-K |
| 09/30/2023 | 11/06/2023 | 10-Q |
| 06/30/2023 | 08/03/2023 | 10-Q |
| 03/31/2023 | 05/09/2023 | 10-Q |
| 12/31/2022 | 02/23/2023 | 10-K |
| 09/30/2022 | 11/03/2022 | 10-Q |
| Report Date | Filing Date | Filing |
|---|---|---|
| 06/30/2026 | 07/30/2026 | 10-Q |
| 03/31/2026 | 05/07/2026 | 10-Q |
| 12/31/2025 | 02/19/2026 | 10-K |
| 09/30/2025 | 10/29/2025 | 10-Q |
| 06/30/2025 | 07/30/2025 | 10-Q |
| 03/31/2025 | 04/30/2025 | 10-Q |
| 12/31/2024 | 02/20/2025 | 10-K |
| 09/30/2024 | 11/06/2024 | 10-Q |
| 06/30/2024 | 08/07/2024 | 10-Q |
| 03/31/2024 | 05/09/2024 | 10-Q |
| 12/31/2023 | 02/22/2024 | 10-K |
| 09/30/2023 | 11/06/2023 | 10-Q |
| 06/30/2023 | 08/03/2023 | 10-Q |
| 03/31/2023 | 05/09/2023 | 10-Q |
| 12/31/2022 | 02/23/2023 | 10-K |
| 09/30/2022 | 11/03/2022 | 10-Q |
| 06/30/2022 | 08/04/2022 | 10-Q |
| 03/31/2022 | 05/05/2022 | 10-Q |
| 12/31/2021 | 02/24/2022 | 10-K |
| 09/30/2021 | 11/04/2021 | 10-Q |
| 06/30/2021 | 08/05/2021 | 10-Q |
| 03/31/2021 | 05/06/2021 | 10-Q |
| 12/31/2020 | 02/25/2021 | 10-K |
| 09/30/2020 | 11/05/2020 | 10-Q |
| 06/30/2020 | 08/06/2020 | 10-Q |
| 03/31/2020 | 05/07/2020 | 10-Q |
| 12/31/2019 | 03/02/2020 | 10-K |
| 09/30/2019 | 11/07/2019 | 10-Q |
Recent Forward Guidance
Updated 7/31/2026Latest: Q2 2026 Earnings Reported 7/30/2026
| Forward Guidance | Guidance Change | |||||||
|---|---|---|---|---|---|---|---|---|
| Metric | Source | Low | Mid | High | % Chg | % Delta | Change | Prior |
| 2026 Oncology Volume Growth | Reported | 50.0% | 15.0% | Raised | Guidance: 35.0% for 2026 | |||
| 2026 Shield Volume | Reported | 0.27 Mil | 0.28 Mil | 0.28 Mil | 16.8% | Raised | Guidance: 0.24 Mil for 2026 | |
| 2026 Revenue | Reported | 1.34 Bil | 1.35 Bil | 1.36 Bil | 3.1% | Raised | Guidance: 1.31 Bil for 2026 | |
| 2026 Oncology Revenue Growth | Reported | 30.0% | 1.5% | Raised | Guidance: 28.5% for 2026 | |||
| 2026 Screening Revenue | Reported | 218.00 Mil | 224.00 Mil | 230.00 Mil | 16.7% | Raised | Guidance: 192.00 Mil for 2026 | |
| 2026 Gross Profit | Calculated | 857.60 Mil | 870.75 Mil | 884.00 Mil | Rev x Gross Margin | |||
| 2026 Non-GAAP Gross Margin | Reported | 64.0% | 64.5% | 65.0% | 0.0% | Affirmed | Guidance: 64.5% for 2026 | |
| 2026 Non-GAAP Operating Expenses | Reported | 1.08 Bil | 1.09 Bil | 1.10 Bil | 2.8% | Raised | Guidance: 1.06 Bil for 2026 | |
| 2026 Free Cash Flow Burn | Reported | -205.00 Mil | -200.00 Mil | -195.00 Mil | 5.3% | Lowered | Guidance: -190.00 Mil for 2026 | |
Prior: Q1 2026 Earnings Reported 5/7/2026
| Forward Guidance | Guidance Change | |||||||
|---|---|---|---|---|---|---|---|---|
| Metric | Source | Low | Mid | High | % Chg | % Delta | Change | Prior |
| 2026 Oncology Volume Growth | Reported | 35.0% | ||||||
| 2026 Shield Volume | Reported | 0.23 Mil | 0.24 Mil | 0.24 Mil | ||||
| 2026 Revenue | Reported | 1.30 Bil | 1.31 Bil | 1.32 Bil | 3.6% | Raised | Guidance: 1.26 Bil for 2026 | |
| 2026 Revenue Growth | Reported | 32.0% | 33.0% | 34.0% | 4.5% | Raised | Guidance: 28.5% for 2026 | |
| 2026 Oncology Revenue Growth | Reported | 28.0% | 28.5% | 29.0% | 2.5% | Raised | Guidance: 26.0% for 2026 | |
| 2026 Screening Revenue | Reported | 186.00 Mil | 192.00 Mil | 198.00 Mil | 14.3% | Raised | Guidance: 168.00 Mil for 2026 | |
| 2026 Non-GAAP Gross Margin | Reported | 64.0% | 64.5% | 65.0% | 0.0% | Affirmed | Guidance: 64.5% for 2026 | |
| 2026 Non-GAAP Operating Expenses | Reported | 1.05 Bil | 1.06 Bil | 1.07 Bil | 1.9% | Lowered | Guidance: 1.04 Bil for 2026 | |
| 2026 Free Cash Flow Burn | Reported | -185.00 Mil | -190.00 Mil | -195.00 Mil | Affirmed | Guidance: -190.00 Mil for 2026 | ||
Q4 2025 Earnings Reported 2/19/2026
| Forward Guidance | Guidance Change | |||||||
|---|---|---|---|---|---|---|---|---|
| Metric | Source | Low | Mid | High | % Chg | % Delta | Change | Prior |
| 2026 Revenue | Reported | 1.25 Bil | 1.26 Bil | 1.28 Bil | 30.7% | Higher New | Actual: 967.50 Mil for 2025 | |
| 2026 Revenue Growth | Reported | 27.0% | 28.5% | 30.0% | ||||
| 2026 Oncology Revenue Growth | Reported | 25.0% | 26.0% | 27.0% | 1.0% | Higher New | Actual: 25.0% for 2025 | |
| 2026 Screening Revenue | Reported | 162.00 Mil | 168.00 Mil | 174.00 Mil | 133.3% | Higher New | Actual: 72.00 Mil for 2025 | |
| 2026 Non-GAAP Gross Margin | Reported | 64.0% | 64.5% | 65.0% | 0.0% | Same New | Actual: 64.5% for 2025 | |
| 2026 Non-GAAP Operating Expenses | Reported | 1.03 Bil | 1.04 Bil | 1.05 Bil | 19.5% | Higher New | Actual: 870.00 Mil for 2025 | |
| 2026 Free Cash Flow Burn | Reported | -195.00 Mil | -190.00 Mil | -185.00 Mil | -17.4% | Higher New | Actual: -230.00 Mil for 2025 | |
Q3 2025 Earnings Reported 10/29/2025
| Forward Guidance | Guidance Change | |||||||
|---|---|---|---|---|---|---|---|---|
| Metric | Source | Low | Mid | High | % Chg | % Delta | Change | Prior |
| 2025 Oncology Volume Growth | Reported | 30.0% | 3.0% | Raised | Guidance: 27.0% for 2025 | |||
| 2025 Shield Volume | Reported | 80,000 | 81,000 | 82,000 | 14.9% | Raised | Guidance: 70,500 for 2025 | |
| 2025 Revenue | Reported | 965.00 Mil | 967.50 Mil | 970.00 Mil | 5.2% | Raised | Guidance: 920.00 Mil for 2025 | |
| 2025 Oncology Revenue Growth | Reported | 25.0% | 5.0% | Raised | Guidance: 20.0% for 2025 | |||
| 2025 Screening Revenue | Reported | 71.00 Mil | 72.00 Mil | 73.00 Mil | 25.2% | Raised | Guidance: 57.50 Mil for 2025 | |
| 2025 Non-GAAP Gross Margin | Reported | 64.0% | 64.5% | 65.0% | 1.0% | Raised | Guidance: 63.5% for 2025 | |
| 2025 Non-GAAP Operating Expenses | Reported | 865.00 Mil | 870.00 Mil | 875.00 Mil | 3.0% | Raised | Guidance: 845.00 Mil for 2025 | |
| 2025 Free Cash Flow Burn | Reported | -235.00 Mil | -230.00 Mil | -225.00 Mil | 0 | Affirmed | Guidance: -230.00 Mil for 2025 | |
Insider Activity
Updated 9/17/2026| # | Owner | Title | Holding | Action | Filing Date | Price | Shares | Transacted Value | Value of Held Shares | Form |
|---|---|---|---|---|---|---|---|---|---|---|
| 1 | Krognes, Steve E | Direct | Sell | 9172026 | 175.74 | 6,674 | 1,172,886 | 1,389,397 | Form | |
| 2 | Azar, Alex M II | Direct | Sell | 9172026 | 175.00 | 826 | 144,550 | 144,375 | Form | |
| 3 | Tariq, Musa | Direct | Sell | 9172026 | 175.00 | 116 | 20,300 | 2,003,575 | Form | |
| 4 | Chudova, Darya | Chief Technology Officer | Direct | Sell | 9162026 | 178.00 | 7,738 | 1,377,364 | 12,573,030 | Form |
| 5 | Kalia, Kumud | Chief Information Officer | Direct | Sell | 9142026 | 158.05 | 4,000 | 632,193 | 6,289,374 | Form |
| # | Owner | Title | Holding | Action | Filing Date | Price | Shares | Transacted Value | Value of Held Shares | Form |
|---|---|---|---|---|---|---|---|---|---|---|
| 1 | Krognes, Steve E | Direct | Sell | 9172026 | 175.74 | 6,674 | 1,172,886 | 1,389,397 | Form | |
| 2 | Azar, Alex M II | Direct | Sell | 9172026 | 175.00 | 826 | 144,550 | 144,375 | Form | |
| 3 | Tariq, Musa | Direct | Sell | 9172026 | 175.00 | 116 | 20,300 | 2,003,575 | Form | |
| 4 | Chudova, Darya | Chief Technology Officer | Direct | Sell | 9162026 | 178.00 | 7,738 | 1,377,364 | 12,573,030 | Form |
| 5 | Kalia, Kumud | Chief Information Officer | Direct | Sell | 9142026 | 158.05 | 4,000 | 632,193 | 6,289,374 | Form |
| 6 | Talasaz, Amirali | Co-Chief Executive Officer | Shares held by the Talasaz Family Foundation | Sell | 8242026 | 169.16 | 37,500 | 6,343,384 | 6,343,384 | Form |
| 7 | Tariq, Musa | Direct | Sell | 8182026 | 156.45 | 116 | 18,148 | 1,770,388 | Form | |
| 8 | Monroe, Terilyn J | Chief People Officer | Direct | Sell | 8132026 | 165.12 | 46,300 | 7,645,218 | 3,794,373 | Form |
| 9 | Freeman, Chris | Chief Commercial Officer | Direct | Sell | 8112026 | 169.58 | 63,605 | 10,786,111 | 11,086,097 | Form |
| 10 | Clark, Ian T | The Thornton-Clark Family Trust, J Thornton-Clark & I Clark TTE Account | Sell | 8052026 | 158.92 | 14,180 | 2,253,451 | 472,780 | Form | |
| 11 | Tariq, Musa | Direct | Sell | 7162026 | 163.29 | 116 | 18,942 | 1,825,909 | Form | |
| 12 | Talasaz, Amirali | Co-Chief Executive Officer | Shares held by Talasaz and Eskandari 2017 Family Trust | Sell | 6302026 | 151.54 | 143,028 | 21,674,187 | 285,094,032 | Form |
| 13 | Talasaz, Amirali | Co-Chief Executive Officer | Shares held by Talasaz and Eskandari 2017 Family Trust | Sell | 6302026 | 150.79 | 116,972 | 17,638,467 | 283,690,817 | Form |
| 14 | Kalia, Kumud | Chief Information Officer | Direct | Buy | 6302026 | 130.76 | 600 | 78,456 | 5,415,295 | Form |
| 15 | Kalia, Kumud | Chief Information Officer | Direct | Sell | 6302026 | 131.08 | 600 | 78,648 | 5,349,899 | Form |
| 16 | Kalia, Kumud | Chief Information Officer | Direct | Sell | 6302026 | 130.86 | 600 | 78,516 | 5,340,920 | Form |
| 17 | Tariq, Musa | Direct | Sell | 6232026 | 131.16 | 1,951 | 255,893 | 1,449,056 | Form | |
| 18 | Potter, Myrtle S | Direct | Sell | 6232026 | 131.16 | 1,556 | 204,085 | 2,750,556 | Form | |
| 19 | Tariq, Musa | Direct | Sell | 6162026 | 130.19 | 116 | 15,102 | 1,145,151 | Form | |
| 20 | Kalia, Kumud | Chief Information Officer | Direct | Sell | 6152026 | 130.24 | 3,418 | 445,156 | 5,351,504 | Form |
| 21 | Kalia, Kumud | Chief Information Officer | Direct | Sell | 6122026 | 130.41 | 5,000 | 652,030 | 5,804,110 | Form |
| 22 | Eltoukhy, Helmy | Co-Chief Executive Officer | Shares held by Helmy A. Eltoukhy Revocable Trust | Sell | 6082026 | 126.30 | 100,000 | 12,629,969 | 254,231,037 | Form |
| 23 | Bell, Michael Brian | Chief Financial Officer | Direct | Sell | 6082026 | 128.62 | 2,000 | 257,241 | 6,110,622 | Form |
| 24 | Krognes, Steve E | Direct | Sell | 6052026 | 132.51 | 9,294 | 1,231,522 | 1,354,489 | Form | |
| 25 | Joyce, Meghan V | Direct | Sell | 6042026 | 126.98 | 10,000 | 1,269,809 | 1,420,027 | Form | |
| 26 | Hidalgo, Medina Manuel | Direct | Sell | 5292026 | 130.06 | 1,000 | 130,060 | 83,108 | Form | |
| 27 | Saia, John G | Chief Legal Officer | Direct | Sell | 5282026 | 125.08 | 10,000 | 1,250,836 | 4,496,755 | Form |
| 28 | Freeman, Chris | Chief Commercial Officer | Direct | Sell | 5262026 | 118.67 | 24,406 | 2,896,360 | 7,124,481 | Form |
| 29 | Saia, John G | Chief Legal Officer | Direct | Sell | 5222026 | 106.51 | 20,000 | 2,130,229 | 4,894,201 | Form |
| 30 | Talasaz, Amirali | Co-Chief Executive Officer | Shares held by Talasaz and Eskandari 2017 Family Trust | Sell | 5222026 | 109.89 | 210,000 | 23,076,690 | 207,306,039 | Form |
| 31 | Clark, Ian T | The Thornton-Clark Family Trust, J Thornton-Clark & I Clark TTE Account | Sell | 5222026 | 106.90 | 6,876 | 735,049 | 318,029 | Form | |
| 32 | Hidalgo, Medina Manuel | Direct | Sell | 5222026 | 107.09 | 1,250 | 133,864 | 175,522 | Form | |
| 33 | Tariq, Musa | Direct | Sell | 5192026 | 95.96 | 116 | 11,131 | 831,206 | Form | |
| 34 | Talasaz, Amirali | Co-Chief Executive Officer | Shares held by Talasaz and Eskandari 2017 Family Trust | Sell | 5132026 | 100.32 | 50,000 | 5,016,000 | 210,321,281 | Form |
| 35 | Tariq, Musa | Direct | Sell | 4162026 | 84.83 | 116 | 9,840 | 723,430 | Form | |
| 36 | Monroe, Terilyn J | Chief People Officer | Direct | Sell | 4072026 | 92.68 | 3,832 | 355,150 | 1,945,353 | Form |
| 37 | Bell, Michael Brian | Chief Financial Officer | Direct | Sell | 3172026 | 87.04 | 3,000 | 261,111 | 3,794,900 | Form |
| 38 | Hidalgo, Medina Manuel | Direct | Sell | 3092026 | 91.54 | 1,300 | 118,997 | 109,202 | Form | |
| 39 | Kalia, Kumud | Chief Information Officer | Direct | Sell | 3052026 | 95.32 | 40,000 | 3,812,661 | 3,588,000 | Form |
| 40 | Monroe, Terilyn J | Chief People Officer | Direct | Sell | 1222026 | 114.09 | 8,571 | 977,902 | 2,394,838 | Form |
| 41 | Monroe, Terilyn J | Chief People Officer | Direct | Sell | 1092026 | 112.08 | 10,031 | 1,124,279 | 2,352,570 | Form |
| 42 | Tariq, Musa | Direct | Sell | 12182025 | 101.46 | 116 | 11,769 | 810,970 | Form | |
| 43 | Eltoukhy, Helmy | Co-Chief Executive Officer | Direct | Sell | 12172025 | 103.82 | 90,565 | 9,402,220 | 212,529,000 | Form |
| 44 | Chudova, Darya | Chief Technology Officer | Direct | Sell | 12172025 | 104.04 | 5,451 | 567,132 | 729,541 | Form |
| 45 | Talasaz, Amirali | Co-Chief Executive Officer | Shares held by AmirAli Talasaz 2018 Children's Remainder Trust, Dated 9/25/2018 | Sell | 12102025 | 105.05 | 50,000 | 5,252,737 | 17,672,623 | Form |
| 46 | Talasaz, Amirali | Co-Chief Executive Officer | Shares held by Maryam Eskandari 2018 Children's Remainder Trust, Dated 9/25/2018 | Sell | 12102025 | 105.05 | 50,000 | 5,252,737 | 17,672,623 | Form |
| 47 | Kalia, Kumud | Chief Information Officer | Direct | Sell | 12102025 | 104.60 | 2,000 | 209,204 | 2,339,426 | Form |
| 48 | Hidalgo, Medina Manuel | Direct | Sell | 12102025 | 105.00 | 1,250 | 131,250 | 83,685 | Form | |
| 49 | Chudova, Darya | Chief Technology Officer | Direct | Sell | 12102025 | 106.00 | 9,271 | 982,753 | 1,321,114 | Form |
| 50 | Chudova, Darya | Chief Technology Officer | Chudova Family Trust | Sell | 12102025 | 105.04 | 13,664 | 1,435,227 | 5,722,421 | Form |
| 51 | Freeman, Chris | Chief Commercial Officer | Direct | Sell | 12082025 | 103.07 | 31,452 | 3,241,621 | 2,678,367 | Form |
| 52 | Bell, Michael Brian | Chief Financial Officer | Direct | Sell | 12082025 | 103.14 | 80,362 | 8,288,742 | 2,893,355 | Form |
| 53 | Clark, Ian T | The Thornton-Clark Family Trust, J Thornton-Clark & I Clark TTE Account | Sell | 12082025 | 107.19 | 28,611 | 3,066,817 | 1,055,930 | Form | |
| 54 | Monroe, Terilyn J | Chief People Officer | Direct | Sell | 12022025 | 105.97 | 55,167 | 5,846,163 | 2,216,937 | Form |
| 55 | Tariq, Musa | Direct | Sell | 11202025 | 96.25 | 116 | 11,165 | 756,429 | Form | |
| 56 | Hidalgo, Medina Manuel | Direct | Sell | 11102025 | 95.19 | 1,500 | 142,780 | 77,577 | Form | |
| 57 | Saia, John G | Chief Legal Officer | Direct | Sell | 11102025 | 96.25 | 8,996 | 865,865 | 4,155,305 | Form |
| 58 | Tariq, Musa | Direct | Sell | 10202025 | 66.95 | 116 | 7,766 | 517,189 | Form | |
| 59 | Potter, Myrtle S | Direct | Sell | 10202025 | 66.95 | 26 | 1,741 | 1,226,792 | Form | |
| 60 | Tariq, Musa | Direct | Sell | 9172025 | 55.63 | 116 | 6,453 | 422,287 | Form | |
| 61 | Potter, Myrtle S | Direct | Sell | 9172025 | 55.63 | 26 | 1,446 | 1,016,972 | Form | |
| 62 | Hidalgo, Medina Manuel | Direct | Sell | 9152025 | 54.16 | 2,165 | 117,251 | 46,088 | Form | |
| 63 | Eltoukhy, Helmy | Co-Chief Executive Officer | Direct | Sell | 9112025 | 59.45 | 300,000 | 17,835,995 | 126,249,060 | Form |
| 64 | Joyce, Meghan V | Direct | Sell | 9032025 | 65.84 | 100 | 6,584 | 736,289 | Form |
Investor Activity (13F)
Updated Sep 18, 2026Active managers (13F portfolio over $250M, at least 3 holdings) with a position over $5M that is either over 10% of their portfolio or held in a concentrated book of 50 or fewer total positions. Index/ETF, sovereign, bank, community-bank and charitable/donor-advised filers are excluded.
| Active Manager | Value | % of Portfolio | Total Positions | QoQ | Filing |
|---|---|---|---|---|---|
| Cadian Capital Management, LP | $72.0 Mil | 8.8% | 23 | TRIM -15.5% | 13F |
| Portman Square Capital LLP | $16.8 Mil | 2.6% | 44 | New | 13F |
| First Light Asset Management, LLC | $25.9 Mil | 2.3% | 35 | Hold | 13F |
| Casdin Capital, LLC | $29.1 Mil | 2.2% | 40 | TRIM -17.1% | 13F |
| Styrax Capital, LP | $27.7 Mil | 1.9% | 17 | ADD +6.5% | 13F |
| Kinetic Partners Management, LP | $12.0 Mil | 0.7% | 49 | New | 13F |
| Active Manager | Value | % of Portfolio | Total Positions | QoQ | Filing |
|---|---|---|---|---|---|
| Cadian Capital Management, LP | $72.0 Mil | 8.8% | 23 | TRIM -15.5% | 13F |
| Casdin Capital, LLC | $29.1 Mil | 2.2% | 40 | TRIM -17.1% | 13F |
| Styrax Capital, LP | $27.7 Mil | 1.9% | 17 | ADD +6.5% | 13F |
| First Light Asset Management, LLC | $25.9 Mil | 2.3% | 35 | Hold | 13F |
| Portman Square Capital LLP | $16.8 Mil | 2.6% | 44 | New | 13F |
| Kinetic Partners Management, LP | $12.0 Mil | 0.7% | 49 | New | 13F |
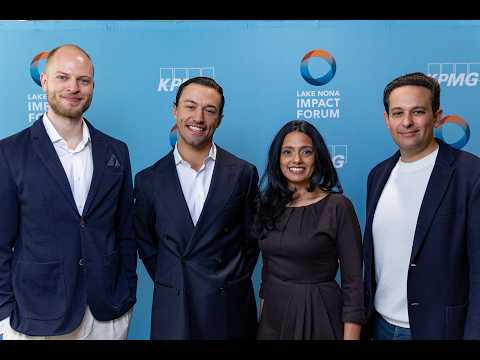
Guardant Health — Investor Video Playlist



Industry Resources
| Health Care Resources |
| U.S. National Library of Medicine |
| ClinicalTrials.gov |
| Modern Healthcare |
| Healthcare Dive |
| Fierce Healthcare |
| Health Affairs |
| Health Data Management |
| FDA Tracker |
| Life Sciences Tools & Services Resources |
| GenomeWeb |
| BioSpace |
| The Scientist |
External Quote Links
| Y Finance | Barrons |
| TradingView | Morningstar |
| SeekingAlpha | ValueLine |
| Motley Fool | Robinhood |
| CNBC | Etrade |
| MarketWatch | Unusual Whales |
| YCharts | Perplexity Finance |
| FinViz |
Prefer one of these to Trefis? Tell us why.