
Anterix (ATEX)
Market Price (11/12/2026): $77.05 | Market Cap: $1.5 BilSector: Communication Services | Industry: Integrated Telecommunication Services
Anterix (ATEX)
Market Price (11/12/2026): $77.05Market Cap: $1.5 BilSector: Communication ServicesIndustry: Integrated Telecommunication Services
Investment Highlights Why It Matters Detailed financial logic regarding cash flow yields vs trend-riding momentum.
Strong revenue growthRev Chg LTMRevenue Change % Last Twelve Months (LTM) is 26% Attractive cash flow generationCFO/Rev LTMCash Flow from Operations / Revenue (Sales), Last Twelve Months (LTM) is 42% Valuation becoming less expensiveP/S 6M Chg %Price/Sales change over 6 months. Declining P/S indicates valuation has become less expensive. is -28% Megatrend and thematic driversMegatrends include 5G & Advanced Connectivity, and Smart Grids & Grid Modernization. Themes include Telecom Infrastructure, Wireless Services, Show more. | Not profitable at operating income levelOp Inc LTMOperating Income, Last Twelve Months is -43 Mil, Op Mgn LTMOperating Margin = Operating Income / Revenue Reflects profitability before taxes and before impact of capital structure (interest payments). is -574% Expensive valuation multiplesP/SPrice/Sales ratio is 201x, P/CFOPrice/(Cash Flow from Operations). CFO is cash before capital expenditures. is 476x, P/EPrice/Earnings or Price/(Net Income) is 209x Stock price has recently run up significantly12M Rtn12 month market price return is 325% Significant share based compensationSBC/Rev LTMShare Based Compensation / Revenue (Sales), Last Twelve Months (LTM) is 165% Not cash flow generativeFCF/Rev LTMFree Cash Flow / Revenue (Sales), Last Twelve Months (LTM) is -256% Yield minus risk free rate is negativeERPEquity Risk Premium (ERP) = Total Yield - Risk Free Rate, Reflects the premium above risk free assets offered by the investment. is -4.8% Key risksATEX key risks include [1] challenges in commercializing its 900 MHz spectrum due to dependencies on clearing incumbent users and securing favorable FCC approvals, Show more. |
| Strong revenue growthRev Chg LTMRevenue Change % Last Twelve Months (LTM) is 26% |
| Attractive cash flow generationCFO/Rev LTMCash Flow from Operations / Revenue (Sales), Last Twelve Months (LTM) is 42% |
| Valuation becoming less expensiveP/S 6M Chg %Price/Sales change over 6 months. Declining P/S indicates valuation has become less expensive. is -28% |
| Megatrend and thematic driversMegatrends include 5G & Advanced Connectivity, and Smart Grids & Grid Modernization. Themes include Telecom Infrastructure, Wireless Services, Show more. |
| Not profitable at operating income levelOp Inc LTMOperating Income, Last Twelve Months is -43 Mil, Op Mgn LTMOperating Margin = Operating Income / Revenue Reflects profitability before taxes and before impact of capital structure (interest payments). is -574% |
| Expensive valuation multiplesP/SPrice/Sales ratio is 201x, P/CFOPrice/(Cash Flow from Operations). CFO is cash before capital expenditures. is 476x, P/EPrice/Earnings or Price/(Net Income) is 209x |
| Stock price has recently run up significantly12M Rtn12 month market price return is 325% |
| Significant share based compensationSBC/Rev LTMShare Based Compensation / Revenue (Sales), Last Twelve Months (LTM) is 165% |
| Not cash flow generativeFCF/Rev LTMFree Cash Flow / Revenue (Sales), Last Twelve Months (LTM) is -256% |
| Yield minus risk free rate is negativeERPEquity Risk Premium (ERP) = Total Yield - Risk Free Rate, Reflects the premium above risk free assets offered by the investment. is -4.8% |
| Key risksATEX key risks include [1] challenges in commercializing its 900 MHz spectrum due to dependencies on clearing incumbent users and securing favorable FCC approvals, Show more. |
Qualitative Assessment
AI Analysis | Feedback
Nov 10: down 6.6% in one day (S&P 500 down 0.4%)
The stock fell after Anterix reported its second quarter fiscal 2027 results. Zacks Investment Research reported the company had a loss and missed revenue estimates.
Down 25.4% from its Oct 29 high to Nov 5, up 11.7% since (S&P 500 down 4.7%)
The stock declined during this run without specific company news, though the market also fell. The largest daily drop on November 5 occurred as market headlines reported a broad market decline.
Nov 11: up 1.4% the day after its Nov 10 earnings report (S&P 500 up 1.3%)
The stock rose following a broader market rebound, as investors ran back to AI stocks after a selloff. This occurred despite Anterix reporting a loss and missing revenue estimates for its second quarter fiscal 2027.
Nov 10: down 6.6% in one day (S&P 500 down 0.4%)
The stock fell after Anterix reported its second quarter fiscal 2027 results. Zacks Investment Research reported the company had a loss and missed revenue estimates.
Down 25.4% from its Oct 29 high to Nov 5, up 11.7% since (S&P 500 down 4.7%)
The stock declined during this run without specific company news, though the market also fell. The largest daily drop on November 5 occurred as market headlines reported a broad market decline.
Nov 11: up 1.4% the day after its Nov 10 earnings report (S&P 500 up 1.3%)
The stock rose following a broader market rebound, as investors ran back to AI stocks after a selloff. This occurred despite Anterix reporting a loss and missing revenue estimates for its second quarter fiscal 2027.
Show less
Stock Movement Drivers
Fundamental Drivers
The -17.7% change in ATEX stock from 7/31/2026 to 11/11/2026 was primarily driven by a -93.1% change in the company's Net Income Margin (%).| (LTM values as of) | 7312026 | 11112026 | Change |
|---|---|---|---|
| Stock Price ($) | 93.02 | 76.53 | -17.7% |
| Change Contribution By: | |||
| Total Revenues ($ Mil) | 7 | 7 | 14.6% |
| Net Income Margin (%) | 1394.2% | 96.2% | -93.1% |
| P/E Multiple | 19.3 | 209.3 | 986.9% |
| Shares Outstanding (Mil) | 19 | 20 | -4.3% |
| Cumulative Contribution | -17.7% |
Market Drivers
7/31/2026 to 11/11/2026| Return | Correlation | |
|---|---|---|
| ATEX | -17.7% | |
| Market (SPY) | 1.7% | 57.7% |
| Sector (XLC) | 0.3% | 8.1% |
Fundamental Drivers
The 58.4% change in ATEX stock from 4/30/2026 to 11/11/2026 was primarily driven by a 1785.2% change in the company's P/E Multiple.| (LTM values as of) | 4302026 | 11112026 | Change |
|---|---|---|---|
| Stock Price ($) | 48.32 | 76.53 | 58.4% |
| Change Contribution By: | |||
| Total Revenues ($ Mil) | 6 | 7 | 25.5% |
| Net Income Margin (%) | 1370.9% | 96.2% | -93.0% |
| P/E Multiple | 11.1 | 209.3 | 1785.2% |
| Shares Outstanding (Mil) | 19 | 20 | -4.7% |
| Cumulative Contribution | 58.4% |
Market Drivers
4/30/2026 to 11/11/2026| Return | Correlation | |
|---|---|---|
| ATEX | 58.4% | |
| Market (SPY) | 6.0% | 44.8% |
| Sector (XLC) | -6.5% | 4.3% |
Fundamental Drivers
The 278.5% change in ATEX stock from 10/31/2025 to 11/11/2026 was primarily driven by a 1530.3% change in the company's P/E Multiple.| (LTM values as of) | 10312025 | 11112026 | Change |
|---|---|---|---|
| Stock Price ($) | 20.22 | 76.53 | 278.5% |
| Change Contribution By: | |||
| Total Revenues ($ Mil) | 6 | 7 | 25.7% |
| Net Income Margin (%) | 495.1% | 96.2% | -80.6% |
| P/E Multiple | 12.8 | 209.3 | 1530.3% |
| Shares Outstanding (Mil) | 19 | 20 | -5.0% |
| Cumulative Contribution | 278.5% |
Market Drivers
10/31/2025 to 11/11/2026| Return | Correlation | |
|---|---|---|
| ATEX | 278.5% | |
| Market (SPY) | 12.3% | 34.6% |
| Sector (XLC) | -4.6% | 4.8% |
Fundamental Drivers
The 151.0% change in ATEX stock from 10/31/2023 to 11/11/2026 was primarily driven by a 239.7% change in the company's Total Revenues ($ Mil).| (LTM values as of) | 10312023 | 11112026 | Change |
|---|---|---|---|
| Stock Price ($) | 30.49 | 76.53 | 151.0% |
| Change Contribution By: | |||
| Total Revenues ($ Mil) | 2 | 7 | 239.7% |
| P/S Multiple | 263.6 | 201.4 | -23.6% |
| Shares Outstanding (Mil) | 19 | 20 | -3.3% |
| Cumulative Contribution | 151.0% |
Market Drivers
10/31/2023 to 11/11/2026| Return | Correlation | |
|---|---|---|
| ATEX | 151.0% | |
| Market (SPY) | 87.9% | 29.1% |
| Sector (XLC) | 73.1% | 15.2% |
Price Returns Compared
| 2021 | 2022 | 2023 | 2024 | 2025 | 2026 | Total [1] | |
|---|---|---|---|---|---|---|---|
| Returns | |||||||
| ATEX Return | 56% | -45% | 4% | -8% | -29% | 251% | 104% |
| Peers Return | 124% | 20% | 13% | -11% | 29% | 108% | 628% |
| S&P 500 Return | 27% | -19% | 24% | 23% | 16% | 10% | 100% |
Monthly Win Rates [3] | |||||||
| ATEX Win Rate | 67% | 33% | 50% | 50% | 33% | 64% | |
| Peers Win Rate | 54% | 54% | 54% | 38% | 50% | 73% | |
| S&P 500 Win Rate | 75% | 42% | 67% | 75% | 67% | 36% | |
Max Drawdowns [4] | |||||||
| ATEX Max Drawdown | -14% | -49% | -25% | -29% | -57% | -37% | |
| Peers Max Drawdown | -51% | -34% | -44% | -45% | -49% | -22% | |
| S&P 500 Max Drawdown | -5% | -25% | -10% | -8% | -19% | -9% | |
[1] Cumulative total returns since the beginning of 2021
[2] Peers: IRDM, GSAT. See ATEX Returns vs. Peers.
[3] Win Rate = % of calendar months in which monthly returns were positive
[4] Max drawdown represents maximum peak-to-trough decline within a year
[5] 2026 data is for the year up to 11/11/2026 (YTD)
How Low Can It Go
| Event | ATEX | S&P 500 |
|---|---|---|
| 2025 US Tariff Shock | ||
| % Loss | -38.5% | -18.8% |
| % Gain to Breakeven | 62.6% | 23.1% |
| Time to Breakeven | 319 days | 79 days |
| 2023 SVB Regional Banking Crisis | ||
| % Loss | -20.4% | -6.7% |
| % Gain to Breakeven | 25.7% | 7.1% |
| Time to Breakeven | 83 days | 31 days |
| 2022 Inflation Shock & Fed Tightening | ||
| % Loss | -49.2% | -24.5% |
| % Gain to Breakeven | 96.7% | 32.4% |
| Time to Breakeven | 1304 days | 427 days |
| 2020 COVID-19 Crash | ||
| % Loss | -32.9% | -33.7% |
| % Gain to Breakeven | 49.1% | 50.9% |
| Time to Breakeven | 32 days | 140 days |
| Q4 2018 Fed Policy Error / Growth Scare | ||
| % Loss | -13.2% | -19.2% |
| % Gain to Breakeven | 15.2% | 23.8% |
| Time to Breakeven | 3 days | 105 days |
| 2016-2017 Trump Reflation Bond Selloff | ||
| % Loss | -16.2% | -3.7% |
| % Gain to Breakeven | 19.3% | 3.9% |
| Time to Breakeven | 16 days | 6 days |
In The Past
Anterix's stock fell -38.5% during the 2025 US Tariff Shock. Such a loss loss requires a 62.6% gain to breakeven.
Preserve Wealth
Limiting losses and compounding gains is essential to preserving wealth.
Asset Allocation
Actively managed asset allocation strategies protect wealth. Learn more.
| Event | ATEX | S&P 500 |
|---|---|---|
| 2025 US Tariff Shock | ||
| % Loss | -38.5% | -18.8% |
| % Gain to Breakeven | 62.6% | 23.1% |
| Time to Breakeven | 319 days | 79 days |
| 2023 SVB Regional Banking Crisis | ||
| % Loss | -20.4% | -6.7% |
| % Gain to Breakeven | 25.7% | 7.1% |
| Time to Breakeven | 83 days | 31 days |
| 2022 Inflation Shock & Fed Tightening | ||
| % Loss | -49.2% | -24.5% |
| % Gain to Breakeven | 96.7% | 32.4% |
| Time to Breakeven | 1304 days | 427 days |
| 2020 COVID-19 Crash | ||
| % Loss | -32.9% | -33.7% |
| % Gain to Breakeven | 49.1% | 50.9% |
| Time to Breakeven | 32 days | 140 days |
| 2015-2016 China Devaluation / Global Growth Scare | ||
| % Loss | -36.4% | -12.2% |
| % Gain to Breakeven | 57.3% | 13.9% |
| Time to Breakeven | 50 days | 62 days |
| 2014-2016 Oil Price Collapse | ||
| % Loss | -45.9% | -6.8% |
| % Gain to Breakeven | 84.7% | 7.3% |
| Time to Breakeven | 72 days | 15 days |
In The Past
Anterix's stock fell -38.5% during the 2025 US Tariff Shock. Such a loss loss requires a 62.6% gain to breakeven.
Preserve Wealth
Limiting losses and compounding gains is essential to preserving wealth.
Asset Allocation
Actively managed asset allocation strategies protect wealth. Learn more.
About Anterix (ATEX)
Anterix Inc. (ATEX) operates as a wireless communications company centered on commercializing its substantial spectrum assets. The company holds nationwide licensed rights within the 900 MHz wireless spectrum band, covering the contiguous United States, Alaska, Hawaii, and Puerto Rico. This unique spectrum position forms the foundation of its business model.
Anterix's core service involves enabling its customers to deploy private broadband networks. Rather than providing direct wireless services to end-users, Anterix facilitates the creation of dedicated, high-performance network infrastructures for specific organizational needs. This allows its clients to build and control their own secure communication systems utilizing Anterix's exclusive spectrum, supporting various technologies and solutions.
The company primarily targets utility companies and other critical infrastructure organizations as its main customers. These sectors require highly reliable, secure, and resilient communication networks for their operational technology, grid modernization efforts, and overall mission-critical functions. Anterix positions itself as a strategic partner, providing the essential spectrum for these vital industries to implement advanced private wireless capabilities.
```AI Analysis | Feedback
Here are 1-3 brief analogies for Anterix (ATEX):
- Anterix is like a Crown Castle or American Tower for dedicated radio spectrum, enabling utilities to build their own private broadband networks.
- Think of Anterix as a specialized 'digital landlord' for the airwaves, providing exclusive 900 MHz spectrum for utility companies to build their own private wireless infrastructure.
AI Analysis | Feedback
- 900 MHz Licensed Spectrum: Anterix commercializes access to its nationwide licensed spectrum in the 900 MHz band for wireless communications.
- Private Broadband Network Solutions: Anterix enables utility and critical infrastructure customers to deploy and utilize private broadband networks and related technologies.
AI Analysis | Feedback
Anterix (ATEX) primarily sells its spectrum assets and related solutions to other companies, specifically targeting the utility and critical infrastructure sectors. Its major customers, as identified through public announcements and investor communications, are primarily large utility companies focused on deploying private broadband networks for grid modernization and critical operations.
The following are some of Anterix's major customer companies:
AI Analysis | Feedback
AI Analysis | Feedback
AI Analysis | Feedback
The key risks to Anterix's (ATEX) business are primarily centered around the commercialization and deployment of its 900 MHz spectrum assets for private broadband networks for utilities.
-
Spectrum Clearing Costs and Delays: Anterix faces the risk of increasing costs and potential delays associated with clearing its 900 MHz spectrum. This involves making payments to incumbent users for retuning or swaps to free up the spectrum for broadband use. These ongoing and rising expenses can impact deal economics and slow down cash conversion until clearing milestones are completed. Delays by current channel users, such as members of the Association of American Railroads (AAR), in completing their channel clearing could further impede Anterix's ability to commercialize broadband licenses and delay its customers' network deployments.
-
Elongated Utility Decision Cycles and License Delivery Delays: The sales cycle for Anterix's spectrum to large utility customers can be lengthy due to extended procurement and deployment processes within these organizations. This "slippage risk" can lead to delays in achieving milestone-based collections, recognizing revenue, and receiving anticipated cash inflows. The delivery of county-level licenses also contributes to this timing risk, potentially pushing out the schedules for cash conversion and network deployments.
-
Competition: Anterix operates in a competitive landscape, and its targeted utility and critical infrastructure customers may consider alternative solutions. The National Public Safety Broadband Network (NPSBN), also known as "FirstNet," could offer an additional source of competition to Anterix's 900 MHz spectrum assets.
AI Analysis | Feedback
AI Analysis | Feedback
Anterix (ATEX) operates in the United States, Alaska, Hawaii, and Puerto Rico, focusing on providing private broadband networks to utility and critical infrastructure customers utilizing its licensed 900 MHz spectrum.
The addressable markets for Anterix's main products and services are primarily in the U.S. and include:
- Anterix's pipeline of opportunities for private broadband networks for utilities is valued at over $3 billion, with $1 billion in near-term opportunities across 18 utilities in the U.S.
- The company's recently launched TowerX and CatalyX solutions have a combined Total Addressable Market (TAM) of approximately $1 billion in the U.S.
- The U.S. private LTE and 5G network market for licensed projects, which aligns with Anterix's offerings, is projected to grow from USD 1.28 billion in 2025 to USD 4.64 billion by 2031. This market serves critical infrastructure sectors, including defense installations, utility substations, and hospitals.
AI Analysis | Feedback
Anterix (ATEX) is poised for future revenue growth over the next 2-3 years, driven by several key factors:
- Expansion of 900 MHz Broadband Spectrum and Deployments: A significant catalyst for Anterix is the Federal Communications Commission's (FCC) unanimous decision in February 2026 to expand the 900 MHz broadband segment from 6 MHz to 10 MHz in a 5x5 configuration. This expansion is expected to unlock higher-capacity, low-band private broadband for mission-critical uses across utilities and critical infrastructure sectors, positioning 900 MHz as a foundational layer for private operational connectivity and improving performance and economics for private broadband networks. This regulatory development is anticipated to accelerate the adoption and deployment of Anterix's spectrum.
- Success of the Anterix Accelerator Program and Deployment-Focused Services: Anterix's Accelerator program, which offers matching spectrum value to expedite utility adoption of 900 MHz private LTE, is generating substantial interest. The program is reportedly oversubscribed, with potential contracts exceeding $500 million, signaling strong demand within the utility sector. This initiative, along with a broader strategy to provide deployment-focused services and cultivate a partner ecosystem, is designed to mitigate implementation risks and support the long-term operations of utilities, thereby driving spectrum monetization.
- Monetization of a Robust Customer Pipeline: Anterix has identified a substantial pipeline valued at approximately $3 billion, encompassing over 60 potential customers, primarily in the utility sector. The company has already secured eight flagship customers with contracts totaling around $400 million, establishing a solid foundation for future revenue. Converting these prospective contracts into active deployments is expected to be a significant driver of revenue growth.
- Introduction and Growth of New Products and Services: Anterix has launched new solutions, such as TowerX and CatalyX, aimed at streamlining deployments and creating opportunities for recurring revenue streams. These new offerings, including services like tower access and SIM management, are designed to address friction points in utility deployments and expand the company's service portfolio beyond core spectrum licensing. The company believes these initiatives can tap into a $1 billion annual market opportunity.
- Increasing Utility Adoption of Private Broadband Networks: A fundamental shift is occurring in the utility industry, where communications systems are increasingly viewed as essential components of grid infrastructure. Utilities are opting for secure, self-managed private broadband networks to modernize their grids, enhance field automation, improve outage detection, and integrate new technologies safely. Anterix is positioned to capitalize on this trend by leveraging its 900 MHz spectrum to enable these critical utility-controlled private broadband networks.
AI Analysis | Feedback
Share Repurchases
- In September 2021, Anterix's Board of Directors authorized a share repurchase program for up to $50 million over a two-year period.
- As of March 31, 2025, Anterix had an authorized share repurchase program for up to $250.0 million of its common stock, set to expire on or before September 21, 2026.
- Anterix repurchased $24.7 million of shares in fiscal year 2024 and $8.4 million in fiscal year 2025.
Share Issuance
- Anterix received $1.691 million in proceeds from stock option exercises for the fiscal year ended March 31, 2025.
- For the fiscal year ended March 31, 2024, proceeds from stock option exercises amounted to $0.770 million.
Inbound Investments
- In February 2025, Anterix initiated a strategic review process following inbound interest in the company, which was ongoing as of June 2025.
Capital Expenditures
- Anterix invested $17.0 million in spectrum clearing costs during fiscal year 2024.
- For fiscal year 2025, spectrum clearing costs totaled $18.1 million.
- Expected capital expenditures for spectrum clearing include approximately $5 million in the fourth quarter of fiscal year 2025 and $15-20 million in fiscal year 2026.
Peer Outperformance in Integrated Telecommunication Services
| Industry | Names | 1Y med | 3Y med | 5Y med | Top 3 by 5Y |
|---|---|---|---|---|---|
| Wireless Telecommunication Services | 3 | -5.2% | 22.7% | 52.8% | ECHO 250% · TMUS 53% |
| Publishing | 6 | 24.1% | 18.8% | 11.1% | NYT 60% · NWSA 19% · WLY 12% |
| Integrated Telecommunication Services ← | 21 | -12.4% | 25.8% | -17.7% | GSAT 252% · AD 83% · TDS 80% |
| Movies & Entertainment | 23 | 23.6% | 59.6% | -26.8% | IMAX 135% · FWONA 103% · CNK 99% |
| Broadcasting | 14 | -7.1% | -20.6% | -66.9% | FOXA 76% · NXST 45% · SIRI -40% |
| Interactive Media & Services | 33 | -39.1% | -40.1% | -70.8% | GOOGL 103% · META 94% · CARG -10% |
| Interactive Home Entertainment | 8 | -43.2% | -60.1% | -72.1% | TTWO 25% · RBLX -46% · PINS -57% |
| Alternative Carriers | 4 | -46.2% | 11.8% | -73.9% | IRDM 19% · LUMN -66% |
| Advertising | 18 | -32.0% | -8.5% | -74.0% | APP 252% · OMC 53% · MGNI 27% |
Latest Trefis Analyses
| Title | Date | |
|---|---|---|
| DASHBOARDS | ||
| Anterix Earnings Notes | 12/16/2025 | |
| How Low Can Anterix Stock Really Go? | 10/17/2025 | |
| Anterix (ATEX) Stock: 33% of days in last 3 months had 1% or greater fluctuation | 04/17/2025 | |
| Anterix (ATEX) Operating Cash Flow Comparison | 02/17/2025 | |
| Anterix (ATEX) Net Income Comparison | 02/15/2025 | |
| Anterix (ATEX) Operating Income Comparison | 02/14/2025 | |
| Anterix (ATEX) Revenue Comparison | 02/13/2025 | |
| Anterix vs. S&P500 Correlation | 10/03/2024 | |
| Anterix Price Volatility | 09/24/2024 | |
| Anterix (ATEX) Stock Has 53% Chance Of Rise In The Next One Month | 02/13/2023 |
| Title | |
|---|---|
| ARTICLES |
Research & Analysis
Invest in Strategies
Wealth Management
Peer Comparisons
| Peers to compare with: |
Financials
| Median | |
|---|---|
| Name | |
| Mkt Price | 77.05 |
| Mkt Cap | 5.1 |
| Rev LTM | 278 |
| Op Inc LTM | 11 |
| FCF LTM | 108 |
| FCF 3Y Avg | 120 |
| CFO LTM | 395 |
| CFO 3Y Avg | 374 |
Growth & Margins
| Median | |
|---|---|
| Name | |
| Rev Chg LTM | 5.9% |
| Rev Chg 3Y Avg | 9.3% |
| Rev Chg Q | 3.8% |
| QoQ Delta Rev Chg LTM | 1.0% |
| Op Inc Chg LTM | -1.2% |
| Op Inc Chg 3Y Avg | 7.4% |
| Op Mgn LTM | 3.9% |
| Op Mgn 3Y Avg | 1.6% |
| QoQ Delta Op Mgn LTM | -0.9% |
| CFO/Rev LTM | 44.7% |
| CFO/Rev 3Y Avg | 74.6% |
| FCF/Rev LTM | 32.6% |
| FCF/Rev 3Y Avg | 34.3% |
Price Behavior
| Market Price | $76.53 | |
| Market Cap ($ Bil) | 1.5 | |
| First Trading Date | 02/03/2015 | |
| Distance from 52W High | -29.3% | |
| 50 Days | 200 Days | |
| DMA Price | $81.30 | $67.46 |
| DMA Trend | down | up |
| Distance from DMA | -5.9% | 13.4% |
| 3M | 1YR | |
| Volatility | 68.1% | 67.8% |
| Downside Capture | 343.53 | 106.62 |
| Upside Capture | 310.75 | 263.29 |
| Correlation (S&P 500) | 57.0% | 34.9% |
| 1M | 2M | 3M | 6M | 1Y | 3Y | |
|---|---|---|---|---|---|---|
| Beta | 2.95 | 2.67 | 3.10 | 2.35 | 1.55 | 0.94 |
| Up Beta | 3.28 | 3.14 | 4.22 | 5.32 | 2.26 | 0.78 |
| Down Beta | 1.93 | 1.43 | 0.79 | -0.31 | 0.15 | 0.69 |
| Up Capture | 551% | 349% | 397% | 469% | 597% | 206% |
| Bmk +ve Days | 12 | 18 | 28 | 62 | 130 | 427 |
| Stock +ve Days | 12 | 19 | 30 | 67 | 142 | 358 |
| Down Capture | 205% | 247% | 294% | 152% | 92% | 103% |
| Bmk -ve Days | 10 | 25 | 36 | 64 | 121 | 325 |
| Stock -ve Days | 10 | 24 | 34 | 59 | 109 | 386 |
[1] Upside and downside betas calculated using positive and negative benchmark daily returns respectively
Based On 1-Year Data
| Annualized Return | Annualized Volatility | Sharpe Ratio | Correlation with ATEX | |
|---|---|---|---|---|
| ATEX | 324.3% | 67.8% | 2.39 | - |
| Sector ETF (XLC) | -3.3% | 16.8% | -0.38 | 4.1% |
| Equity (SPY) | 12.5% | 13.7% | 0.60 | 34.4% |
| Gold (GLD) | -3.5% | 28.8% | -0.13 | 15.3% |
| Commodities (DBC) | 33.0% | 21.3% | 1.24 | -6.6% |
| Real Estate (VNQ) | 11.7% | 14.2% | 0.53 | 4.9% |
| Bitcoin (BTCUSD) | -30.9% | 43.5% | -0.73 | 21.8% |
Smart multi-asset allocation framework can stack odds in your favor. Learn How
Based On 5-Year Data
| Annualized Return | Annualized Volatility | Sharpe Ratio | Correlation with ATEX | |
|---|---|---|---|---|
| ATEX | 3.9% | 48.2% | 0.23 | - |
| Sector ETF (XLC) | 7.2% | 21.1% | 0.25 | 19.8% |
| Equity (SPY) | 11.8% | 17.3% | 0.51 | 29.6% |
| Gold (GLD) | 17.1% | 19.2% | 0.72 | 10.2% |
| Commodities (DBC) | 7.9% | 19.6% | 0.29 | 2.1% |
| Real Estate (VNQ) | 1.3% | 18.9% | -0.04 | 27.8% |
| Bitcoin (BTCUSD) | 3.1% | 51.5% | 0.24 | 17.7% |
Smart multi-asset allocation framework can stack odds in your favor. Learn How
Based On 10-Year Data
| Annualized Return | Annualized Volatility | Sharpe Ratio | Correlation with ATEX | |
|---|---|---|---|---|
| ATEX | 13.0% | 51.6% | 0.43 | - |
| Sector ETF (XLC) | 8.9% | 22.1% | 0.44 | 27.5% |
| Equity (SPY) | 15.5% | 18.0% | 0.73 | 33.5% |
| Gold (GLD) | 11.5% | 16.6% | 0.57 | 6.4% |
| Commodities (DBC) | 7.4% | 18.2% | 0.33 | 6.0% |
| Real Estate (VNQ) | 6.1% | 20.7% | 0.25 | 29.2% |
| Bitcoin (BTCUSD) | 58.6% | 66.3% | 0.99 | 12.6% |
Smart multi-asset allocation framework can stack odds in your favor. Learn How
Returns Analyses
Earnings Returns History
Updated 11/12/2026| Forward Returns | |||
|---|---|---|---|
| Earnings Date | 1D Returns | 5D Returns | 21D Returns |
| 11/10/2026 | 1.4% | ||
| 8/11/2026 | -4.5% | -2.4% | -10.9% |
| 6/10/2026 | 25.7% | 22.2% | 59.5% |
| 2/11/2026 | -1.4% | 16.0% | 24.6% |
| 11/12/2025 | 13.7% | 13.8% | 17.7% |
| 8/12/2025 | -4.4% | -1.7% | -3.6% |
| 6/24/2025 | -6.9% | -13.2% | -26.3% |
| 2/11/2025 | -0.7% | 16.1% | 3.3% |
| ... | |||
| SUMMARY STATS | |||
| # Positive | 7 | 7 | 7 |
| # Negative | 7 | 6 | 6 |
| Median Positive | 9.3% | 16.0% | 18.3% |
| Median Negative | -4.4% | -2.0% | -6.0% |
| Max Positive | 25.7% | 24.2% | 59.5% |
| Max Negative | -6.9% | -13.2% | -26.3% |
| Forward Returns | |||
|---|---|---|---|
| Earnings Date | 1D Returns | 5D Returns | 21D Returns |
| 11/10/2026 | 1.4% | ||
| 8/11/2026 | -4.5% | -2.4% | -10.9% |
| 6/10/2026 | 25.7% | 22.2% | 59.5% |
| 2/11/2026 | -1.4% | 16.0% | 24.6% |
| 11/12/2025 | 13.7% | 13.8% | 17.7% |
| 8/12/2025 | -4.4% | -1.7% | -3.6% |
| 6/24/2025 | -6.9% | -13.2% | -26.3% |
| 2/11/2025 | -0.7% | 16.1% | 3.3% |
| 11/13/2024 | -5.0% | -1.6% | -0.3% |
| 8/6/2024 | -2.3% | -0.1% | -3.9% |
| 2/14/2024 | 21.8% | 24.2% | 11.5% |
| 11/13/2023 | 9.3% | 12.1% | 23.6% |
| 8/2/2023 | 6.6% | 7.2% | 18.3% |
| 6/14/2023 | 6.1% | -3.2% | -8.1% |
| SUMMARY STATS | |||
| # Positive | 7 | 7 | 7 |
| # Negative | 7 | 6 | 6 |
| Median Positive | 9.3% | 16.0% | 18.3% |
| Median Negative | -4.4% | -2.0% | -6.0% |
| Max Positive | 25.7% | 24.2% | 59.5% |
| Max Negative | -6.9% | -13.2% | -26.3% |
SEC Filings
Expand for More| Report Date | Filing Date | Filing |
|---|---|---|
| 09/30/2026 | 11/10/2026 | 10-Q |
| 06/30/2026 | 08/11/2026 | 10-Q |
| 03/31/2026 | 06/25/2026 | 10-K |
| 12/31/2025 | 02/11/2026 | 10-Q |
| 09/30/2025 | 11/12/2025 | 10-Q |
| 06/30/2025 | 08/12/2025 | 10-Q |
| 03/31/2025 | 06/24/2025 | 10-K |
| 12/31/2024 | 02/11/2025 | 10-Q |
| 09/30/2024 | 11/13/2024 | 10-Q |
| 06/30/2024 | 08/06/2024 | 10-Q |
| 03/31/2024 | 06/26/2024 | 10-K |
| 12/31/2023 | 02/14/2024 | 10-Q |
| 09/30/2023 | 11/13/2023 | 10-Q |
| 06/30/2023 | 08/02/2023 | 10-Q |
| 03/31/2023 | 06/14/2023 | 10-K |
| 12/31/2022 | 02/09/2023 | 10-Q |
| Report Date | Filing Date | Filing |
|---|---|---|
| 09/30/2026 | 11/10/2026 | 10-Q |
| 06/30/2026 | 08/11/2026 | 10-Q |
| 03/31/2026 | 06/25/2026 | 10-K |
| 12/31/2025 | 02/11/2026 | 10-Q |
| 09/30/2025 | 11/12/2025 | 10-Q |
| 06/30/2025 | 08/12/2025 | 10-Q |
| 03/31/2025 | 06/24/2025 | 10-K |
| 12/31/2024 | 02/11/2025 | 10-Q |
| 09/30/2024 | 11/13/2024 | 10-Q |
| 06/30/2024 | 08/06/2024 | 10-Q |
| 03/31/2024 | 06/26/2024 | 10-K |
| 12/31/2023 | 02/14/2024 | 10-Q |
| 09/30/2023 | 11/13/2023 | 10-Q |
| 06/30/2023 | 08/02/2023 | 10-Q |
| 03/31/2023 | 06/14/2023 | 10-K |
| 12/31/2022 | 02/09/2023 | 10-Q |
| 09/30/2022 | 10/31/2022 | 10-Q |
| 06/30/2022 | 08/08/2022 | 10-Q |
| 03/31/2022 | 05/26/2022 | 10-K |
| 12/31/2021 | 02/03/2022 | 10-Q |
| 09/30/2021 | 11/03/2021 | 10-Q |
| 06/30/2021 | 08/11/2021 | 10-Q |
| 03/31/2021 | 06/15/2021 | 10-K |
| 12/31/2020 | 02/08/2021 | 10-Q |
| 09/30/2020 | 11/16/2020 | 10-Q |
| 06/30/2020 | 08/06/2020 | 10-Q |
| 03/31/2020 | 05/28/2020 | 10-K |
| 12/31/2019 | 02/04/2020 | 10-Q |
Recent Forward Guidance
Updated 11/11/2026Latest: Q2 2027 Earnings Reported 11/10/2026
| Forward Guidance | Guidance Change | |||||||
|---|---|---|---|---|---|---|---|---|
| Metric | Source | Low | Mid | High | % Chg | % Delta | Change | Prior |
| 2027 Contracted Proceeds Expected to be Received | Reported | 9.60 Mil | 0.0% | Affirmed | Guidance: 9.60 Mil for 2027 | |||
Prior: Q1 2027 Earnings Reported 8/11/2026
| Forward Guidance | Guidance Change | |||||||
|---|---|---|---|---|---|---|---|---|
| Metric | Source | Low | Mid | High | % Chg | % Delta | Change | Prior |
| 2027 Contracted Proceeds | Reported | 9.60 Mil | -62.1% | Lowered | Guidance: 25.30 Mil for 2027 | |||
Q4 2026 Earnings Reported 6/10/2026
| Forward Guidance | Guidance Change | |||||||
|---|---|---|---|---|---|---|---|---|
| Metric | Source | Low | Mid | High | % Chg | % Delta | Change | Prior |
| 2027 Contracted Customer Proceeds | Reported | 25.30 Mil | ||||||
| 2028-2034 Contracted Customer Proceeds | Reported | 23.40 Mil | ||||||
Q3 2026 Earnings Reported 2/11/2026
| Forward Guidance | Guidance Change | |||||||
|---|---|---|---|---|---|---|---|---|
| Metric | Source | Low | Mid | High | % Chg | % Delta | Change | Prior |
| Q4 2026 Contracted Proceeds | Reported | 80.00 Mil | ||||||
| 2026 Share Repurchases | Reported | 226.70 Mil | 0 | Affirmed | Guidance: 226.70 Mil for 2026 | |||
Insider Activity
Updated 10/13/2026| # | Owner | Title | Holding | Action | Filing Date | Price | Shares | Transacted Value | Value of Held Shares | Form |
|---|---|---|---|---|---|---|---|---|---|---|
| 1 | Marquez, Elena | Chief Financial Officer | Direct | Sell | 10092026 | 80.43 | 4,981 | 400,607 | 1,013,702 | Form |
| 2 | Lang, Scott A | President and CEO | Direct | Sell | 9222026 | 80.00 | 15,000 | 1,200,000 | 2,117,600 | Form |
| 3 | Martin, Heather | Chief Marketing Officer | Direct | Sell | 9112026 | 84.20 | 8,064 | 678,998 | 2,251,790 | Form |
| 4 | Daniels, Leslie B | Direct | Sell | 9112026 | 83.83 | 2,500 | 209,575 | 3,644,677 | Form | |
| 5 | Ashe, Gena L | Chief Legal Officer & Corp Sec | Direct | Sell | 9082026 | 85.44 | 4,357 | 372,262 | 442,067 | Form |
| # | Owner | Title | Holding | Action | Filing Date | Price | Shares | Transacted Value | Value of Held Shares | Form |
|---|---|---|---|---|---|---|---|---|---|---|
| 1 | Marquez, Elena | Chief Financial Officer | Direct | Sell | 10092026 | 80.43 | 4,981 | 400,607 | 1,013,702 | Form |
| 2 | Lang, Scott A | President and CEO | Direct | Sell | 9222026 | 80.00 | 15,000 | 1,200,000 | 2,117,600 | Form |
| 3 | Martin, Heather | Chief Marketing Officer | Direct | Sell | 9112026 | 84.20 | 8,064 | 678,998 | 2,251,790 | Form |
| 4 | Daniels, Leslie B | Direct | Sell | 9112026 | 83.83 | 2,500 | 209,575 | 3,644,677 | Form | |
| 5 | Ashe, Gena L | Chief Legal Officer & Corp Sec | Direct | Sell | 9082026 | 85.44 | 4,357 | 372,262 | 442,067 | Form |
| 6 | Daniels, Leslie B | Direct | Sell | 9082026 | 87.07 | 4,100 | 357,000 | 4,003,362 | Form | |
| 7 | Daniels, Leslie B | Direct | Sell | 9082026 | 87.15 | 6,000 | 522,900 | 4,364,211 | Form | |
| 8 | Kuhn, Thomas R | Direct | Sell | 8262026 | 88.85 | 10,000 | 888,526 | 1,575,446 | Form | |
| 9 | Kuhn, Thomas R | Direct | Sell | 8262026 | 79.52 | 1,654 | 131,526 | 1,409,969 | Form | |
| 10 | Heard, William | Heard Capital LLC | Sell | 8182026 | 90.11 | 46,400 | 4,181,095 | 150,513,823 | Form | |
| 11 | Lang, Scott A | President and CEO | Direct | Sell | 8172026 | 90.22 | 35,057 | 3,162,734 | 3,741,295 | Form |
| 12 | Lang, Scott A | President and CEO | Direct | Sell | 6192026 | 80.25 | 170 | 13,642 | 6,141,292 | Form |
| 13 | Marquez, Elena | Chief Financial Officer | Direct | Sell | 6182026 | 79.50 | 4,291 | 341,134 | 1,461,766 | Form |
| 14 | Yazdi, Mahvash | Direct | Sell | 6172026 | 80.00 | 7,000 | 560,000 | 1,552,560 | Form | |
| 15 | Guttman-Mccabe, Christopher | Chief Reg & Comm Officer | Direct | Sell | 6172026 | 82.46 | 91,437 | 7,539,884 | 6,415,956 | Form |
| 16 | Ashe, Gena L | Chief Legal Officer & Corp Sec | Direct | Sell | 6172026 | 81.31 | 17,711 | 1,440,049 | 774,948 | Form |
| 17 | Fleischhauer, Mark | Direct | Sell | 6162026 | 79.83 | 3,500 | 279,403 | 1,019,342 | Form | |
| 18 | Lang, Scott A | President and CEO | Direct | Buy | 12182025 | 21.61 | 1,160 | 25,068 | 178,499 | Form |
| 19 | Lang, Scott A | President and CEO | Direct | Buy | 12102025 | 20.41 | 2,450 | 50,004 | 144,911 | Form |
| 20 | Ashe, Gena L | Chief Legal Officer & Corp Sec | Direct | Sell | 11192025 | 21.07 | 6,564 | 138,303 | 281,622 | Form |
Investor Activity (13F)
Updated Nov 12, 2026Active managers (13F portfolio over $250M, at least 3 holdings) with a position over $5M that is either over 10% of their portfolio or held in a concentrated book of 50 or fewer total positions. Index/ETF, sovereign, bank, community-bank and charitable/donor-advised filers are excluded.
| Active Manager |
|---|
| Active Manager |
|---|
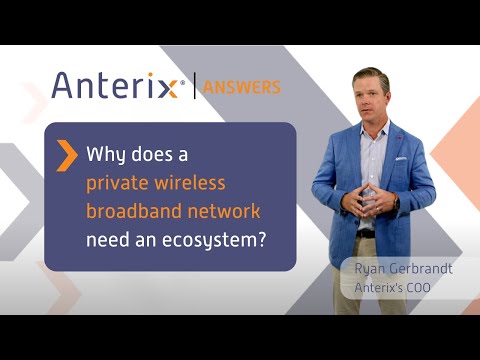
Anterix — Investor Video Playlist





Industry Resources
| Communication Services Resources |
| Variety |
| The Hollywood Reporter |
| Adweek |
| Integrated Telecommunication Services Resources |
| Fierce Telecom |
| Telecoms.com |
| Light Reading |
External Quote Links
| Y Finance | Barrons |
| TradingView | Morningstar |
| SeekingAlpha | ValueLine |
| Motley Fool | Robinhood |
| CNBC | Etrade |
| MarketWatch | Unusual Whales |
| YCharts | Perplexity Finance |
| FinViz |
Prefer one of these to Trefis? Tell us why.