
Twist Bioscience (TWST)
Market Price (11/12/2026): $113.92 | Market Cap: $7.6 BilSector: Health Care | Industry: Biotechnology
Twist Bioscience (TWST)
Market Price (11/12/2026): $113.92Market Cap: $7.6 BilSector: Health CareIndustry: Biotechnology
Investment Highlights Why It Matters Detailed financial logic regarding cash flow yields vs trend-riding momentum.
Megatrend and thematic driversMegatrends include Biotechnology & Genomics, and Precision Medicine. Themes include Gene Editing & Therapy, Advanced Diagnostics, Show more. | Meaningful short interestShort Interest % of Basic SharesShort Interest % of Basic Shares = (Short Interest Quantity) / (Basic Shares Outstanding). A high fraction of short interest can indicate potential risk of a short squeeze. is 16% | Not profitable at operating income levelOp Inc LTMOperating Income, Last Twelve Months is -138 Mil, Op Mgn LTMOperating Margin = Operating Income / Revenue Reflects profitability before taxes and before impact of capital structure (interest payments). is -32% Stock price has recently run up significantly6M Rtn6 month market price return is 125%, 12M Rtn12 month market price return is 291% Significant share based compensationSBC/Rev LTMShare Based Compensation / Revenue (Sales), Last Twelve Months (LTM) is 15% Not cash flow generativeCFO/Rev LTMCash Flow from Operations / Revenue (Sales), Last Twelve Months (LTM) is -12%, FCF/Rev LTMFree Cash Flow / Revenue (Sales), Last Twelve Months (LTM) is -22% Valuation getting more expensiveP/S 6M Chg %Price/Sales change over 6 months. Declining P/S indicates valuation has become less expensive. is 147% Yield minus risk free rate is negativeERPEquity Risk Premium (ERP) = Total Yield - Risk Free Rate, Reflects the premium above risk free assets offered by the investment. is -6.1% Key risksTWST key risks include [1] its consistent inability to achieve profitability amid significant cash burn, Show more. |
| Megatrend and thematic driversMegatrends include Biotechnology & Genomics, and Precision Medicine. Themes include Gene Editing & Therapy, Advanced Diagnostics, Show more. |
| Meaningful short interestShort Interest % of Basic SharesShort Interest % of Basic Shares = (Short Interest Quantity) / (Basic Shares Outstanding). A high fraction of short interest can indicate potential risk of a short squeeze. is 16% |
| Not profitable at operating income levelOp Inc LTMOperating Income, Last Twelve Months is -138 Mil, Op Mgn LTMOperating Margin = Operating Income / Revenue Reflects profitability before taxes and before impact of capital structure (interest payments). is -32% |
| Stock price has recently run up significantly6M Rtn6 month market price return is 125%, 12M Rtn12 month market price return is 291% |
| Significant share based compensationSBC/Rev LTMShare Based Compensation / Revenue (Sales), Last Twelve Months (LTM) is 15% |
| Not cash flow generativeCFO/Rev LTMCash Flow from Operations / Revenue (Sales), Last Twelve Months (LTM) is -12%, FCF/Rev LTMFree Cash Flow / Revenue (Sales), Last Twelve Months (LTM) is -22% |
| Valuation getting more expensiveP/S 6M Chg %Price/Sales change over 6 months. Declining P/S indicates valuation has become less expensive. is 147% |
| Yield minus risk free rate is negativeERPEquity Risk Premium (ERP) = Total Yield - Risk Free Rate, Reflects the premium above risk free assets offered by the investment. is -6.1% |
| Key risksTWST key risks include [1] its consistent inability to achieve profitability amid significant cash burn, Show more. |
Qualitative Assessment
AI Analysis | Feedback
Nov 11: down 7.2% in one day (S&P 500 up 1.3%)
The stock declined without company-specific news. This occurred on a day when the broader market advanced.
Down 30.5% from its Oct 28 high to Nov 5 (S&P 500 down 5.1%)
The stock saw a significant decline as the broader market reacted to growing concerns about tech and AI stocks, with headlines questioning a potential bubble and punishing the sector. Market unease about tech and AI was highlighted on October 30 and November 5, correlating with the steepest drops.
Nov 11: down 7.2% in one day (S&P 500 up 1.3%)
The stock declined without company-specific news. This occurred on a day when the broader market advanced.
Down 30.5% from its Oct 28 high to Nov 5 (S&P 500 down 5.1%)
The stock saw a significant decline as the broader market reacted to growing concerns about tech and AI stocks, with headlines questioning a potential bubble and punishing the sector. Market unease about tech and AI was highlighted on October 30 and November 5, correlating with the steepest drops.
Show less
Stock Movement Drivers
Fundamental Drivers
The 33.9% change in TWST stock from 7/31/2026 to 11/11/2026 was primarily driven by a 28.4% change in the company's P/S Multiple.| (LTM values as of) | 7312026 | 11112026 | Change |
|---|---|---|---|
| Stock Price ($) | 91.55 | 122.59 | 33.9% |
| Change Contribution By: | |||
| Total Revenues ($ Mil) | 409 | 432 | 5.5% |
| P/S Multiple | 13.8 | 17.7 | 28.4% |
| Shares Outstanding (Mil) | 62 | 62 | -1.1% |
| Cumulative Contribution | 33.9% |
Market Drivers
7/31/2026 to 11/11/2026| Return | Correlation | |
|---|---|---|
| TWST | 33.9% | |
| Market (SPY) | 1.7% | 42.8% |
| Sector (XLV) | 16.2% | 30.2% |
Fundamental Drivers
The 109.7% change in TWST stock from 4/30/2026 to 11/11/2026 was primarily driven by a 94.3% change in the company's P/S Multiple.| (LTM values as of) | 4302026 | 11112026 | Change |
|---|---|---|---|
| Stock Price ($) | 58.45 | 122.59 | 109.7% |
| Change Contribution By: | |||
| Total Revenues ($ Mil) | 392 | 432 | 10.3% |
| P/S Multiple | 9.1 | 17.7 | 94.3% |
| Shares Outstanding (Mil) | 61 | 62 | -2.1% |
| Cumulative Contribution | 109.7% |
Market Drivers
4/30/2026 to 11/11/2026| Return | Correlation | |
|---|---|---|
| TWST | 109.7% | |
| Market (SPY) | 6.0% | 45.1% |
| Sector (XLV) | 30.0% | 20.6% |
Fundamental Drivers
The 272.7% change in TWST stock from 10/31/2025 to 11/11/2026 was primarily driven by a 225.3% change in the company's P/S Multiple.| (LTM values as of) | 10312025 | 11112026 | Change |
|---|---|---|---|
| Stock Price ($) | 32.89 | 122.59 | 272.7% |
| Change Contribution By: | |||
| Total Revenues ($ Mil) | 362 | 432 | 19.2% |
| P/S Multiple | 5.4 | 17.7 | 225.3% |
| Shares Outstanding (Mil) | 60 | 62 | -3.9% |
| Cumulative Contribution | 272.7% |
Market Drivers
10/31/2025 to 11/11/2026| Return | Correlation | |
|---|---|---|
| TWST | 272.7% | |
| Market (SPY) | 12.3% | 47.5% |
| Sector (XLV) | 32.7% | 28.1% |
Fundamental Drivers
The 677.9% change in TWST stock from 10/31/2023 to 11/11/2026 was primarily driven by a 364.1% change in the company's P/S Multiple.| (LTM values as of) | 10312023 | 11112026 | Change |
|---|---|---|---|
| Stock Price ($) | 15.76 | 122.59 | 677.9% |
| Change Contribution By: | |||
| Total Revenues ($ Mil) | 235 | 432 | 83.4% |
| P/S Multiple | 3.8 | 17.7 | 364.1% |
| Shares Outstanding (Mil) | 57 | 62 | -8.6% |
| Cumulative Contribution | 677.9% |
Market Drivers
10/31/2023 to 11/11/2026| Return | Correlation | |
|---|---|---|
| TWST | 677.9% | |
| Market (SPY) | 87.9% | 47.6% |
| Sector (XLV) | 58.9% | 33.8% |
Price Returns Compared
| 2021 | 2022 | 2023 | 2024 | 2025 | 2026 | Total [1] | |
|---|---|---|---|---|---|---|---|
| Returns | |||||||
| TWST Return | -45% | -69% | 55% | 26% | -32% | 286% | -13% |
| Peers Return | 15% | -61% | -3% | -21% | -12% | 70% | -48% |
| S&P 500 Return | 27% | -19% | 24% | 23% | 16% | 10% | 100% |
Monthly Win Rates [3] | |||||||
| TWST Win Rate | 33% | 25% | 50% | 50% | 42% | 73% | |
| Peers Win Rate | 59% | 25% | 50% | 45% | 43% | 55% | |
| S&P 500 Win Rate | 75% | 42% | 67% | 75% | 67% | 36% | |
Max Drawdowns [4] | |||||||
| TWST Max Drawdown | -64% | -74% | -63% | -38% | -55% | -41% | |
| Peers Max Drawdown | -31% | -67% | -52% | -53% | -56% | -43% | |
| S&P 500 Max Drawdown | -5% | -25% | -10% | -8% | -19% | -9% | |
[1] Cumulative total returns since the beginning of 2021
[2] Peers: DNA, ILMN, TMO, CDXS, TXG. See TWST Returns vs. Peers.
[3] Win Rate = % of calendar months in which monthly returns were positive
[4] Max drawdown represents maximum peak-to-trough decline within a year
[5] 2026 data is for the year up to 11/11/2026 (YTD)
How Low Can It Go
| Event | TWST | S&P 500 |
|---|---|---|
| 2025 US Tariff Shock | ||
| % Loss | -41.3% | -18.8% |
| % Gain to Breakeven | 70.4% | 23.1% |
| Time to Breakeven | 258 days | 79 days |
| 2024 Yen Carry Trade Unwind | ||
| % Loss | -16.5% | -7.8% |
| % Gain to Breakeven | 19.8% | 8.5% |
| Time to Breakeven | 112 days | 18 days |
| Summer-Fall 2023 Five Percent Yield Shock | ||
| % Loss | -40.6% | -9.5% |
| % Gain to Breakeven | 68.4% | 10.5% |
| Time to Breakeven | 35 days | 24 days |
| 2023 SVB Regional Banking Crisis | ||
| % Loss | -52.0% | -6.7% |
| % Gain to Breakeven | 108.4% | 7.1% |
| Time to Breakeven | 76 days | 31 days |
| 2022 Inflation Shock & Fed Tightening | ||
| % Loss | -68.5% | -24.5% |
| % Gain to Breakeven | 217.8% | 32.4% |
| Time to Breakeven | 1464 days | 427 days |
| 2020 COVID-19 Crash | ||
| % Loss | -30.7% | -33.7% |
| % Gain to Breakeven | 44.3% | 50.9% |
| Time to Breakeven | 8 days | 140 days |
In The Past
Twist Bioscience's stock fell -41.3% during the 2025 US Tariff Shock. Such a loss loss requires a 70.4% gain to breakeven.
Preserve Wealth
Limiting losses and compounding gains is essential to preserving wealth.
Asset Allocation
Actively managed asset allocation strategies protect wealth. Learn more.
| Event | TWST | S&P 500 |
|---|---|---|
| 2025 US Tariff Shock | ||
| % Loss | -41.3% | -18.8% |
| % Gain to Breakeven | 70.4% | 23.1% |
| Time to Breakeven | 258 days | 79 days |
| Summer-Fall 2023 Five Percent Yield Shock | ||
| % Loss | -40.6% | -9.5% |
| % Gain to Breakeven | 68.4% | 10.5% |
| Time to Breakeven | 35 days | 24 days |
| 2023 SVB Regional Banking Crisis | ||
| % Loss | -52.0% | -6.7% |
| % Gain to Breakeven | 108.4% | 7.1% |
| Time to Breakeven | 76 days | 31 days |
| 2022 Inflation Shock & Fed Tightening | ||
| % Loss | -68.5% | -24.5% |
| % Gain to Breakeven | 217.8% | 32.4% |
| Time to Breakeven | 1464 days | 427 days |
| 2020 COVID-19 Crash | ||
| % Loss | -30.7% | -33.7% |
| % Gain to Breakeven | 44.3% | 50.9% |
| Time to Breakeven | 8 days | 140 days |
In The Past
Twist Bioscience's stock fell -41.3% during the 2025 US Tariff Shock. Such a loss loss requires a 70.4% gain to breakeven.
Preserve Wealth
Limiting losses and compounding gains is essential to preserving wealth.
Asset Allocation
Actively managed asset allocation strategies protect wealth. Learn more.
About Twist Bioscience (TWST)
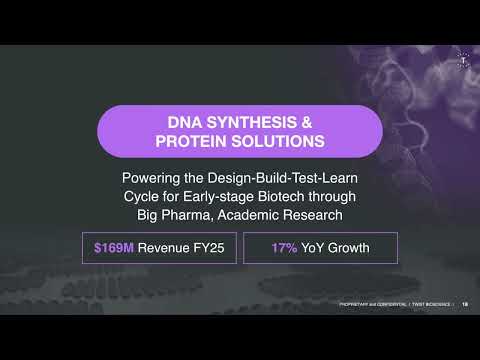
Twist Bioscience Corporation is a synthetic biology company that specializes in the manufacturing and sale of synthetic DNA-based products. The company's core innovation lies in its proprietary DNA synthesis platform, which enables the precise and high-throughput "writing" of DNA onto silicon chips. This unique technological capability allows Twist Bioscience to produce custom DNA sequences with accuracy and at scale.
Leveraging this advanced platform, Twist Bioscience offers a diverse portfolio of products and services. Its main offerings include synthetic genes, which are foundational components for various biotechnological applications, and tools designed for sample preparation, critical for modern genetic sequencing and analysis. Additionally, the company develops comprehensive antibody libraries, which are valuable resources for pharmaceutical companies engaged in drug discovery and development initiatives.
Twist Bioscience primarily serves customers within the biotechnology, pharmaceutical, and academic research sectors. Through strategic collaborations, it supports areas such as clinical genetic services, the development of advanced sequencing tools, and therapeutic antibody discovery. The company is also exploring cutting-edge applications, including the use of DNA as a novel medium for digital data storage, highlighting its forward-looking approach to expanding its market reach.
AI Analysis | Feedback
Here are 1-3 brief analogies for Twist Bioscience:
- Like a specialized manufacturer such as **Intel** or **TSMC**, but they "print" synthetic DNA on silicon chips for biological applications instead of computer chips.
- **Seagate** or **Western Digital**, but for storing digital information within DNA.
- The "Intel Inside" of synthetic biology, providing the core DNA building blocks for drug discovery and other research applications.
AI Analysis | Feedback
- Synthetic genes: Custom-made DNA sequences for research and development.
- Tools for sample preparation: Products designed to prepare biological samples for advanced analysis.
- Antibody libraries: Collections of diverse antibodies used in the discovery and development of new therapeutic drugs.
- DNA as a digital data storage medium: Utilizing synthetic DNA to store digital information.
AI Analysis | Feedback
Twist Bioscience (TWST) primarily sells its synthetic DNA-based products and services to other companies and research institutions.
Based on the provided information, its major customers and collaboration partners include:
- Victorian Clinical Genetic Services
- Vivlion GmbH
- Kyowa Kirin Co., Ltd. (TYO: 4151)
- deepCDR Biologics AG
- Centogene N.V (NASDAQ: CNTG)
- Boehringer Ingelheim International GmbH
AI Analysis | Feedback
AI Analysis | Feedback
Emily Leproust, CEO, Co-Founder & Board Member
Emily Leproust is the CEO and a co-founder of Twist Bioscience, which she established in 2013. She is recognized as a pioneer in high-throughput DNA synthesis. Before co-founding Twist Bioscience, Dr. Leproust held various escalating positions at Agilent Technologies, including Director of Applications and Chemistry R&D for Genomics, where she was instrumental in architecting the successful SureSelect product line and developing the Oligo Library Synthesis technology. She is also a co-founder of Petri, an accelerator dedicated to startups in engineering and biology.
Adam Laponis, Chief Financial Officer
Adam Laponis serves as the Chief Financial Officer for Twist Bioscience.
Patrick Finn, President and Chief Operating Officer
Patrick Finn was promoted to President and Chief Operating Officer of Twist Bioscience in October 2022, having joined the company in 2015. Prior to this role, he served as Chief Commercial Officer starting in 2019 and as Vice President of Sales and Marketing upon joining in 2015. Dr. Finn previously held the position of Vice President of Sales at Enzymatics (which was later acquired by QIAGEN), where he oversaw commercial activities for North America and Europe. His extensive career also includes leadership roles at Agilent Technologies as Director of Business Development, Director of Product Development for Beckman Coulter, and various technical positions at Invitrogen and GE Healthcare/Amersham International.
Siyuan Chen, Chief Technology Officer
Siyuan Chen holds the position of Chief Technology Officer at Twist Bioscience.
Angela Bitting, Chief ESG Officer, Senior Vice President of Corporate Affairs
Angela Bitting is the Chief ESG Officer and Senior Vice President of Corporate Affairs at Twist Bioscience.
AI Analysis | Feedback
- Persistent Unprofitability and High Cash Burn: Twist Bioscience has not yet achieved profitability, consistently reporting net operating losses and requiring significant capital to fund its operations and scale its proprietary platform. Despite strong revenue growth, the company faces substantial cash burn, which is a key financial concern for investors.
- Technological and Competitive Risk: The synthetic biology and DNA synthesis markets are characterized by rapid technological advancements. Twist Bioscience's proprietary silicon-based DNA synthesis platform, while a significant competitive advantage, faces the ongoing risk of disruption from new, potentially more cost-effective or efficient technologies being developed by competitors or academic groups (e.g., enzymatic or nanopore-based DNA synthesis). The company operates in a highly competitive landscape against established players with greater resources and extensive intellectual property portfolios, such as GenScript, Integrated DNA Technologies (IDT), Thermo Fisher Scientific, Eurofins Scientific, and Danaher's IDT. Intellectual property challenges are also an existential risk in this high-stakes market.
- Market Adoption and Execution Challenges in Emerging Areas: Twist Bioscience is expanding into nascent and high-potential markets such as DNA data storage and biopharma drug discovery. While these represent significant growth opportunities, they also carry inherent risks related to the speed of market adoption, the company's ability to effectively execute its strategy in these complex fields, and the extensive investment required for research and development. For example, the widespread adoption of DNA data storage still faces hurdles related to cost and speed.
AI Analysis | Feedback
AI Analysis | Feedback
Twist Bioscience (TWST) operates in several key addressable markets for its synthetic DNA-based products and services:
Synthetic DNA and Synthetic Biology
- The global DNA synthesis market size was estimated at USD 3.52 billion in 2024 and is projected to reach USD 13.85 billion by 2033, growing at a CAGR of 16.89% from 2025 to 2033.
- Another estimate values the global DNA synthesis market size at US$ 5.42 billion in 2025, growing to US$ 6.37 billion in 2026, and projected to reach around US$ 27.03 billion by 2035 at a CAGR of 17.42% between 2026 and 2035.
- The global synthetic DNA market was valued at US$3.7 billion in 2024 and is projected to reach US$10.3 billion by 2030, growing at a CAGR of 18.7% from 2024 to 2030.
- The U.S. DNA synthesis market size was estimated at USD 1.25 billion in 2024 and is projected to reach USD 4.62 billion by 2033, expanding at a CAGR of 15.93% from 2025 to 2033.
- North America held the largest share of the global DNA synthesis market, with approximately 39.83% in 2024.
- The broader global synthetic biology market size was valued at USD 25.6 billion in 2025 and is set to expand to USD 128.1 billion by 2035, advancing at a 17.5% CAGR from 2026 to 2035. North America is the largest market for synthetic biology.
Tools for Sample Preparation (Genomics)
- The global sample preparation market size was estimated at USD 7.88 billion in 2024 and is projected to reach USD 11.27 billion by 2030, growing at a CAGR of 6.1% from 2025 to 2030.
- Another report states the global sample preparation market size was valued at approximately USD 7.35 billion in 2024 and is predicted to reach around USD 13.41 billion by the end of 2034, expanding at a CAGR of around 6.2% from 2025 to 2034.
- North America was the largest region in the sample preparation market in 2025. The U.S. sample preparation market is primarily driven by advancements in biopharmaceutical research, drug discovery, and clinical diagnostics.
- The genomics segment dominated the sample preparation market in 2024, with a share of 30.94%, and is expected to witness the fastest growth rate.
- The global NGS (Next-Generation Sequencing) sample preparation market size is projected to reach USD 11,774.7 million by 2033, with a CAGR of 15.8% from 2025 to 2033. The U.S. NGS sample preparation market size is USD 1063.1 million in 2025 and is predicted to evolve at a CAGR of 14% over the analysis period.
Antibody Libraries for Drug Discovery and Development
- The global antibody library technology market is anticipated to reach a size of US$ 1.7 billion by 2025. It is set to showcase a CAGR of 4.1% during the forecast period to attain a value of US$ 2.2 billion by 2032.
- Another estimate for the global antibody library technology market is US$ 165.7 million in revenue in 2024, expected to expand at a CAGR of 3.98%, reaching an estimated valuation of US$ 217.8 million by the end of 2031.
- The global antibody discovery market size was valued at USD 6.9 billion in 2022 and is projected to reach USD 17.2 billion by 2032, growing at a CAGR of 9.6% from 2023 to 2032.
- The global human combinatorial antibody libraries market size is calculated at US$ 116.2 million in 2024, grew to US$ 122 million in 2025, and is projected to reach around US$ 189.57 million by 2034, expanding at a CAGR of 5.04% between 2025 and 2034. North America dominates the human combinatorial antibody libraries market in 2024.
DNA as a Digital Data Storage Medium
- The global DNA data storage market was valued at USD 145.8 million in 2025. The market is expected to grow from USD 272.8 million in 2026 to USD 6.3 billion in 2031 and USD 80.2 billion in 2035, at a value CAGR of 88% during the forecast period.
- Another estimate projects the global DNA data storage market to reach USD 44,213.05 million by 2034, growing at a CAGR of 88.01% from 2025 to 2034.
- The U.S. DNA data storage market was valued at USD 44.9 million in 2025. The U.S. is the largest single national market for DNA data storage.
- Twist Bioscience spun out its DNA data storage division into an independent company, Atlas Data Storage, in May 2025.
AI Analysis | Feedback
Here are 3-5 expected drivers of future revenue growth for Twist Bioscience (symbol: TWST) over the next 2-3 years:
- Expansion in AI-driven Drug Discovery and Biopharma Services: Twist Bioscience anticipates significant revenue growth from increased demand in the therapeutic sector, particularly from customers engaged in AI-enabled drug discovery and development. Orders from customers working on AI discovery projects grew by over $25 million in fiscal 2024, and the company continues to see strong demand from customers building models or testing molecules using its DNA synthesis and protein solutions.
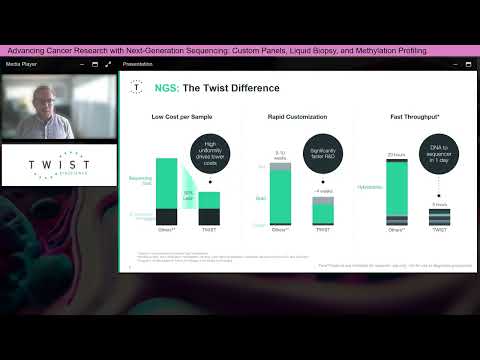
- Growth in Next-Generation Sequencing (NGS) Applications, especially Minimal Residual Disease (MRD) Testing: The company expects continued growth in its NGS applications, driven by demand from liquid biopsy and rare disease diagnostics. The commercial launch of new products such as MRD Express in early calendar 2026, with planned commercial scaling into 2027, is anticipated to be a significant contributor to revenue. Additionally, Twist is launching new library preparation kits like the TrueAmp library prep kit and PCR-Free WGS Library Preparation Kit to expand its reach in the whole genome sequencing market and address challenging sample types for clinical research.
- Expansion of Served Addressable Market (SAM) through New Product Introductions and Market Diversification: Twist Bioscience aims to expand its served addressable market from $7 billion to $12 billion by 2030 through the introduction of new products and solutions. This includes entering new market segments with GMP-grade products, focusing on the RNA segment, and exploring new market opportunities such as AgBio. The company is also launching new plasmid preps to support nucleic acid therapeutics research.
- Increased Customer Acquisition and Diversification: Twist Bioscience is actively working to expand its customer base and diversify its revenue streams. Efforts include leveraging its Express Genes portfolio to gain traction within the academic market and shifting its sales emphasis beyond solely large pharmaceutical accounts. This strategy has resulted in an influx of net new customers and is designed to build a broader and more resilient customer base.
AI Analysis | Feedback
Share Repurchases
- Twist Bioscience repurchased common stock valued at $4.0 million in 2024.
- The company's common stock repurchases amounted to $4.4 million in 2023.
- Share repurchases totaled $7.8 million in 2022.
Share Issuance
- Twist Bioscience issued $269.8 million in common stock during 2022.
- The company also issued $323.9 million in common stock in 2021.
- The number of shares outstanding has shown a consistent increase over the past several years, growing by 2.93% in the last year alone.
Outbound Investments
- Twist Bioscience's "Purchase of investments" totaled $51.9 million in 2024.
- "Purchase of investments" amounted to $76.3 million in 2023.
- The company's "Purchase of investments" reached $217.6 million in 2022, and net acquisitions were $13.9 million in the same year.
Capital Expenditures
- Capital expenditures for Twist Bioscience were $5.1 million in 2024.
- The company's capital expenditures were $27.8 million in 2023.
- In 2022, capital expenditures reached $101.9 million and are primarily focused on expanding and enhancing its proprietary silicon-based DNA synthesis platform and manufacturing processes.
Peer Outperformance in Biotechnology
| Industry | Names | 1Y med | 3Y med | 5Y med | Top 3 by 5Y |
|---|---|---|---|---|---|
| Health Care Distributors | 6 | 23.7% | 107.0% | 103.1% | CAH 516% · MCK 396% · COR 193% |
| Health Care Services | 20 | 31.7% | 27.6% | 12.4% | HIMS 170% · RDNT 147% · DGX 92% |
| Managed Health Care | 8 | 65.8% | -1.7% | 0.8% | OSCR 157% · HQY 49% · ELV 7% |
| Health Care Facilities | 26 | 24.0% | 20.4% | -5.7% | THC 269% · NHC 227% · EHC 193% |
| Health Care Equipment | 50 | 4.3% | 19.7% | -11.9% | GKOS 382% · UFPT 363% · TMDX 241% |
| Pharmaceuticals | 60 | -13.9% | 19.0% | -38.7% | LQDA 968% · XERS 694% · KNSA 623% |
| Health Care Supplies | 11 | 24.5% | 17.4% | -38.7% | LNTH 239% · HAE 104% · MMSI 30% |
| Life Sciences Tools & Services | 109 | -9.4% | -4.9% | -75.0% | AXGN 361% · MEDP 201% · NTRA 183% |
| Biotechnology ← | 364 | -25.0% | -29.2% | -80.8% | ELVN 1284% · TRVI 1156% · DNTH 1102% |
| Health Care Technology | 22 | -19.9% | -45.0% | -82.6% | VEEV -3% · DOCS -57% |
Latest Trefis Analyses
Research & Analysis
Invest in Strategies
Wealth Management
Peer Comparisons
| Peers to compare with: |
Financials
| Median | |
|---|---|
| Name | |
| Mkt Price | 91.27 |
| Mkt Cap | 7.8 |
| Rev LTM | 525 |
| Op Inc LTM | -50 |
| FCF LTM | 41 |
| FCF 3Y Avg | 12 |
| CFO LTM | 45 |
| CFO 3Y Avg | 18 |
Growth & Margins
| Median | |
|---|---|
| Name | |
| Rev Chg LTM | 7.0% |
| Rev Chg 3Y Avg | 1.1% |
| Rev Chg Q | 2.6% |
| QoQ Delta Rev Chg LTM | 0.6% |
| Op Inc Chg LTM | 18.4% |
| Op Inc Chg 3Y Avg | 21.8% |
| Op Mgn LTM | -21.7% |
| Op Mgn 3Y Avg | -32.9% |
| QoQ Delta Op Mgn LTM | 1.7% |
| CFO/Rev LTM | 1.9% |
| CFO/Rev 3Y Avg | -2.3% |
| FCF/Rev LTM | -0.3% |
| FCF/Rev 3Y Avg | -5.7% |
Price Behavior
| Market Price | $122.59 | |
| Market Cap ($ Bil) | 7.6 | |
| First Trading Date | 10/31/2018 | |
| Distance from 52W High | -40.2% | |
| 50 Days | 200 Days | |
| DMA Price | $150.90 | $92.53 |
| DMA Trend | up | up |
| Distance from DMA | -18.8% | 32.5% |
| 3M | 1YR | |
| Volatility | 113.8% | 83.9% |
| Downside Capture | 393.77 | 241.97 |
| Upside Capture | 515.06 | 389.56 |
| Correlation (S&P 500) | 49.5% | 49.3% |
| 1M | 2M | 3M | 6M | 1Y | 3Y | |
|---|---|---|---|---|---|---|
| Beta | 5.35 | 3.20 | 3.38 | 2.94 | 2.81 | 2.28 |
| Up Beta | 6.10 | 0.96 | -1.21 | 1.44 | 2.13 | 1.87 |
| Down Beta | 5.23 | 8.67 | 8.35 | 3.82 | 2.61 | 1.85 |
| Up Capture | 383% | 242% | 594% | 797% | 1827% | 19117% |
| Bmk +ve Days | 12 | 18 | 28 | 62 | 130 | 427 |
| Stock +ve Days | 10 | 21 | 32 | 64 | 133 | 381 |
| Down Capture | 544% | 124% | 148% | 165% | 156% | 113% |
| Bmk -ve Days | 10 | 25 | 36 | 64 | 121 | 325 |
| Stock -ve Days | 11 | 21 | 31 | 61 | 117 | 369 |
[1] Upside and downside betas calculated using positive and negative benchmark daily returns respectively
Based On 1-Year Data
| Annualized Return | Annualized Volatility | Sharpe Ratio | Correlation with TWST | |
|---|---|---|---|---|
| TWST | 298.1% | 83.9% | 2.01 | - |
| Sector ETF (XLV) | 30.1% | 17.0% | 1.37 | 28.3% |
| Equity (SPY) | 12.5% | 13.7% | 0.60 | 47.3% |
| Gold (GLD) | -3.5% | 28.8% | -0.13 | 26.9% |
| Commodities (DBC) | 33.0% | 21.3% | 1.24 | -15.3% |
| Real Estate (VNQ) | 11.7% | 14.2% | 0.53 | 12.5% |
| Bitcoin (BTCUSD) | -30.9% | 43.5% | -0.73 | 22.6% |
Smart multi-asset allocation framework can stack odds in your favor. Learn How
Based On 5-Year Data
| Annualized Return | Annualized Volatility | Sharpe Ratio | Correlation with TWST | |
|---|---|---|---|---|
| TWST | -0.7% | 79.5% | 0.34 | - |
| Sector ETF (XLV) | 8.6% | 15.4% | 0.36 | 37.4% |
| Equity (SPY) | 11.8% | 17.3% | 0.51 | 52.4% |
| Gold (GLD) | 17.1% | 19.2% | 0.72 | 14.2% |
| Commodities (DBC) | 7.9% | 19.6% | 0.29 | 1.6% |
| Real Estate (VNQ) | 1.3% | 18.9% | -0.04 | 39.4% |
| Bitcoin (BTCUSD) | 3.1% | 51.5% | 0.24 | 29.0% |
Smart multi-asset allocation framework can stack odds in your favor. Learn How
Based On 10-Year Data
| Annualized Return | Annualized Volatility | Sharpe Ratio | Correlation with TWST | |
|---|---|---|---|---|
| TWST | 25.0% | 79.7% | 0.71 | - |
| Sector ETF (XLV) | 12.8% | 16.8% | 0.63 | 34.7% |
| Equity (SPY) | 15.5% | 18.0% | 0.73 | 44.8% |
| Gold (GLD) | 11.5% | 16.6% | 0.57 | 13.8% |
| Commodities (DBC) | 7.4% | 18.2% | 0.33 | 8.9% |
| Real Estate (VNQ) | 6.1% | 20.7% | 0.25 | 33.6% |
| Bitcoin (BTCUSD) | 58.6% | 66.3% | 0.99 | 23.2% |
Smart multi-asset allocation framework can stack odds in your favor. Learn How
Earnings Returns History
Updated 11/12/2026| Forward Returns | |||
|---|---|---|---|
| Earnings Date | 1D Returns | 5D Returns | 21D Returns |
| 8/3/2026 | 10.4% | 26.3% | 51.8% |
| 5/4/2026 | -7.0% | -5.9% | 16.1% |
| 2/2/2026 | 14.0% | 19.9% | 13.6% |
| 11/14/2025 | -10.1% | -12.8% | 4.1% |
| 8/4/2025 | -10.3% | -23.9% | -22.1% |
| 5/5/2025 | -8.4% | -21.5% | -21.3% |
| 2/3/2025 | 0.7% | -0.1% | -24.2% |
| 11/18/2024 | 12.3% | 14.5% | 31.2% |
| ... | |||
| SUMMARY STATS | |||
| # Positive | 12 | 10 | 11 |
| # Negative | 12 | 14 | 13 |
| Median Positive | 11.6% | 12.4% | 25.1% |
| Median Negative | -9.3% | -13.3% | -18.5% |
| Max Positive | 28.7% | 35.0% | 81.2% |
| Max Negative | -20.1% | -23.9% | -46.6% |
| Forward Returns | |||
|---|---|---|---|
| Earnings Date | 1D Returns | 5D Returns | 21D Returns |
| 8/3/2026 | 10.4% | 26.3% | 51.8% |
| 5/4/2026 | -7.0% | -5.9% | 16.1% |
| 2/2/2026 | 14.0% | 19.9% | 13.6% |
| 11/14/2025 | -10.1% | -12.8% | 4.1% |
| 8/4/2025 | -10.3% | -23.9% | -22.1% |
| 5/5/2025 | -8.4% | -21.5% | -21.3% |
| 2/3/2025 | 0.7% | -0.1% | -24.2% |
| 11/18/2024 | 12.3% | 14.5% | 31.2% |
| 8/2/2024 | -19.0% | -14.4% | -18.5% |
| 5/2/2024 | 28.7% | 35.0% | 37.5% |
| 2/2/2024 | 10.0% | 9.8% | 15.0% |
| 11/17/2023 | 25.9% | 28.4% | 81.2% |
| 8/4/2023 | 11.2% | 10.3% | 14.0% |
| 5/5/2023 | -0.4% | -1.9% | 25.1% |
| 2/3/2023 | -18.1% | -20.2% | -39.0% |
| 11/18/2022 | -2.3% | 0.2% | -6.3% |
| 8/5/2022 | 12.7% | 4.8% | -17.2% |
| 5/5/2022 | 0.8% | -5.3% | -3.4% |
| 2/4/2022 | -2.4% | 1.1% | -21.8% |
| 11/22/2021 | -1.5% | -2.7% | -12.5% |
| 8/6/2021 | -10.8% | -13.8% | -7.6% |
| 5/6/2021 | 11.9% | -15.5% | -2.4% |
| 2/4/2021 | -20.1% | -16.3% | -46.6% |
| 11/23/2020 | 1.4% | -3.3% | 45.3% |
| SUMMARY STATS | |||
| # Positive | 12 | 10 | 11 |
| # Negative | 12 | 14 | 13 |
| Median Positive | 11.6% | 12.4% | 25.1% |
| Median Negative | -9.3% | -13.3% | -18.5% |
| Max Positive | 28.7% | 35.0% | 81.2% |
| Max Negative | -20.1% | -23.9% | -46.6% |
SEC Filings
Expand for More| Report Date | Filing Date | Filing |
|---|---|---|
| 06/30/2026 | 08/03/2026 | 10-Q |
| 03/31/2026 | 05/04/2026 | 10-Q |
| 12/31/2025 | 02/02/2026 | 10-Q |
| 09/30/2025 | 11/17/2025 | 10-K |
| 06/30/2025 | 08/04/2025 | 10-Q |
| 03/31/2025 | 05/05/2025 | 10-Q |
| 12/31/2024 | 02/03/2025 | 10-Q |
| 09/30/2024 | 11/18/2024 | 10-K |
| 06/30/2024 | 08/02/2024 | 10-Q |
| 03/31/2024 | 05/02/2024 | 10-Q |
| 12/31/2023 | 02/02/2024 | 10-Q |
| 09/30/2023 | 11/21/2023 | 10-K |
| 06/30/2023 | 08/07/2023 | 10-Q |
| 03/31/2023 | 05/08/2023 | 10-Q |
| 12/31/2022 | 02/07/2023 | 10-Q |
| 09/30/2022 | 11/28/2022 | 10-K |
| Report Date | Filing Date | Filing |
|---|---|---|
| 06/30/2026 | 08/03/2026 | 10-Q |
| 03/31/2026 | 05/04/2026 | 10-Q |
| 12/31/2025 | 02/02/2026 | 10-Q |
| 09/30/2025 | 11/17/2025 | 10-K |
| 06/30/2025 | 08/04/2025 | 10-Q |
| 03/31/2025 | 05/05/2025 | 10-Q |
| 12/31/2024 | 02/03/2025 | 10-Q |
| 09/30/2024 | 11/18/2024 | 10-K |
| 06/30/2024 | 08/02/2024 | 10-Q |
| 03/31/2024 | 05/02/2024 | 10-Q |
| 12/31/2023 | 02/02/2024 | 10-Q |
| 09/30/2023 | 11/21/2023 | 10-K |
| 06/30/2023 | 08/07/2023 | 10-Q |
| 03/31/2023 | 05/08/2023 | 10-Q |
| 12/31/2022 | 02/07/2023 | 10-Q |
| 09/30/2022 | 11/28/2022 | 10-K |
| 06/30/2022 | 08/08/2022 | 10-Q |
| 03/31/2022 | 05/06/2022 | 10-Q |
| 12/31/2021 | 02/09/2022 | 10-Q |
| 09/30/2021 | 11/23/2021 | 10-K |
| 06/30/2021 | 08/09/2021 | 10-Q |
| 03/31/2021 | 05/07/2021 | 10-Q |
| 12/31/2020 | 02/09/2021 | 10-Q |
| 09/30/2020 | 11/27/2020 | 10-K |
| 06/30/2020 | 08/12/2020 | 10-Q |
| 03/31/2020 | 05/13/2020 | 10-Q |
| 12/31/2019 | 02/10/2020 | 10-Q |
| 09/30/2019 | 12/13/2019 | 10-K |
Recent Forward Guidance
Updated 11/12/2026Latest: Q4 2026 Earnings Reported 11/12/2026
| Forward Guidance | Guidance Change | |||||||
|---|---|---|---|---|---|---|---|---|
| Metric | Source | Low | Mid | High | % Chg | % Delta | Change | Prior |
| Q1 2027 Revenue | Reported | 130.00 Mil | 131.00 Mil | 132.00 Mil | 6.1% | Higher New | Guidance: 123.50 Mil for Q4 2026 | |
| Q1 2027 Revenue Growth | Reported | 26.0% | 1.0% | Higher New | Guidance: 25.0% for Q4 2026 | |||
| 2027 Revenue | Reported | 550.00 Mil | 555.00 Mil | 560.00 Mil | 21.6% | Higher New | Guidance: 456.50 Mil for 2026 | |
| 2027 Revenue Growth | Reported | 21.0% | 0.0% | Same New | Guidance: 21.0% for 2026 | |||
| 2027 AI Drug Discovery Revenue | Reported | 100.00 Mil | ||||||
| 2027 Gross Margin | Reported | 52.5% | 52.75% | 53.0% | 0.8% | Higher New | Guidance: 52.0% for 2026 | |
| 2027 Adjusted EBITDA | Reported | |||||||
| 2027 Capital Expenditures | Reported | 75.00 Mil | ||||||
Prior: Q3 2026 Earnings Reported 8/3/2026
| Forward Guidance | Guidance Change | |||||||
|---|---|---|---|---|---|---|---|---|
| Metric | Source | Low | Mid | High | % Chg | % Delta | Change | Prior |
| Q4 2026 Revenue | Reported | 123.00 Mil | 123.50 Mil | 124.00 Mil | ||||
| Q4 2026 Revenue Growth | Reported | 25.0% | ||||||
| Q4 2026 Adjusted EBITDA | Reported | 0 | Affirmed | Guidance: 0 for Q4 2026 | ||||
| 2026 Revenue | Reported | 456.00 Mil | 456.50 Mil | 457.00 Mil | 2.7% | Raised | Guidance: 444.50 Mil for 2026 | |
| 2026 Revenue Growth | Reported | 21.0% | 3.0% | Raised | Guidance: 18.0% for 2026 | |||
| 2026 Gross Profit | Calculated | 237.12 Mil | 237.38 Mil | 237.64 Mil | Rev x Gross Margin | |||
| 2026 Gross Margin | Reported | 52.0% | 0 | Affirmed | Guidance: 52.0% for 2026 | |||
Q2 2026 Earnings Reported 5/4/2026
| Forward Guidance | Guidance Change | |||||||
|---|---|---|---|---|---|---|---|---|
| Metric | Source | Low | Mid | High | % Chg | % Delta | Change | Prior |
| Q3 2026 Revenue | Reported | 114.00 Mil | 114.50 Mil | 115.00 Mil | 6.5% | Higher New | Actual: 107.50 Mil for Q2 2026 | |
| Q3 2026 Revenue Growth | Reported | 19.0% | 3.0% | Higher New | Actual: 16.0% for Q2 2026 | |||
| Q4 2026 Adjusted EBITDA | Reported | 0 | ||||||
| 2026 Revenue | Reported | 442.00 Mil | 444.50 Mil | 447.00 Mil | 1.6% | Raised | Guidance: 437.50 Mil for 2026 | |
| 2026 Revenue Growth | Reported | 17.0% | 18.0% | 19.0% | 2.0% | Raised | Guidance: 16.0% for 2026 | |
| 2026 Gross Profit | Calculated | 229.84 Mil | 231.14 Mil | 232.44 Mil | Rev x Gross Margin | |||
| 2026 Gross Margin | Reported | 52.0% | 0 | Affirmed | Guidance: 52.0% for 2026 | |||
Q1 2026 Earnings Reported 2/2/2026
| Forward Guidance | Guidance Change | |||||||
|---|---|---|---|---|---|---|---|---|
| Metric | Source | Low | Mid | High | % Chg | % Delta | Change | Prior |
| Q2 2026 Revenue | Reported | 107.00 Mil | 107.50 Mil | 108.00 Mil | 7.0% | Higher New | Guidance: 100.50 Mil for Q1 2026 | |
| Q2 2026 Revenue Growth | Reported | 16.0% | ||||||
| 2026 Revenue | Reported | 435.00 Mil | 437.50 Mil | 440.00 Mil | 1.7% | Raised | Guidance: 430.00 Mil for 2026 | |
| 2026 Revenue Growth | Reported | 16.0% | 1.8% | Raised | Guidance: 14.25% for 2026 | |||
| 2026 Gross Profit | Calculated | 226.20 Mil | 227.50 Mil | 228.80 Mil | Rev x Gross Margin | |||
| 2026 Gross Margin | Reported | 52.0% | 0.0% | Affirmed | Guidance: 52.0% for 2026 | |||
Insider Activity
Updated 11/5/2026| # | Owner | Title | Holding | Action | Filing Date | Price | Shares | Transacted Value | Value of Held Shares | Form |
|---|---|---|---|---|---|---|---|---|---|---|
| 1 | Cho, Dennis | See Remarks | Direct | Sell | 11052026 | 135.40 | 949 | 128,496 | 8,508,662 | Form |
| 2 | Finn, Patrick John | President and COO | Direct | Sell | 11052026 | 135.40 | 2,565 | 347,306 | 24,410,002 | Form |
| 3 | Leproust, Emily M | Chief Executive Officer | Direct | Sell | 11052026 | 135.40 | 4,573 | 619,193 | 75,579,636 | Form |
| 4 | Werner, Robert F | Chief Accounting Officer | Direct | Sell | 11052026 | 135.40 | 148 | 20,039 | 5,791,008 | Form |
| 5 | Green, Paula | SVP of Human Resources | Direct | Sell | 11052026 | 135.40 | 1,007 | 136,350 | 14,301,836 | Form |
| # | Owner | Title | Holding | Action | Filing Date | Price | Shares | Transacted Value | Value of Held Shares | Form |
|---|---|---|---|---|---|---|---|---|---|---|
| 1 | Cho, Dennis | See Remarks | Direct | Sell | 11052026 | 135.40 | 949 | 128,496 | 8,508,662 | Form |
| 2 | Finn, Patrick John | President and COO | Direct | Sell | 11052026 | 135.40 | 2,565 | 347,306 | 24,410,002 | Form |
| 3 | Leproust, Emily M | Chief Executive Officer | Direct | Sell | 11052026 | 135.40 | 4,573 | 619,193 | 75,579,636 | Form |
| 4 | Werner, Robert F | Chief Accounting Officer | Direct | Sell | 11052026 | 135.40 | 148 | 20,039 | 5,791,008 | Form |
| 5 | Green, Paula | SVP of Human Resources | Direct | Sell | 11052026 | 135.40 | 1,007 | 136,350 | 14,301,836 | Form |
| 6 | Finn, Patrick John | President and COO | Direct | Sell | 10272026 | 134.59 | 2,245 | 302,152 | 24,608,657 | Form |
| 7 | Laponis, Adam | Chief Financial Officer | Direct | Sell | 10132026 | 156.30 | 2,462 | 384,823 | 15,335,699 | Form |
| 8 | Leproust, Emily M | Chief Executive Officer | Direct | Sell | 10072026 | 202.15 | 4,548 | 919,374 | 113,761,372 | Form |
| 9 | Laponis, Adam | Chief Financial Officer | Direct | Sell | 10052026 | 188.88 | 8,057 | 1,521,838 | 18,997,197 | Form |
| 10 | Green, Paula | SVP of Human Resources | Direct | Sell | 10052026 | 188.88 | 10,088 | 1,905,462 | 20,141,079 | Form |
| 11 | Finn, Patrick John | President and COO | Direct | Sell | 10052026 | 188.88 | 25,714 | 4,856,963 | 34,960,162 | Form |
| 12 | Leproust, Emily M | Chief Executive Officer | Direct | Sell | 10052026 | 188.88 | 45,736 | 8,638,799 | 107,155,404 | Form |
| 13 | Cho, Dennis | See Remarks | Direct | Sell | 10052026 | 188.88 | 9,514 | 1,797,042 | 12,048,721 | Form |
| 14 | Werner, Robert F | Chief Accounting Officer | Direct | Sell | 10052026 | 188.88 | 1,482 | 279,926 | 8,106,335 | Form |
| 15 | Leproust, Emily M | Chief Executive Officer | Direct | Sell | 10052026 | 200.00 | 655 | 131,000 | 122,608,800 | Form |
| 16 | Leproust, Emily M | Chief Executive Officer | Direct | Sell | 9252026 | 177.38 | 5,203 | 922,907 | 108,857,740 | Form |
| 17 | Cho, Dennis | See Remarks | Direct | Sell | 9232026 | 165.49 | 348 | 57,591 | 12,130,987 | Form |
| 18 | Green, Paula | SVP of Human Resources | Direct | Sell | 9232026 | 165.49 | 294 | 48,654 | 19,316,110 | Form |
| 19 | Leproust, Emily M | Chief Executive Officer | Direct | Sell | 9232026 | 165.49 | 1,687 | 279,183 | 102,422,711 | Form |
| 20 | Leproust, Emily M | Chief Executive Officer | Direct | Sell | 9212026 | 157.99 | 356,546 | 56,330,724 | 98,046,894 | Form |
| 21 | Cho, Dennis | See Remarks | Direct | Sell | 9102026 | 122.62 | 412 | 50,521 | 9,031,380 | Form |
| 22 | Green, Paula | SVP of Human Resources | Direct | Sell | 9102026 | 122.62 | 907 | 111,220 | 14,348,725 | Form |
| 23 | Leproust, Emily M | Chief Executive Officer | Direct | Sell | 9102026 | 122.62 | 2,302 | 282,280 | 94,227,592 | Form |
| 24 | Werner, Robert F | Chief Accounting Officer | Direct | Sell | 9102026 | 122.62 | 238 | 29,185 | 5,444,383 | Form |
| 25 | Leproust, Emily M | Chief Executive Officer | Direct | Sell | 8272026 | 151.98 | 41,570 | 6,317,760 | 117,134,483 | Form |
| 26 | Werner, Robert F | Chief Accounting Officer | Direct | Sell | 8252026 | 140.77 | 854 | 120,220 | 6,283,684 | Form |
| 27 | Cho, Dennis | See Remarks | Direct | Sell | 8252026 | 139.07 | 1,598 | 222,227 | 10,299,645 | Form |
| 28 | Finn, Patrick John | President and COO | Direct | Sell | 8252026 | 139.07 | 4,046 | 562,661 | 29,315,391 | Form |
| 29 | Green, Paula | SVP of Human Resources | Direct | Sell | 8252026 | 139.07 | 1,360 | 189,130 | 16,398,802 | Form |
| 30 | Laponis, Adam | Chief Financial Officer | Direct | Sell | 8252026 | 139.07 | 1,965 | 273,265 | 15,107,157 | Form |
| 31 | Leproust, Emily M | Chief Executive Officer | Direct | Sell | 8252026 | 139.07 | 6,639 | 923,259 | 112,963,173 | Form |
| 32 | Werner, Robert F | Chief Accounting Officer | Direct | Sell | 8252026 | 139.07 | 669 | 93,035 | 6,326,251 | Form |
| 33 | Cho, Dennis | See Remarks | Direct | Sell | 8212026 | 129.75 | 14,205 | 1,843,099 | 9,817,015 | Form |
| 34 | Finn, Patrick John | President and COO | Direct | Sell | 8202026 | 117.64 | 78,355 | 9,217,607 | 25,254,513 | Form |
| 35 | Blake, Katryn | Direct | Sell | 8142026 | 122.88 | 2,240 | 275,251 | 2,114,519 | Form | |
| 36 | Leproust, Emily M | Chief Executive Officer | Direct | Sell | 8142026 | 125.08 | 19,952 | 2,495,508 | 102,429,162 | Form |
| 37 | Leproust, Emily M | Chief Executive Officer | Direct | Sell | 8122026 | 125.16 | 113,318 | 14,183,051 | 102,499,508 | Form |
| 38 | Chess, Robert | Direct | Sell | 8112026 | 110.89 | 18,417 | 2,042,261 | 2,338,005 | Form | |
| 39 | Cho, Dennis | See Remarks | Direct | Sell | 8072026 | 109.75 | 14,205 | 1,558,999 | 9,862,794 | Form |
| 40 | Finn, Patrick John | President and COO | Direct | Sell | 8052026 | 85.32 | 2,888 | 246,408 | 23,009,251 | Form |
| 41 | Green, Paula | SVP of Human Resources | Direct | Sell | 8052026 | 85.32 | 1,133 | 96,669 | 10,177,198 | Form |
| 42 | Leproust, Emily M | Chief Executive Officer | Direct | Sell | 8052026 | 85.32 | 5,101 | 435,223 | 69,872,773 | Form |
| 43 | Werner, Robert F | Chief Accounting Officer | Direct | Sell | 8052026 | 85.32 | 167 | 14,249 | 3,938,427 | Form |
| 44 | Cho, Dennis | See Remarks | Direct | Sell | 8052026 | 85.32 | 1,070 | 91,294 | 8,879,463 | Form |
| 45 | Finn, Patrick John | President and COO | Direct | Sell | 7272026 | 93.89 | 2,238 | 210,133 | 25,592,039 | Form |
| 46 | Laponis, Adam | Chief Financial Officer | Direct | Sell | 7132026 | 94.33 | 2,399 | 226,307 | 10,402,776 | Form |
| 47 | Cho, Dennis | See Remarks | Direct | Sell | 6262026 | 89.75 | 14,205 | 1,274,899 | 9,436,405 | Form |
| 48 | Green, Paula | SVP of Human Resources | Direct | Sell | 6242026 | 87.32 | 291 | 25,411 | 10,514,839 | Form |
| 49 | Cho, Dennis | See Remarks | Direct | Sell | 6242026 | 87.32 | 346 | 30,214 | 10,421,579 | Form |
| 50 | Leproust, Emily M | Chief Executive Officer | Direct | Sell | 6242026 | 87.32 | 1,688 | 147,400 | 73,605,710 | Form |
| 51 | Green, Paula | SVP of Human Resources | Direct | Sell | 6172026 | 81.67 | 26,137 | 2,134,488 | 9,857,418 | Form |
| 52 | Cho, Dennis | See Remarks | Direct | Sell | 6102026 | 69.84 | 402 | 28,077 | 8,359,792 | Form |
| 53 | Green, Paula | SVP of Human Resources | Direct | Sell | 6102026 | 69.84 | 884 | 61,742 | 8,430,544 | Form |
| 54 | Leproust, Emily M | Chief Executive Officer | Direct | Sell | 6102026 | 69.84 | 2,265 | 158,197 | 58,990,900 | Form |
| 55 | Werner, Robert F | Chief Accounting Officer | Direct | Sell | 6102026 | 69.20 | 1,359 | 94,046 | 3,240,530 | Form |
| 56 | Cho, Dennis | See Remarks | Direct | Sell | 6022026 | 69.75 | 14,205 | 990,799 | 8,376,556 | Form |
| 57 | Laponis, Adam | Chief Financial Officer | Direct | Sell | 6022026 | 70.00 | 4,000 | 280,000 | 7,887,250 | Form |
| 58 | Leproust, Emily M | Chief Executive Officer | Direct | Sell | 6012026 | 67.91 | 16,470 | 1,118,555 | 57,515,030 | Form |
| 59 | Starovasnik, Melissa A | Direct | Sell | 6012026 | 68.00 | 2,500 | 170,000 | 1,511,096 | Form | |
| 60 | Leproust, Emily M | Chief Executive Officer | Direct | Sell | 5282026 | 65.29 | 25,017 | 1,633,407 | 55,293,877 | Form |
| 61 | Starovasnik, Melissa A | Direct | Sell | 5282026 | 61.04 | 500 | 30,520 | 1,509,031 | Form | |
| 62 | Leproust, Emily M | Chief Executive Officer | Direct | Sell | 5282026 | 65.08 | 24,282 | 1,580,246 | 55,113,498 | Form |
| 63 | Werner, Robert F | Chief Accounting Officer | Direct | Sell | 5282026 | 62.48 | 800 | 49,987 | 3,010,854 | Form |
| 64 | Green, Paula | SVP of Human Resources | Direct | Sell | 5262026 | 53.26 | 1,399 | 74,507 | 6,475,465 | Form |
| 65 | Finn, Patrick John | President and COO | Direct | Sell | 5262026 | 53.26 | 4,160 | 221,549 | 14,635,237 | Form |
| 66 | Cho, Dennis | See Remarks | Direct | Sell | 5262026 | 53.26 | 1,642 | 87,448 | 7,152,362 | Form |
| 67 | Werner, Robert F | Chief Accounting Officer | Direct | Sell | 5262026 | 53.26 | 688 | 36,641 | 2,608,847 | Form |
| 68 | Leproust, Emily M | Chief Executive Officer | Direct | Sell | 5262026 | 53.26 | 6,888 | 366,834 | 45,101,862 | Form |
| 69 | Laponis, Adam | Chief Financial Officer | Direct | Sell | 5262026 | 53.26 | 2,019 | 107,526 | 6,213,760 | Form |
| 70 | Johannessen, Jan | Direct | Sell | 5142026 | 56.12 | 12,000 | 673,440 | 996,354 | Form | |
| 71 | Werner, Robert F | Chief Accounting Officer | Direct | Sell | 5122026 | 56.88 | 4,961 | 282,187 | 2,825,507 | Form |
| 72 | Cho, Dennis | See Remarks | Direct | Sell | 5062026 | 57.15 | 1,962 | 112,126 | 7,768,865 | Form |
| 73 | Leproust, Emily M | Chief Executive Officer | Direct | Sell | 5062026 | 57.15 | 5,127 | 293,002 | 48,791,359 | Form |
| 74 | Finn, Patrick John | President and COO | Direct | Sell | 5062026 | 57.15 | 2,844 | 162,531 | 15,942,458 | Form |
| 75 | Green, Paula | SVP of Human Resources | Direct | Sell | 5062026 | 57.15 | 1,116 | 63,778 | 7,028,617 | Form |
| 76 | Werner, Robert F | Chief Accounting Officer | Direct | Sell | 5062026 | 57.15 | 164 | 9,372 | 3,122,325 | Form |
| 77 | Starovasnik, Melissa A | Direct | Sell | 4292026 | 61.83 | 500 | 30,915 | 1,559,476 | Form | |
| 78 | Finn, Patrick John | President and COO | Direct | Sell | 4272026 | 60.76 | 2,321 | 141,026 | 17,122,936 | Form |
| 79 | Leproust, Emily M | Chief Executive Officer | Direct | Sell | 4232026 | 65.29 | 8,061 | 526,291 | 56,075,513 | Form |
| 80 | Leproust, Emily M | Chief Executive Officer | Direct | Sell | 4232026 | 65.01 | 1,610 | 104,666 | 55,836,244 | Form |
| 81 | Laponis, Adam | Chief Financial Officer | Direct | Sell | 4212026 | 60.00 | 4,000 | 240,000 | 7,121,640 | Form |
| 82 | Laponis, Adam | Chief Financial Officer | Direct | Sell | 4162026 | 55.00 | 3,000 | 165,000 | 6,748,170 | Form |
| 83 | Laponis, Adam | Chief Financial Officer | Direct | Sell | 4132026 | 49.89 | 2,597 | 129,562 | 6,270,748 | Form |
| 84 | Starovasnik, Melissa A | Direct | Sell | 4032026 | 51.00 | 1,000 | 51,000 | 1,311,822 | Form | |
| 85 | Cho, Dennis | See Remarks | Direct | Sell | 3242026 | 43.79 | 354 | 15,500 | 6,038,276 | Form |
| 86 | Green, Paula | SVP of Human Resources | Direct | Sell | 3242026 | 43.79 | 297 | 13,005 | 5,434,067 | Form |
| 87 | Leproust, Emily M | Chief Executive Officer | Direct | Sell | 3242026 | 43.79 | 1,742 | 76,276 | 37,607,570 | Form |
| 88 | Chess, Robert | Direct | Sell | 3192026 | 47.00 | 10,000 | 470,000 | 990,948 | Form | |
| 89 | Werner, Robert F | Chief Accounting Officer | Direct | Sell | 3102026 | 46.43 | 246 | 11,421 | 2,544,098 | Form |
| 90 | Cho, Dennis | See Remarks | Direct | Sell | 3102026 | 46.43 | 425 | 19,731 | 6,418,719 | Form |
| 91 | Green, Paula | SVP of Human Resources | Direct | Sell | 3102026 | 46.43 | 935 | 43,408 | 5,775,441 | Form |
| 92 | Leproust, Emily M | Chief Executive Officer | Direct | Sell | 3102026 | 46.43 | 2,423 | 112,490 | 39,955,562 | Form |
| 93 | Finn, Patrick John | President and COO | Direct | Sell | 2252026 | 46.71 | 4,294 | 200,572 | 13,271,609 | Form |
| 94 | Werner, Robert F | Chief Accounting Officer | Direct | Sell | 2252026 | 46.71 | 1,693 | 79,080 | 2,571,141 | Form |
| 95 | Laponis, Adam | Chief Financial Officer | Direct | Sell | 2252026 | 46.71 | 2,085 | 97,390 | 5,992,447 | Form |
| 96 | Leproust, Emily M | Chief Executive Officer | Direct | Sell | 2252026 | 46.71 | 7,205 | 336,544 | 40,312,986 | Form |
| 97 | Green, Paula | SVP of Human Resources | Direct | Sell | 2252026 | 46.71 | 1,465 | 68,430 | 5,854,419 | Form |
| 98 | Cho, Dennis | See Remarks | Direct | Sell | 2252026 | 46.71 | 844 | 39,423 | 6,477,808 | Form |
| 99 | Chess, Robert | Direct | Sell | 2182026 | 48.26 | 2,184 | 105,402 | 1,017,535 | Form | |
| 100 | Finn, Patrick John | President and COO | Direct | Sell | 2172026 | 50.04 | 1,750 | 87,572 | 15,325,056 | Form |
| 101 | Finn, Patrick John | President and COO | Direct | Sell | 2172026 | 50.23 | 3,500 | 175,788 | 15,408,427 | Form |
| 102 | Laponis, Adam | Chief Financial Officer | Direct | Sell | 2132026 | 50.00 | 7,000 | 350,000 | 6,501,550 | Form |
| 103 | Cho, Dennis | See Remarks | Direct | Sell | 2132026 | 49.93 | 5,000 | 249,650 | 6,919,349 | Form |
| 104 | Johannessen, Jan | Direct | Sell | 2092026 | 47.91 | 2,200 | 105,395 | 850,536 | Form | |
| 105 | Werner, Robert F | Chief Accounting Officer | Direct | Sell | 2052026 | 45.65 | 7,000 | 319,536 | 2,681,272 | Form |
| 106 | Finn, Patrick John | President and COO | Direct | Sell | 2052026 | 46.58 | 2,705 | 125,988 | 14,335,534 | Form |
| 107 | Leproust, Emily M | Chief Executive Officer | Direct | Sell | 2052026 | 46.58 | 5,001 | 232,927 | 40,489,076 | Form |
| 108 | Werner, Robert F | Chief Accounting Officer | Direct | Sell | 2052026 | 46.58 | 175 | 8,151 | 3,061,813 | Form |
| 109 | Green, Paula | SVP of Human Resources | Direct | Sell | 2052026 | 46.58 | 1,194 | 55,612 | 7,705,766 | Form |
| 110 | Cho, Dennis | See Remarks | Direct | Sell | 2052026 | 46.58 | 1,099 | 51,187 | 6,687,429 | Form |
| 111 | Finn, Patrick John | President and COO | Direct | Sell | 1272026 | 44.91 | 2,390 | 107,330 | 13,943,620 | Form |
| 112 | Laponis, Adam | Chief Financial Officer | Direct | Sell | 1132026 | 35.26 | 2,738 | 96,545 | 4,937,633 | Form |
| 113 | Green, Paula | SVP of Human Resources | Direct | Sell | 12232025 | 34.56 | 273 | 9,434 | 5,758,377 | Form |
| 114 | Cho, Dennis | See Remarks | Direct | Sell | 12232025 | 34.56 | 324 | 11,196 | 4,999,562 | Form |
| 115 | Leproust, Emily M | Chief Executive Officer | Direct | Sell | 12232025 | 34.56 | 1,605 | 55,462 | 30,212,760 | Form |
| 116 | Cho, Dennis | See Remarks | Direct | Sell | 12102025 | 32.88 | 398 | 13,085 | 4,767,442 | Form |
| 117 | Leproust, Emily M | Chief Executive Officer | Direct | Sell | 12102025 | 32.88 | 2,255 | 74,140 | 28,798,432 | Form |
| 118 | Green, Paula | SVP of Human Resources | Direct | Sell | 12102025 | 32.88 | 877 | 28,834 | 5,487,733 | Form |
| 119 | Werner, Robert F | Chief Accounting Officer | Direct | Sell | 12102025 | 32.88 | 230 | 7,562 | 2,167,088 | Form |
| 120 | Werner, Robert F | Chief Accounting Officer | Direct | Sell | 11252025 | 28.71 | 822 | 23,599 | 1,898,932 | Form |
| 121 | Cho, Dennis | See Remarks | Direct | Sell | 11252025 | 26.50 | 757 | 20,063 | 3,853,662 | Form |
| 122 | Finn, Patrick John | President and COO | Direct | Sell | 11252025 | 26.50 | 1,776 | 47,070 | 8,822,565 | Form |
| 123 | Green, Paula | SVP of Human Resources | Direct | Sell | 11252025 | 26.50 | 598 | 15,849 | 4,446,996 | Form |
| 124 | Laponis, Adam | Chief Financial Officer | Direct | Sell | 11252025 | 26.50 | 887 | 23,509 | 3,783,878 | Form |
| 125 | Leproust, Emily M | Chief Executive Officer | Direct | Sell | 11252025 | 26.50 | 2,663 | 70,579 | 23,274,658 | Form |
| 126 | Werner, Robert F | Chief Accounting Officer | Direct | Sell | 11252025 | 26.50 | 229 | 6,069 | 1,774,807 | Form |
| 127 | Johannessen, Jan | Direct | Sell | 11202025 | 24.77 | 7,044 | 174,480 | 368,057 | Form | |
| 128 | Cho, Dennis | See Remarks | Direct | Sell | 11052025 | 32.08 | 1,019 | 32,689 | 3,871,791 | Form |
| 129 | Finn, Patrick John | President and COO | Direct | Sell | 11052025 | 32.08 | 2,755 | 88,379 | 8,530,522 | Form |
| 130 | Green, Paula | SVP of Human Resources | Direct | Sell | 11052025 | 32.08 | 1,084 | 34,774 | 4,561,274 | Form |
| 131 | Leproust, Emily M | Chief Executive Officer | Direct | Sell | 11052025 | 32.08 | 4,887 | 156,772 | 23,543,777 | Form |
| 132 | Werner, Robert F | Chief Accounting Officer | Direct | Sell | 11052025 | 32.08 | 160 | 5,133 | 1,631,879 | Form |
| 133 | Cho, Dennis | See Remarks | Direct | Sell | 11032025 | 31.44 | 6,515 | 204,860 | 3,827,180 | Form |
| 134 | Finn, Patrick John | President and COO | Direct | Sell | 11032025 | 31.44 | 17,606 | 553,608 | 8,448,266 | Form |
| 135 | Green, Paula | SVP of Human Resources | Direct | Sell | 11032025 | 31.44 | 6,920 | 217,595 | 4,505,056 | Form |
| 136 | Leproust, Emily M | Chief Executive Officer | Direct | Sell | 11032025 | 31.44 | 31,379 | 986,691 | 23,231,332 | Form |
| 137 | Laponis, Adam | Chief Financial Officer | Direct | Sell | 11032025 | 31.44 | 5,517 | 173,478 | 3,490,569 | Form |
| 138 | Werner, Robert F | Chief Accounting Officer | Direct | Sell | 11032025 | 31.44 | 1,016 | 31,947 | 1,604,603 | Form |
Investor Activity (13F)
Updated Nov 12, 2026Active managers (13F portfolio over $250M, at least 3 holdings) with a position over $5M that is either over 10% of their portfolio or held in a concentrated book of 50 or fewer total positions. Index/ETF, sovereign, bank, community-bank and charitable/donor-advised filers are excluded.
| Active Manager |
|---|
Twist Bioscience — Investor Video Playlist




Industry Resources
External Quote Links
| Y Finance | Barrons |
| TradingView | Morningstar |
| SeekingAlpha | ValueLine |
| Motley Fool | Robinhood |
| CNBC | Etrade |
| MarketWatch | Unusual Whales |
| YCharts | Perplexity Finance |
| FinViz |
Prefer one of these to Trefis? Tell us why.