
Agilent Technologies (A)
Market Price (9/13/2026): $146.76 | Market Cap: $41.4 BilInvestor Relations Sector: Health Care | Industry: Life Sciences Tools & Services
Agilent Technologies (A)
Market Price (9/13/2026): $146.76Market Cap: $41.4 BilSector: Health CareIndustry: Life Sciences Tools & Services
Investment Highlights Why It Matters Detailed financial logic regarding cash flow yields vs trend-riding momentum.
Attractive operating marginsOp Mgn LTMOperating Margin = Operating Income / Revenue Reflects profitability before taxes and before impact of capital structure (interest payments). is 22% Attractive cash flow generationCFO/Rev LTMCash Flow from Operations / Revenue (Sales), Last Twelve Months (LTM) is 22%, FCF/Rev LTMFree Cash Flow / Revenue (Sales), Last Twelve Months (LTM) is 17% Stock buyback supportStock Buyback 3Y Total is 1.9 Bil Low stock price volatilityVol 12M is 33% Megatrend and thematic driversMegatrends include Biotechnology & Genomics, and Precision Medicine. Themes include Advanced Diagnostics, Personalized Diagnostics, Show more. | Weak multi-year price returns2Y Excs Rtn is -33%, 3Y Excs Rtn is -44% | Expensive valuation multiplesP/EBITPrice/EBIT or Price/(Operating Income) ratio is 23x, P/CFOPrice/(Cash Flow from Operations). CFO is cash before capital expenditures. is 26x, P/EPrice/Earnings or Price/(Net Income) is 29x Key risksA key risks include [1] significant revenue exposure (~19%) to geopolitical and trade tensions with China, Show more. |
| Attractive operating marginsOp Mgn LTMOperating Margin = Operating Income / Revenue Reflects profitability before taxes and before impact of capital structure (interest payments). is 22% |
| Attractive cash flow generationCFO/Rev LTMCash Flow from Operations / Revenue (Sales), Last Twelve Months (LTM) is 22%, FCF/Rev LTMFree Cash Flow / Revenue (Sales), Last Twelve Months (LTM) is 17% |
| Stock buyback supportStock Buyback 3Y Total is 1.9 Bil |
| Low stock price volatilityVol 12M is 33% |
| Megatrend and thematic driversMegatrends include Biotechnology & Genomics, and Precision Medicine. Themes include Advanced Diagnostics, Personalized Diagnostics, Show more. |
| Weak multi-year price returns2Y Excs Rtn is -33%, 3Y Excs Rtn is -44% |
| Expensive valuation multiplesP/EBITPrice/EBIT or Price/(Operating Income) ratio is 23x, P/CFOPrice/(Cash Flow from Operations). CFO is cash before capital expenditures. is 26x, P/EPrice/Earnings or Price/(Net Income) is 29x |
| Key risksA key risks include [1] significant revenue exposure (~19%) to geopolitical and trade tensions with China, Show more. |
Qualitative Assessment
AI Analysis | Feedback
Agilent Technologies (A) stock has gained about 10% since 5/31/2026 because of the following key factors:
1. Strong Fiscal Q2 2026 Earnings Beat and Upgraded Guidance. Agilent Technologies reported robust financial results for its fiscal Q2 2026 (ended April 30, 2026) on May 27, 2026, just prior to the specified period. The company delivered revenue of $1.83 billion, reflecting a 10% reported growth and 6.3% core growth year-over-year, which surpassed its own guidance. Non-GAAP earnings per share (EPS) reached $1.49, increasing 14% year-over-year and exceeding consensus estimates by $0.08. Furthermore, Agilent raised its full-year fiscal 2026 revenue guidance to a range of $7.39 billion to $7.49 billion and increased its non-GAAP EPS outlook to $6.00 to $6.10 per share, signaling strong operational momentum. This positive announcement led to an approximate 17% surge in Agilent's shares the following day, setting a strong upward trajectory for the stock as the analysis period began.
2. Excellent Fiscal Q3 2026 Earnings Beat and Further Raised Outlook. Building on its prior performance, Agilent reported strong fiscal Q3 2026 (ended July 31, 2026) financial results on August 26, 2026. The company posted an EPS of $1.62, which notably exceeded analysts' consensus estimates of $1.49 by $0.13. Quarterly revenue climbed 8.1% year-over-year to $1.88 billion, also surpassing analyst expectations of $1.84 billion. Following these impressive results, Agilent further increased its full-year fiscal 2026 revenue guidance to a range of $7.49 billion to $7.51 billion and raised its adjusted EPS guidance to $6.12 to $6.15 per share. This continuous overperformance and optimistic outlook were core drivers of the stock's upward movement during the period.
Show more
Agilent Technologies (A) stock has gained about 10% since 5/31/2026 because of the following key factors:
1. Strong Fiscal Q2 2026 Earnings Beat and Upgraded Guidance. Agilent Technologies reported robust financial results for its fiscal Q2 2026 (ended April 30, 2026) on May 27, 2026, just prior to the specified period. The company delivered revenue of $1.83 billion, reflecting a 10% reported growth and 6.3% core growth year-over-year, which surpassed its own guidance. Non-GAAP earnings per share (EPS) reached $1.49, increasing 14% year-over-year and exceeding consensus estimates by $0.08. Furthermore, Agilent raised its full-year fiscal 2026 revenue guidance to a range of $7.39 billion to $7.49 billion and increased its non-GAAP EPS outlook to $6.00 to $6.10 per share, signaling strong operational momentum. This positive announcement led to an approximate 17% surge in Agilent's shares the following day, setting a strong upward trajectory for the stock as the analysis period began.
2. Excellent Fiscal Q3 2026 Earnings Beat and Further Raised Outlook. Building on its prior performance, Agilent reported strong fiscal Q3 2026 (ended July 31, 2026) financial results on August 26, 2026. The company posted an EPS of $1.62, which notably exceeded analysts' consensus estimates of $1.49 by $0.13. Quarterly revenue climbed 8.1% year-over-year to $1.88 billion, also surpassing analyst expectations of $1.84 billion. Following these impressive results, Agilent further increased its full-year fiscal 2026 revenue guidance to a range of $7.49 billion to $7.51 billion and raised its adjusted EPS guidance to $6.12 to $6.15 per share. This continuous overperformance and optimistic outlook were core drivers of the stock's upward movement during the period.
3. Positive Analyst Sentiment and Increased Price Targets. Throughout the period, Agilent Technologies maintained a "Moderate Buy" consensus rating from Wall Street analysts. This positive sentiment was reinforced by several analysts issuing increased price targets, with an average forecast ranging from $170.33 to $175.45. For instance, the stock received a Zacks Rank #2 (Buy) upgrade on September 7, 2026. This consistent confidence from the analyst community, reflecting a belief in the company's strong financial performance and future prospects, contributed to the stock's appreciation.
4. Strategic Product Innovations and AI Partnerships. Agilent continued to demonstrate its commitment to innovation and market expansion by introducing new products and forming strategic alliances. The company showcased its latest mass spectrometry and chromatography innovations at the ASMS Conference from May 31 to June 4, 2026. Additionally, Agilent expanded its digital pathology offerings with the U.S. launch of the Agilent S540MD Slide Scanner System on September 4, 2026, and introduced the Cary 635 FTIR Spectrometer on September 1, 2026. A significant strategic move was the partnership with OpenAI and Boston Consulting Group (BCG) announced in June 2026, aimed at advancing artificial intelligence integration into lab workflows, signaling future growth potential in the life sciences sector.
Show less
Stock Movement Drivers
Fundamental Drivers
The 8.6% change in A stock from 5/31/2026 to 9/12/2026 was primarily driven by a 7.0% change in the company's Net Income Margin (%).| (LTM values as of) | 5312026 | 9122026 | Change |
|---|---|---|---|
| Stock Price ($) | 135.27 | 146.93 | 8.6% |
| Change Contribution By: | |||
| Total Revenues ($ Mil) | 7,065 | 7,372 | 4.3% |
| Net Income Margin (%) | 18.3% | 19.5% | 7.0% |
| P/E Multiple | 29.7 | 28.8 | -3.0% |
| Shares Outstanding (Mil) | 283 | 282 | 0.4% |
| Cumulative Contribution | 8.6% |
Market Drivers
5/31/2026 to 9/12/2026| Return | Correlation | |
|---|---|---|
| A | 8.6% | |
| Market (SPY) | 1.0% | 21.5% |
| Sector (XLV) | 10.6% | 37.4% |
Fundamental Drivers
The 21.6% change in A stock from 2/28/2026 to 9/12/2026 was primarily driven by a 10.4% change in the company's P/E Multiple.| (LTM values as of) | 2282026 | 9122026 | Change |
|---|---|---|---|
| Stock Price ($) | 120.87 | 146.93 | 21.6% |
| Change Contribution By: | |||
| Total Revenues ($ Mil) | 6,948 | 7,372 | 6.1% |
| Net Income Margin (%) | 18.8% | 19.5% | 4.2% |
| P/E Multiple | 26.1 | 28.8 | 10.4% |
| Shares Outstanding (Mil) | 281 | 282 | -0.4% |
| Cumulative Contribution | 21.6% |
Market Drivers
2/28/2026 to 9/12/2026| Return | Correlation | |
|---|---|---|
| A | 21.6% | |
| Market (SPY) | 11.7% | 29.7% |
| Sector (XLV) | 3.6% | 39.9% |
Fundamental Drivers
The 17.9% change in A stock from 8/31/2025 to 9/12/2026 was primarily driven by a 8.7% change in the company's Net Income Margin (%).| (LTM values as of) | 8312025 | 9122026 | Change |
|---|---|---|---|
| Stock Price ($) | 124.66 | 146.93 | 17.9% |
| Change Contribution By: | |||
| Total Revenues ($ Mil) | 6,788 | 7,372 | 8.6% |
| Net Income Margin (%) | 18.0% | 19.5% | 8.7% |
| P/E Multiple | 29.0 | 28.8 | -0.8% |
| Shares Outstanding (Mil) | 284 | 282 | 0.7% |
| Cumulative Contribution | 17.9% |
Market Drivers
8/31/2025 to 9/12/2026| Return | Correlation | |
|---|---|---|
| A | 17.9% | |
| Market (SPY) | 19.5% | 34.6% |
| Sector (XLV) | 21.9% | 49.2% |
Fundamental Drivers
The 24.2% change in A stock from 8/31/2023 to 9/12/2026 was primarily driven by a 20.6% change in the company's Net Income Margin (%).| (LTM values as of) | 8312023 | 9122026 | Change |
|---|---|---|---|
| Stock Price ($) | 118.34 | 146.93 | 24.2% |
| Change Contribution By: | |||
| Total Revenues ($ Mil) | 6,994 | 7,372 | 5.4% |
| Net Income Margin (%) | 16.2% | 19.5% | 20.6% |
| P/E Multiple | 30.7 | 28.8 | -6.3% |
| Shares Outstanding (Mil) | 294 | 282 | 4.3% |
| Cumulative Contribution | 24.2% |
Market Drivers
8/31/2023 to 9/12/2026| Return | Correlation | |
|---|---|---|
| A | 24.2% | |
| Market (SPY) | 75.7% | 47.8% |
| Sector (XLV) | 30.0% | 54.0% |
Price Returns Compared
| 2021 | 2022 | 2023 | 2024 | 2025 | 2026 | Total [1] | |
|---|---|---|---|---|---|---|---|
| Returns | |||||||
| A Return | 36% | -6% | -6% | -3% | 2% | 6% | 26% |
| Peers Return | 39% | -21% | -11% | 2% | 5% | 9% | 14% |
| S&P 500 Return | 27% | -19% | 24% | 23% | 16% | 11% | 102% |
Monthly Win Rates [3] | |||||||
| A Win Rate | 83% | 42% | 42% | 50% | 58% | 44% | |
| Peers Win Rate | 77% | 35% | 43% | 47% | 47% | 47% | |
| S&P 500 Win Rate | 75% | 42% | 67% | 75% | 67% | 44% | |
Max Drawdowns [4] | |||||||
| A Max Drawdown | -17% | -29% | -36% | -19% | -35% | -26% | |
| Peers Max Drawdown | -21% | -35% | -37% | -23% | -36% | -30% | |
| S&P 500 Max Drawdown | -5% | -25% | -10% | -8% | -19% | -9% | |
[1] Cumulative total returns since the beginning of 2021
[2] Peers: TMO, DHR, WAT, MTD, ILMN. See A Returns vs. Peers.
[3] Win Rate = % of calendar months in which monthly returns were positive
[4] Max drawdown represents maximum peak-to-trough decline within a year
[5] 2026 data is for the year up to 9/11/2026 (YTD)
How Low Can It Go
| Event | A | S&P 500 |
|---|---|---|
| 2025 US Tariff Shock | ||
| % Loss | -27.5% | -18.8% |
| % Gain to Breakeven | 37.8% | 23.1% |
| Time to Breakeven | 176 days | 79 days |
| Summer-Fall 2023 Five Percent Yield Shock | ||
| % Loss | -20.4% | -9.5% |
| % Gain to Breakeven | 25.6% | 10.5% |
| Time to Breakeven | 30 days | 24 days |
| 2023 SVB Regional Banking Crisis | ||
| % Loss | -25.7% | -6.7% |
| % Gain to Breakeven | 34.6% | 7.1% |
| Time to Breakeven | 342 days | 31 days |
| 2022 Inflation Shock & Fed Tightening | ||
| % Loss | -27.9% | -24.5% |
| % Gain to Breakeven | 38.6% | 32.4% |
| Time to Breakeven | 158 days | 427 days |
| 2020 COVID-19 Crash | ||
| % Loss | -25.8% | -33.7% |
| % Gain to Breakeven | 34.7% | 50.9% |
| Time to Breakeven | 64 days | 140 days |
| Q4 2018 Fed Policy Error / Growth Scare | ||
| % Loss | -15.2% | -19.2% |
| % Gain to Breakeven | 18.0% | 23.8% |
| Time to Breakeven | 37 days | 105 days |
In The Past
Agilent Technologies's stock fell -27.5% during the 2025 US Tariff Shock. Such a loss loss requires a 37.8% gain to breakeven.
Preserve Wealth
Limiting losses and compounding gains is essential to preserving wealth.
Asset Allocation
Actively managed asset allocation strategies protect wealth. Learn more.
| Event | A | S&P 500 |
|---|---|---|
| 2025 US Tariff Shock | ||
| % Loss | -27.5% | -18.8% |
| % Gain to Breakeven | 37.8% | 23.1% |
| Time to Breakeven | 176 days | 79 days |
| Summer-Fall 2023 Five Percent Yield Shock | ||
| % Loss | -20.4% | -9.5% |
| % Gain to Breakeven | 25.6% | 10.5% |
| Time to Breakeven | 30 days | 24 days |
| 2023 SVB Regional Banking Crisis | ||
| % Loss | -25.7% | -6.7% |
| % Gain to Breakeven | 34.6% | 7.1% |
| Time to Breakeven | 342 days | 31 days |
| 2022 Inflation Shock & Fed Tightening | ||
| % Loss | -27.9% | -24.5% |
| % Gain to Breakeven | 38.6% | 32.4% |
| Time to Breakeven | 158 days | 427 days |
| 2020 COVID-19 Crash | ||
| % Loss | -25.8% | -33.7% |
| % Gain to Breakeven | 34.7% | 50.9% |
| Time to Breakeven | 64 days | 140 days |
| 2011 US Debt Ceiling Crisis & European Contagion | ||
| % Loss | -37.3% | -17.9% |
| % Gain to Breakeven | 59.5% | 21.8% |
| Time to Breakeven | 595 days | 123 days |
| 2010 Eurozone Sovereign Debt Crisis / Flash Crash | ||
| % Loss | -26.6% | -15.4% |
| % Gain to Breakeven | 36.2% | 18.2% |
| Time to Breakeven | 140 days | 125 days |
| 2008-2009 Global Financial Crisis | ||
| % Loss | -66.8% | -53.4% |
| % Gain to Breakeven | 201.2% | 114.4% |
| Time to Breakeven | 634 days | 1085 days |
In The Past
Agilent Technologies's stock fell -27.5% during the 2025 US Tariff Shock. Such a loss loss requires a 37.8% gain to breakeven.
Preserve Wealth
Limiting losses and compounding gains is essential to preserving wealth.
Asset Allocation
Actively managed asset allocation strategies protect wealth. Learn more.
About Agilent Technologies (A)
Agilent Technologies (A) is a global provider of application-focused solutions primarily serving the life sciences, diagnostics, and applied chemical markets. The company equips laboratories and researchers worldwide with advanced tools and technologies essential for scientific analysis, discovery, and healthcare advancements.
Its core offerings include a broad range of analytical instruments and systems. These encompass various forms of chromatography (liquid, gas), mass spectrometry (LC/MS, GC/MS, ICP-MS), and spectroscopy (atomic absorption, ICP-OES, Raman), alongside cell analysis platforms, laboratory software, and automation solutions. Additionally, Agilent provides arrays for DNA mutation detection, genotyping, gene expression profiling, next-generation sequencing tools, and immunohistochemistry products for diagnostic applications, along with related reagents and software for genetic data management.
Complementing its instrumentation, the Agilent CrossLab segment offers critical consumables such as GC/LC columns and sample preparation products, as well as extensive services including instrument support, training, compliance, and consultation. Agilent's primary customers are scientists and professionals across academic research institutions, pharmaceutical and biotechnology companies, clinical diagnostic laboratories, environmental testing facilities, and chemical and food safety industries globally.
AI Analysis | Feedback
- Agilent is like Thermo Fisher Scientific for advanced lab instruments and diagnostics.
- Agilent is like the Danaher Corporation for scientific research and diagnostic tools.
AI Analysis | Feedback
- Chromatography Systems: Provides liquid and gas chromatography systems, often integrated with mass spectrometry for chemical analysis.
- Spectrometry Instruments: Offers a range of instruments including ICP-MS, atomic absorption, and optical emission spectrometry for elemental and molecular analysis.
- Cell Analysis Products: Includes flow cytometers, real-time cell analyzers, imaging systems, and plate-based assays for cellular research.
- Genomics Arrays & Oligonucleotides: Supplies arrays for DNA mutation detection, genotyping, gene expression profiling, and synthesized oligonucleotides.
- Pathology Staining Products: Delivers reagents and consumables for immunohistochemistry, in situ hybridization, and hematoxylin and eosin staining.
- Laboratory Software & Automation: Provides software for information management, analytics, and robotic systems for automating lab workflows.
- Laboratory Supplies & Consumables: Offers GC and LC columns, sample preparation products, and various other essential laboratory instrument supplies.
- Lab Support & Training Services: Provides startup, operational, compliance support, and training for laboratory instrumentation and processes.
- Software as a Service (SaaS): Offers cloud-based software solutions for data management, analysis, and interpretation within laboratories.
- Asset Management & Consultation: Delivers services for managing laboratory assets and provides expert consultation for scientific applications.
AI Analysis | Feedback
Agilent Technologies (symbol: A) primarily sells its specialized instruments, consumables, software, and services to other companies and institutions rather than directly to individuals.
The provided company description does not list specific names of major customer companies. Instead, it indicates that Agilent Technologies provides application-focused solutions to distinct markets, which represent its major customer categories:
- Life Sciences and Biotechnology Sector: This category includes pharmaceutical companies, biotechnology firms, academic research institutions, and government research laboratories. These customers utilize Agilent's solutions for drug discovery and development, genomics research, proteomics, metabolomics, and general scientific research.
- Clinical Diagnostics and Healthcare Sector: This category encompasses clinical diagnostic laboratories, hospitals, and companies involved in developing diagnostic tests. They leverage Agilent's technologies for DNA mutation detection, genotyping, genetic profiling, immunohistochemistry, and various clinical analyses to aid in disease diagnosis and patient care.
- Applied Chemical Industries: This broad category includes companies in sectors such as environmental testing, food and beverage safety, petrochemicals, materials science, and general chemical manufacturing. These customers rely on Agilent's analytical instruments for quality control, regulatory compliance, product development, and process optimization.
AI Analysis | Feedback
AI Analysis | Feedback
Padraig McDonnell
President and Chief Executive Officer
Padraig McDonnell became President and CEO of Agilent in May 2024. He has over 25 years of experience in the analytical and scientific instrument industry, beginning his career at Hewlett-Packard Co., Agilent's predecessor company, in 1998. Prior to his current role, McDonnell served as president of the Agilent CrossLab Group (ACG) and as Agilent's chief commercial officer. He was also previously vice president and general manager of Agilent's Chemistries and Supplies Division starting in 2017. McDonnell played a significant role in driving service and sales growth in the Europe, Middle East, Africa, and India region (EMEAI) throughout his career at Agilent, holding various management positions.
Adam S. Elinoff
Senior Vice President and Chief Financial Officer
Adam S. Elinoff joined Agilent as Senior Vice President and Chief Financial Officer, effective November 17, 2025. In this role, he is responsible for all aspects of Agilent's global finance organization, including accounting, financial planning and analysis, investor relations, treasury, and tax. Elinoff brings nearly two decades of experience in finance, strategy, and transformation initiatives within the life sciences industry. Before joining Agilent, he spent 19 years at Amgen, a prominent biotechnology company, where he held various finance, strategy, and transformation roles of increasing responsibility, including Vice President of Finance and Treasurer, and Regional Chief Financial Officer for Europe, Middle East, Africa, Latin America, and Canada.
Simon May
Senior Vice President, President, Life Sciences and Diagnostics Markets Group
Simon May is the Senior Vice President and President of the Life Sciences and Diagnostics Markets Group at Agilent Technologies. He is a member of the senior executive team responsible for guiding the company's strategic direction and governance.
Angelica Riemann
Senior Vice President, President, Agilent CrossLab Group
Angelica Riemann serves as the Senior Vice President and President of the Agilent CrossLab Group. This group provides a range of services, including GC and LC columns, sample preparation products, custom chemistries, laboratory instrument supplies, and various support and consultation services.
Bret DiMarco
Senior Vice President, Chief Legal Officer and Secretary
Bret DiMarco holds the position of Senior Vice President, Chief Legal Officer, and Secretary at Agilent Technologies. He is a key member of the executive team, overseeing legal affairs and corporate governance for the company.
AI Analysis | Feedback
-
Rapid Technological Change and Intense Competition
Agilent operates in highly competitive markets within life sciences, diagnostics, and applied chemicals, which are characterized by rapid technological advancements. A significant risk is the potential for technological obsolescence, where failure to continuously innovate and introduce new, successful products in a timely manner could render Agilent's existing offerings less competitive. This could lead to a loss of market share to rivals such as Thermo Fisher Scientific, Waters Corporation, and Danaher Corporation, which also invest heavily in research and development and offer bundled solutions.
-
Evolving Regulatory and Compliance Landscape
The life sciences and diagnostics industries are subject to complex and frequently evolving international, federal, and local regulations. Agilent must comply with a myriad of rules related to data privacy, environmental protection, and product safety. Changes in these regulations, increased compliance costs, or any failure to adhere to existing standards could result in significant penalties, product recalls, operational restrictions, and reputational damage. The integration of new technologies, such as artificial intelligence, further introduces new risks concerning intellectual property, data privacy, and regulatory scrutiny.
-
Global Economic Conditions and Geopolitical Instability
As a company with extensive global operations, Agilent is highly sensitive to changes in general economic conditions worldwide. Economic downturns, inflationary pressures, or market instability could lead to reduced demand for its products and increased pricing pressure from customers. Furthermore, its international presence exposes Agilent to risks associated with foreign currency fluctuations, political instability, and changes in trade policies, including tariffs. Disruptions in its global supply chain, which relies on centralized order fulfillment and supply chain operations, also pose a considerable risk.
AI Analysis | Feedback
The emergence and rapid adoption of liquid biopsy technologies in diagnostics pose a clear emerging threat to Agilent's traditional tissue-based diagnostic offerings, specifically its immunohistochemistry, in situ hybridization, and hematoxylin and eosin staining products. As liquid biopsies (e.g., analysis of circulating tumor DNA for cancer detection and monitoring) offer less invasive and potentially earlier detection methods, they could reduce the demand for conventional tissue sample preparation and analysis techniques currently provided by Agilent's Diagnostics and Genomics segment.
AI Analysis | Feedback
Agilent Technologies operates in several significant addressable markets globally:
-
Mass Spectrometry: The global mass spectrometry market was estimated at USD 6.6 billion in 2024 and is projected to reach USD 10.65 billion by 2030, growing at a compound annual growth rate (CAGR) of 7.97% from 2025 to 2030. North America held the largest share of this market in 2024.
-
Chromatography: The global chromatography market size was valued at USD 10.28 billion in 2024 and is projected to grow to USD 16.94 billion by 2033, with a CAGR of 5.7% during the forecast period (2026–2033). Separately, the global chromatography systems market is projected to rise from US$ 1,627.3 million in 2025 to US$ 2,774.9 million by 2032, witnessing a CAGR of 7.3%.
-
Cell Analysis: The global cell analysis market size was estimated at USD 34.3 billion in 2025 and is projected to reach USD 81.0 billion by 2033, growing at a CAGR of 11.7% from 2026 to 2033. North America accounted for the largest global market share of 40.0% in 2025.
-
Genomics and Diagnostics: The global genomics market was valued at USD 39 billion in 2024 and is expected to grow from USD 44.7 billion in 2025 to USD 162 billion by 2034, at a CAGR of 15.4%. Another report estimated the global genomics market size at USD 37.94 billion in 2024 and anticipates it to reach approximately USD 175.18 billion by 2034, expanding at a CAGR of 16.53% from 2025 to 2034. North America dominated the global genomics market with 42.65% market share in 2024.
-
Laboratory Automation: The global laboratory automation market size was estimated at USD 8.27 billion in 2024 and is projected to reach USD 18.39 billion by 2033, growing at a CAGR of 9.3% from 2025 to 2033. North America held the largest share of 36.54% of the global market in 2024.
-
Laboratory Consumables: The global laboratory consumables market size was estimated at USD 15.8 billion in 2024 and is projected to reach USD 26.58 billion by 2030, growing at a CAGR of 8.65% from 2025 to 2030. North America dominated the global industry with a 36.25% revenue share in 2024.
AI Analysis | Feedback
Agilent Technologies (symbol: A) is expected to drive future revenue growth over the next 2-3 years through several strategic initiatives and market opportunities:
- Expansion in Biopharma and Diagnostics Markets, fueled by strategic acquisitions and focused R&D: Agilent is actively expanding its capabilities in the biopharmaceutical sector, notably through the acquisition of BIOVECTRA in September 2024 to enhance its contract development and manufacturing (CDMO) services, particularly in biologics, gene-editing technologies, GLP-1s, ADCs, and HPAPIs. The company is also shifting its portfolio towards resilient, high-growth areas like biopharma QA/QC, cell analysis, and spatial biology, responding to increasing R&D spending on new therapeutics. The diagnostics and clinical markets are consistently highlighted as high-growth segments for the company.
- Continuous Product Innovation and Advanced Digital Solutions: Agilent consistently invests in research and development to launch new products and enhance its technological offerings. Recent examples include the InfinityLab LC Series, 8850 GC System, Revident LC/Q-TOF, Infinity III LC platform, and the ProteoAnalyzer system. The company is also integrating artificial intelligence (AI) and automation into its product portfolio and expanding its software and informatics capabilities to significantly improve laboratory productivity and operational efficiency for its clients.
- Growth of Recurring Revenue Streams through Agilent CrossLab Services and Consumables: The Agilent CrossLab Group (ACG), which provides GC and LC columns, sample preparation products, custom chemistries, laboratory instrument supplies, and various services, is a consistent driver of growth. This segment is focused on building a larger recurring revenue business, with its contract services, particularly enterprise service contracts, demonstrating double-digit growth. This focus on services and consumables helps stabilize revenue and protect margins, even during instrument cyclicality.
- Penetration of High-Growth Applied Markets and Strategic Geographic Expansion: Agilent is capitalizing on strong demand in specific applied markets such as PFAS (per- and polyfluoroalkyl substances) testing solutions, which have shown significant growth, as well as advanced materials, including those for batteries and semiconductors. Environmental testing is also an expanding addressable market. Geographically, while facing some challenges, Agilent anticipates a return to low-to-mid single-digit growth in China for fiscal year 2025 and projects double-digit growth in emerging economies like India and ASEAN.
AI Analysis | Feedback
Share Repurchases
- Agilent Technologies authorized a new $2.0 billion share repurchase program in 2024, which became effective on August 1, 2024, and commenced after the completion of the 2023 repurchase program in September 2025.
- As of October 31, 2025, the company had repurchased 381,670 shares for $51 million under the 2024 program, with approximately $1.9 billion remaining authorized for future repurchases.
- In fiscal year 2024, Agilent repurchased 8.4 million shares for approximately $1.15 billion.
Share Issuance
- Agilent Technologies' shares outstanding have shown a consistent decline over the last few years, with 0.285 billion shares outstanding in 2025, a 2.06% decrease from 2024.
- Shares outstanding were 0.291 billion in 2024, representing a 1.69% decline from 2023.
- For the quarter ending January 31, 2026, shares outstanding were 284 million, indicating a 1.05% year-over-year decline.
Outbound Investments
- Agilent Technologies entered into a definitive agreement to acquire Biocare Medical for $950 million in an all-cash transaction, expected to close by the fourth fiscal quarter of 2026, to expand its pathology portfolio.
- In July 2024, Agilent acquired BioVectra for $925 million, an acquisition aimed at strengthening its position in CDMO (Contract Development and Manufacturing Organization) services, particularly in high-growth areas like GLP-1.
- Other notable acquisitions in the past three to five years include Resolution Bioscience for $550 million in March 2021 and Avida Biomed in January 2023 (undisclosed amount).
Capital Expenditures
- Agilent Technologies' capital expenditures for fiscal year 2025 were estimated to be $450 million, with the second quarter of 2025 seeing $114 million in capital expenditures, largely focused on NASD expansion.
- For fiscal year 2026, the company expects to invest $500 million in capital expenditures.
- In fiscal year 2024, capital expenditures amounted to approximately $378 million, primarily directed towards expanding manufacturing capabilities, particularly in diagnostics and CDMO.
Peer Outperformance in Life Sciences Tools & Services
| Ticker | Name | Rev Growth 3Y Avg | P/E | 1Y | 3Y | 5Y | 5Y Gap |
|---|---|---|---|---|---|---|---|
| A | Agilent Technologies | 2.0% | 28.8x | 20.2% | 32.5% | -11.5% | — |
| TMO | Thermo Fisher Scientific | 2.2% | 32.5x | 27.7% | 20.5% | 10.6% | +22pp |
| Industry | Names | 1Y med | 3Y med | 5Y med | Top 3 by 5Y |
|---|---|---|---|---|---|
| Health Care Distributors | 7 | 7.1% | 86.6% | 123.6% | CAH 394% · MCK 338% · COR 174% |
| Managed Health Care | 8 | 43.7% | -1.7% | 5.5% | OSCR 92% · HQY 50% · ELV 22% |
| Health Care Services | 20 | 18.9% | 44.9% | -1.2% | HIMS 210% · RDNT 167% · DGX 68% |
| Health Care Facilities | 24 | 3.7% | 8.8% | -15.4% | NHC 274% · THC 258% · ENSG 119% |
| Health Care Equipment | 50 | -1.7% | -5.7% | -25.4% | POCI 10800% · UFPT 324% · GKOS 233% |
| Health Care Supplies | 12 | 20.8% | -12.4% | -38.0% | LNTH 300% · HAE 51% · MMSI 21% |
| Pharmaceuticals | 62 | -7.4% | 7.5% | -41.2% | LQDA 2363% · INDV 1136% · ETON 1026% |
| Life Sciences Tools & Services ← | 109 | -1.4% | -26.6% | -71.9% | SNWV 1573% · MEDP 217% · NTRA 174% |
| Health Care Technology | 20 | -31.7% | -51.5% | -79.2% | SPOK 79% · HSTM 2% · VEEV -12% |
| Biotechnology | 361 | 1.6% | -25.2% | -79.6% | DNTH 1596% · CELZ 1272% · ELVN 1178% |
Latest Trefis Analyses
Research & Analysis
Invest in Strategies
Wealth Management
Peer Comparisons
| Peers to compare with: |
Financials
| Median | |
|---|---|
| Name | |
| Mkt Price | 307.39 |
| Mkt Cap | 40.8 |
| Rev LTM | 6,008 |
| Op Inc LTM | 1,407 |
| FCF LTM | 1,099 |
| FCF 3Y Avg | 1,064 |
| CFO LTM | 1,352 |
| CFO 3Y Avg | 1,302 |
Growth & Margins
| Median | |
|---|---|
| Name | |
| Rev Chg LTM | 7.1% |
| Rev Chg 3Y Avg | 2.1% |
| Rev Chg Q | 8.7% |
| QoQ Delta Rev Chg LTM | 2.1% |
| Op Inc Chg LTM | 8.0% |
| Op Inc Chg 3Y Avg | 2.8% |
| Op Mgn LTM | 20.1% |
| Op Mgn 3Y Avg | 20.5% |
| QoQ Delta Op Mgn LTM | 0.5% |
| CFO/Rev LTM | 22.7% |
| CFO/Rev 3Y Avg | 22.4% |
| FCF/Rev LTM | 19.0% |
| FCF/Rev 3Y Avg | 18.0% |
Valuation
| Median | |
|---|---|
| Name | |
| Mkt Cap | 40.8 |
| P/S | 6.0 |
| P/Op Inc | 27.1 |
| P/EBIT | 26.4 |
| P/E | 33.9 |
| P/CFO | 26.2 |
| Total Yield | 3.4% |
| Dividend Yield | 0.1% |
| FCF Yield 3Y Avg | 3.4% |
| D/E | 0.1 |
| Net D/E | 0.1 |
Returns
| Median | |
|---|---|
| Name | |
| 1M Rtn | -1.4% |
| 3M Rtn | 14.6% |
| 6M Rtn | 31.9% |
| 12M Rtn | 23.9% |
| 3Y Rtn | 26.5% |
| 1M Excs Rtn | -0.2% |
| 3M Excs Rtn | 10.0% |
| 6M Excs Rtn | 15.5% |
| 12M Excs Rtn | 6.7% |
| 3Y Excs Rtn | -50.4% |
Comparison Analyses
FDA Approved Drugs Data
Expand for More| Post-Approval Fwd Returns | |||||||||
|---|---|---|---|---|---|---|---|---|---|
| FDA App # | Brand Name | Generic Name | Dosage Form | FDA Approval | 3M Rtn | 6M Rtn | 1Y Rtn | 2Y Rtn | Total Rtn |
| NDA204017 | TWIRLA | ethinyl estradiol | system | 2142020 | -4.7% | 14.0% | 50.3% | 62.0% | 79.3% |
| Post-Approval Fwd Returns | |||||||||
|---|---|---|---|---|---|---|---|---|---|
| FDA App # | Brand Name | Generic Name | Dosage Form | FDA Approval | 3M Rtn | 6M Rtn | 1Y Rtn | 2Y Rtn | Total Rtn |
| NDA204017 | TWIRLA | ethinyl estradiol | system | 2142020 | -4.7% | 14.0% | 50.3% | 62.0% | 79.3% |
Segment Financials
Revenue by Segment| $ Mil | 2025 | 2024 | 2023 | 2022 | 2021 |
|---|---|---|---|---|---|
| Agilent CrossLab | 2,908 | 2,747 | 2,656 | 1,452 | 1,360 |
| Life Sciences and Diagnostics Markets | 2,726 | 2,466 | 2,780 | ||
| Applied Markets | 1,314 | 1,297 | 1,397 | ||
| Diagnostics and Genomics | 1,766 | 1,296 | |||
| Life Sciences and Applied Markets | 3,630 | 3,663 | |||
| Total | 6,948 | 6,510 | 6,833 | 6,848 | 6,319 |
| $ Mil | 2025 | 2024 | 2023 | 2022 | 2021 |
|---|---|---|---|---|---|
| Agilent CrossLab | 946 | 925 | 839 | 370 | 323 |
| Life Sciences and Diagnostics Markets | 536 | 484 | 673 | ||
| Applied Markets | 301 | 312 | 363 | ||
| Asset Impairments | 0 | -8 | -277 | 0 | -2 |
| Acquisition and integration costs | -19 | -12 | -16 | -25 | -41 |
| Other | -30 | -24 | -22 | -11 | -8 |
| Transformational initiatives | -69 | -11 | -25 | -30 | -37 |
| Restructuring and other related costs | -82 | -76 | -46 | 0 | |
| Amortization of intangible assets related to business combinations | -104 | -102 | -139 | -191 | -194 |
| Business exit and divestiture costs | -7 | -5 | |||
| Change in fair value of contingent consideration | 25 | 21 | |||
| Diagnostics and Genomics | 390 | 273 | |||
| Life Sciences and Applied Markets | 1,097 | 1,017 | |||
| Total | 1,479 | 1,488 | 1,350 | 1,618 | 1,347 |
| $ Mil | 2024 | 2023 | 2022 | 2021 | 2020 |
|---|---|---|---|---|---|
| Diagnostics and Genomics | 5,044 | 3,307 | 3,489 | 3,320 | 2,515 |
| Life Sciences and Applied Markets | 3,139 | 3,820 | 3,955 | 3,078 | 3,143 |
| Cash and cash equivalents | 1,329 | 1,590 | 1,053 | 1,484 | 1,441 |
| Agilent CrossLab | 915 | 897 | 869 | 1,502 | 1,375 |
| Other | 385 | 281 | 322 | 341 | 220 |
| Deferred tax assets | 351 | 284 | 246 | 309 | 380 |
| Prepaid expenses | 188 | 139 | 119 | 91 | 106 |
| Right of use assets | 177 | 154 | 150 | 178 | 175 |
| Long-term investments | 175 | 164 | 195 | ||
| Long-term and other receivables | 143 | 127 | 134 | 126 | 114 |
| Investments | 185 | 158 | |||
| Short-term investments | 91 | ||||
| Total | 11,846 | 10,763 | 10,532 | 10,705 | 9,627 |
Price Behavior
| Market Price | $146.93 | |
| Market Cap ($ Bil) | 41.4 | |
| First Trading Date | 11/18/1999 | |
| Distance from 52W High | -7.6% | |
| 50 Days | 200 Days | |
| DMA Price | $143.26 | $131.23 |
| DMA Trend | indeterminate | up |
| Distance from DMA | 2.6% | 12.0% |
| 3M | 1YR | |
| Volatility | 29.2% | 32.8% |
| Downside Capture | 68.84 | 100.29 |
| Upside Capture | 120.72 | 103.15 |
| Correlation (SPY) | 18.3% | 34.1% |
| 1M | 2M | 3M | 6M | 1Y | 3Y | |
|---|---|---|---|---|---|---|
| Beta | 0.65 | 0.34 | 0.37 | 0.75 | 0.87 | 0.95 |
| Up Beta | -0.78 | -0.42 | -0.72 | 0.39 | 0.59 | 0.82 |
| Down Beta | 0.05 | -0.94 | 0.78 | 0.80 | 0.79 | 0.94 |
| Up Capture | 206% | 147% | 87% | 103% | 101% | 92% |
| Bmk +ve Days | 10 | 21 | 32 | 68 | 138 | 427 |
| Stock +ve Days | 13 | 22 | 35 | 69 | 130 | 386 |
| Down Capture | 63% | 43% | 33% | 73% | 98% | 103% |
| Bmk -ve Days | 11 | 21 | 32 | 59 | 113 | 324 |
| Stock -ve Days | 8 | 20 | 29 | 58 | 121 | 365 |
[1] Upside and downside betas calculated using positive and negative benchmark daily returns respectively
Based On 1-Year Data
| Annualized Return | Annualized Volatility | Sharpe Ratio | Correlation with A | |
|---|---|---|---|---|
| A | 19.4% | 32.9% | 0.57 | - |
| Sector ETF (XLV) | 22.1% | 16.2% | 1.04 | 49.3% |
| Equity (SPY) | 18.3% | 12.8% | 1.03 | 34.6% |
| Gold (GLD) | 19.0% | 29.2% | 0.59 | 10.7% |
| Commodities (DBC) | 48.3% | 20.6% | 1.80 | -12.4% |
| Real Estate (VNQ) | 7.6% | 13.6% | 0.29 | 21.0% |
| Bitcoin (BTCUSD) | -32.4% | 43.8% | -0.77 | 13.2% |
Smart multi-asset allocation framework can stack odds in your favor. Learn How
Based On 5-Year Data
| Annualized Return | Annualized Volatility | Sharpe Ratio | Correlation with A | |
|---|---|---|---|---|
| A | -3.1% | 30.4% | -0.08 | - |
| Sector ETF (XLV) | 5.5% | 15.2% | 0.18 | 60.7% |
| Equity (SPY) | 12.5% | 17.2% | 0.55 | 57.1% |
| Gold (GLD) | 18.7% | 18.8% | 0.81 | 10.9% |
| Commodities (DBC) | 11.4% | 19.5% | 0.46 | 5.7% |
| Real Estate (VNQ) | 0.7% | 18.9% | -0.07 | 48.5% |
| Bitcoin (BTCUSD) | 9.4% | 52.6% | 0.36 | 21.0% |
Smart multi-asset allocation framework can stack odds in your favor. Learn How
Based On 10-Year Data
| Annualized Return | Annualized Volatility | Sharpe Ratio | Correlation with A | |
|---|---|---|---|---|
| A | 13.0% | 28.3% | 0.47 | - |
| Sector ETF (XLV) | 10.4% | 16.7% | 0.50 | 66.0% |
| Equity (SPY) | 15.2% | 17.9% | 0.72 | 63.9% |
| Gold (GLD) | 12.3% | 16.3% | 0.62 | 8.6% |
| Commodities (DBC) | 8.7% | 18.1% | 0.39 | 14.2% |
| Real Estate (VNQ) | 4.7% | 20.7% | 0.19 | 48.3% |
| Bitcoin (BTCUSD) | 63.2% | 66.2% | 1.03 | 16.0% |
Smart multi-asset allocation framework can stack odds in your favor. Learn How
Returns Analyses
Earnings Returns History
Updated 9/4/2026| Forward Returns | |||
|---|---|---|---|
| Earnings Date | 1D Returns | 5D Returns | 21D Returns |
| 8/26/2026 | 1.7% | -2.4% | |
| 5/27/2026 | 16.9% | 18.6% | 17.4% |
| 2/25/2026 | -3.0% | -3.4% | -9.0% |
| 11/24/2025 | 2.3% | -2.8% | -10.2% |
| 8/27/2025 | 5.3% | 8.2% | 4.0% |
| 5/28/2025 | 2.2% | 3.7% | 7.5% |
| 2/26/2025 | -5.5% | -5.9% | -11.5% |
| 11/25/2024 | -0.1% | 3.6% | 1.0% |
| ... | |||
| SUMMARY STATS | |||
| # Positive | 14 | 12 | 13 |
| # Negative | 10 | 12 | 10 |
| Median Positive | 2.3% | 3.8% | 4.5% |
| Median Negative | -3.4% | -3.8% | -7.9% |
| Max Positive | 16.9% | 18.6% | 21.2% |
| Max Negative | -9.7% | -10.1% | -11.5% |
| Forward Returns | |||
|---|---|---|---|
| Earnings Date | 1D Returns | 5D Returns | 21D Returns |
| 8/26/2026 | 1.7% | -2.4% | |
| 5/27/2026 | 16.9% | 18.6% | 17.4% |
| 2/25/2026 | -3.0% | -3.4% | -9.0% |
| 11/24/2025 | 2.3% | -2.8% | -10.2% |
| 8/27/2025 | 5.3% | 8.2% | 4.0% |
| 5/28/2025 | 2.2% | 3.7% | 7.5% |
| 2/26/2025 | -5.5% | -5.9% | -11.5% |
| 11/25/2024 | -0.1% | 3.6% | 1.0% |
| 8/21/2024 | 0.2% | 0.8% | 0.1% |
| 5/29/2024 | -9.7% | -8.2% | -10.9% |
| 2/27/2024 | 3.4% | 8.9% | 11.2% |
| 11/20/2023 | 8.7% | 9.4% | 21.2% |
| 8/15/2023 | -3.4% | -6.4% | -8.6% |
| 5/23/2023 | -5.9% | -10.1% | -7.2% |
| 2/28/2023 | -3.1% | -1.2% | -5.7% |
| 11/21/2022 | 8.1% | 4.0% | 3.4% |
| 8/16/2022 | 7.2% | -0.1% | 0.3% |
| 5/24/2022 | -3.2% | -1.1% | -2.5% |
| 2/22/2022 | -3.4% | 1.1% | 2.8% |
| 11/22/2021 | -4.9% | -7.3% | -3.7% |
| 8/17/2021 | 1.3% | 6.0% | 7.7% |
| 5/25/2021 | 0.0% | 2.5% | 10.1% |
| 2/16/2021 | 1.7% | -4.3% | -4.2% |
| 11/23/2020 | 2.2% | 2.8% | 4.5% |
| SUMMARY STATS | |||
| # Positive | 14 | 12 | 13 |
| # Negative | 10 | 12 | 10 |
| Median Positive | 2.3% | 3.8% | 4.5% |
| Median Negative | -3.4% | -3.8% | -7.9% |
| Max Positive | 16.9% | 18.6% | 21.2% |
| Max Negative | -9.7% | -10.1% | -11.5% |
SEC Filings
Expand for More| Report Date | Filing Date | Filing |
|---|---|---|
| 07/31/2026 | 09/01/2026 | 10-Q |
| 04/30/2026 | 06/01/2026 | 10-Q |
| 01/31/2026 | 03/03/2026 | 10-Q |
| 10/31/2025 | 12/22/2025 | 10-K |
| 07/31/2025 | 08/29/2025 | 10-Q |
| 04/30/2025 | 06/02/2025 | 10-Q |
| 01/31/2025 | 03/03/2025 | 10-Q |
| 10/31/2024 | 12/20/2024 | 10-K |
| 07/31/2024 | 08/30/2024 | 10-Q |
| 04/30/2024 | 06/03/2024 | 10-Q |
| 01/31/2024 | 03/05/2024 | 10-Q |
| 10/31/2023 | 12/20/2023 | 10-K |
| 07/31/2023 | 08/31/2023 | 10-Q |
| 04/30/2023 | 05/26/2023 | 10-Q |
| 01/31/2023 | 03/03/2023 | 10-Q |
| 10/31/2022 | 12/21/2022 | 10-K |
| Report Date | Filing Date | Filing |
|---|---|---|
| 07/31/2026 | 09/01/2026 | 10-Q |
| 04/30/2026 | 06/01/2026 | 10-Q |
| 01/31/2026 | 03/03/2026 | 10-Q |
| 10/31/2025 | 12/22/2025 | 10-K |
| 07/31/2025 | 08/29/2025 | 10-Q |
| 04/30/2025 | 06/02/2025 | 10-Q |
| 01/31/2025 | 03/03/2025 | 10-Q |
| 10/31/2024 | 12/20/2024 | 10-K |
| 07/31/2024 | 08/30/2024 | 10-Q |
| 04/30/2024 | 06/03/2024 | 10-Q |
| 01/31/2024 | 03/05/2024 | 10-Q |
| 10/31/2023 | 12/20/2023 | 10-K |
| 07/31/2023 | 08/31/2023 | 10-Q |
| 04/30/2023 | 05/26/2023 | 10-Q |
| 01/31/2023 | 03/03/2023 | 10-Q |
| 10/31/2022 | 12/21/2022 | 10-K |
| 07/31/2022 | 09/01/2022 | 10-Q |
| 04/30/2022 | 05/31/2022 | 10-Q |
| 01/31/2022 | 03/03/2022 | 10-Q |
| 10/31/2021 | 12/17/2021 | 10-K |
| 07/31/2021 | 09/01/2021 | 10-Q |
| 04/30/2021 | 06/01/2021 | 10-Q |
| 01/31/2021 | 03/02/2021 | 10-Q |
| 10/31/2020 | 12/18/2020 | 10-K |
| 07/31/2020 | 09/01/2020 | 10-Q |
| 04/30/2020 | 06/01/2020 | 10-Q |
| 01/31/2020 | 03/03/2020 | 10-Q |
| 10/31/2019 | 12/19/2019 | 10-K |
Recent Forward Guidance
Updated 8/27/2026Latest: Q3 2026 Earnings Reported 8/26/2026
| Forward Guidance | Guidance Change | |||||||
|---|---|---|---|---|---|---|---|---|
| Metric | Source | Low | Mid | High | % Chg | % Delta | Change | Prior |
| Q4 2026 Revenue | Reported | 1.98 Bil | 1.99 Bil | 2.00 Bil | 8.2% | Higher New | Guidance: 1.84 Bil for Q3 2026 | |
| Q4 2026 Non-GAAP EPS | Reported | 1.71 | 1.73 | 1.74 | 15.8% | Higher New | Guidance: 1.49 for Q3 2026 | |
| 2026 Revenue | Reported | 7.49 Bil | 7.50 Bil | 7.51 Bil | 0.8% | Raised | Guidance: 7.44 Bil for 2026 | |
| 2026 Non-GAAP EPS | Reported | 6.18 | 6.2 | 6.21 | 2.4% | Raised | Guidance: 6.05 for 2026 | |
Prior: Q2 2026 Earnings Reported 5/27/2026
| Forward Guidance | Guidance Change | |||||||
|---|---|---|---|---|---|---|---|---|
| Metric | Source | Low | Mid | High | % Chg | % Delta | Change | Prior |
| Q3 2026 Revenue | Reported | 1.83 Bil | 1.84 Bil | 1.85 Bil | 1.9% | Higher New | Guidance: 1.80 Bil for Q2 2026 | |
| Q3 2026 Non-GAAP EPS | Reported | 1.48 | 1.49 | 1.5 | 6.0% | Higher New | Guidance: 1.41 for Q2 2026 | |
| 2026 Revenue | Reported | 7.39 Bil | 7.44 Bil | 7.49 Bil | 0.5% | Raised | Guidance: 7.40 Bil for 2026 | |
| 2026 Non-GAAP EPS | Reported | 6 | 6.05 | 6.1 | 1.3% | Raised | Guidance: 5.97 for 2026 | |
Q1 2026 Earnings Reported 2/25/2026
| Forward Guidance | Guidance Change | |||||||
|---|---|---|---|---|---|---|---|---|
| Metric | Source | Low | Mid | High | % Chg | % Delta | Change | Prior |
| Q2 2026 Revenue | Reported | 1.79 Bil | 1.80 Bil | 1.82 Bil | 0 | Same New | Guidance: 1.80 Bil for Q1 2026 | |
| Q2 2026 Non-GAAP EPS | Reported | 1.39 | 1.41 | 1.42 | 2.9% | Higher New | Guidance: 1.36 for Q1 2026 | |
| 2026 Revenue | Reported | 7.30 Bil | 7.40 Bil | 7.50 Bil | 0.7% | Raised | Guidance: 7.35 Bil for 2026 | |
| 2026 Non-GAAP EPS | Reported | 5.9 | 5.97 | 6.04 | 0.7% | Raised | Guidance: 5.93 for 2026 | |
Q4 2025 Earnings Reported 11/24/2025
| Forward Guidance | Guidance Change | |||||||
|---|---|---|---|---|---|---|---|---|
| Metric | Source | Low | Mid | High | % Chg | % Delta | Change | Prior |
| Q1 2026 Revenue | Reported | 1.79 Bil | 1.80 Bil | 1.82 Bil | -1.5% | Lower New | Guidance: 1.83 Bil for Q4 2025 | |
| Q1 2026 Non-GAAP EPS | Reported | 1.35 | 1.36 | 1.38 | -13.9% | Lower New | Guidance: 1.58 for Q4 2025 | |
| 2026 Revenue | Reported | 7.30 Bil | 7.35 Bil | 7.40 Bil | 6.2% | Higher New | Guidance: 6.92 Bil for 2025 | |
| 2026 Non-GAAP EPS | Reported | 5.86 | 5.93 | 6 | 6.4% | Higher New | Guidance: 5.58 for 2025 | |
Insider Activity
Updated 9/10/2026| # | Owner | Title | Holding | Action | Filing Date | Price | Shares | Transacted Value | Value of Held Shares | Form |
|---|---|---|---|---|---|---|---|---|---|---|
| 1 | Dolsten, Mikael | Direct | Sell | 9092026 | 151.38 | 634 | 95,972 | 745,322 | Form | |
| 2 | Dolsten, Mikael | Direct | Sell | 6022026 | 135.42 | 1,600 | 216,672 | 751,362 | Form | |
| 3 | Dolsten, Mikael | Direct | Sell | 12032025 | 149.81 | 2,600 | 389,511 | 745,019 | Form | |
| 4 | Gonsalves, Rodney | V.P., Corporate Controller | Direct | Sell | 12012025 | 154.99 | 3,000 | 464,956 | 4,935,613 | Form |
| 5 | McDonnell, Padraig | President and CEO | Direct | Sell | 11202025 | 143.24 | 911 | 130,492 | 4,591,988 | Form |
| # | Owner | Title | Holding | Action | Filing Date | Price | Shares | Transacted Value | Value of Held Shares | Form |
|---|---|---|---|---|---|---|---|---|---|---|
| 1 | Dolsten, Mikael | Direct | Sell | 9092026 | 151.38 | 634 | 95,972 | 745,322 | Form | |
| 2 | Dolsten, Mikael | Direct | Sell | 6022026 | 135.42 | 1,600 | 216,672 | 751,362 | Form | |
| 3 | Dolsten, Mikael | Direct | Sell | 12032025 | 149.81 | 2,600 | 389,511 | 745,019 | Form | |
| 4 | Gonsalves, Rodney | V.P., Corporate Controller | Direct | Sell | 12012025 | 154.99 | 3,000 | 464,956 | 4,935,613 | Form |
| 5 | McDonnell, Padraig | President and CEO | Direct | Sell | 11202025 | 143.24 | 911 | 130,492 | 4,591,988 | Form |
| 6 | McDonnell, Padraig | President and CEO | Direct | Sell | 11142025 | 150.00 | 12,490 | 1,873,500 | 5,017,200 | Form |
| 7 | McDonnell, Padraig | President and CEO | Direct | Sell | 9042025 | 124.88 | 2,000 | 249,760 | 4,176,986 | Form |
Investor Activity (13F)
Updated Sep 13, 2026Active managers (13F portfolio over $250M, at least 3 holdings) with a position over $5M that is either over 10% of their portfolio or held in a concentrated book of 50 or fewer total positions. Index/ETF, sovereign, bank, community-bank and charitable/donor-advised filers are excluded.
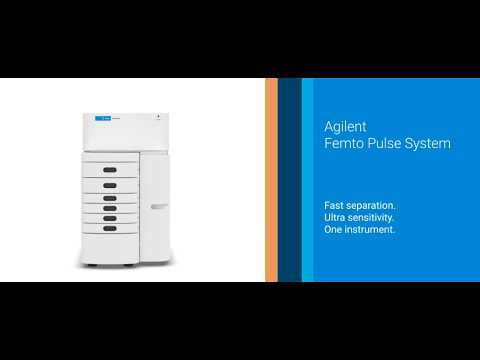
Agilent Technologies — Investor Video Playlist


Industry Resources
| Health Care Resources |
| U.S. National Library of Medicine |
| ClinicalTrials.gov |
| Modern Healthcare |
| Healthcare Dive |
| Fierce Healthcare |
| Health Affairs |
| Health Data Management |
| FDA Tracker |
| Life Sciences Tools & Services Resources |
| GenomeWeb |
| BioSpace |
| The Scientist |
External Quote Links
| Y Finance | Barrons |
| TradingView | Morningstar |
| SeekingAlpha | ValueLine |
| Motley Fool | Robinhood |
| CNBC | Etrade |
| MarketWatch | Unusual Whales |
| YCharts | Perplexity Finance |
| FinViz |
Prefer one of these to Trefis? Tell us why.