
Danaher (DHR)
Market Price (9/24/2026): $221.61 | Market Cap: $156.3 BilSector: Health Care | Industry: Life Sciences Tools & Services
Danaher (DHR)
Market Price (9/24/2026): $221.61Market Cap: $156.3 BilSector: Health CareIndustry: Life Sciences Tools & Services
Investment Highlights Why It Matters Detailed financial logic regarding cash flow yields vs trend-riding momentum.
Attractive cash flow generationCFO/Rev LTMCash Flow from Operations / Revenue (Sales), Last Twelve Months (LTM) is 26%, FCF/Rev LTMFree Cash Flow / Revenue (Sales), Last Twelve Months (LTM) is 22%, CFO LTM is 6.6 Bil, FCF LTM is 5.5 Bil Stock buyback supportStock Buyback 3Y Total is 10.0 Bil Low stock price volatilityVol 12M is 32% Megatrend and thematic driversMegatrends include Biotechnology & Genomics, Precision Medicine, and Automation & Robotics. Themes include Advanced Diagnostics, Show more. | Weak multi-year price returns2Y Excs Rtn is -55%, 3Y Excs Rtn is -73% | Expensive valuation multiplesP/EBITPrice/EBIT or Price/(Operating Income) ratio is 31x, P/CFOPrice/(Cash Flow from Operations). CFO is cash before capital expenditures. is 24x, P/EPrice/Earnings or Price/(Net Income) is 39x Key risksDHR key risks include [1] a heavy reliance on its acquisition-based growth strategy, Show more. |
| Attractive cash flow generationCFO/Rev LTMCash Flow from Operations / Revenue (Sales), Last Twelve Months (LTM) is 26%, FCF/Rev LTMFree Cash Flow / Revenue (Sales), Last Twelve Months (LTM) is 22%, CFO LTM is 6.6 Bil, FCF LTM is 5.5 Bil |
| Stock buyback supportStock Buyback 3Y Total is 10.0 Bil |
| Low stock price volatilityVol 12M is 32% |
| Megatrend and thematic driversMegatrends include Biotechnology & Genomics, Precision Medicine, and Automation & Robotics. Themes include Advanced Diagnostics, Show more. |
| Weak multi-year price returns2Y Excs Rtn is -55%, 3Y Excs Rtn is -73% |
| Expensive valuation multiplesP/EBITPrice/EBIT or Price/(Operating Income) ratio is 31x, P/CFOPrice/(Cash Flow from Operations). CFO is cash before capital expenditures. is 24x, P/EPrice/Earnings or Price/(Net Income) is 39x |
| Key risksDHR key risks include [1] a heavy reliance on its acquisition-based growth strategy, Show more. |
Qualitative Assessment
AI Analysis | Feedback
Danaher (DHR) stock has gained about 20% since 5/31/2026 because of the following key factors:
1. Strong Fiscal Q2 2026 Earnings and Upgraded Full-Year EPS Outlook.
Danaher reported robust results for its fiscal Q2 2026 (ended June 30, 2026), with adjusted diluted earnings per share (EPS) of $1.94, surpassing analyst estimates by 5.43%. Revenue reached $6.3 billion, exceeding expectations by 3.3% to 5.5%. Despite an initial market reaction to a revised core revenue outlook, the company increased its full-year 2026 adjusted diluted net EPS guidance to a range of $8.45 to $8.60 from the previous $8.35 to $8.55, reflecting strong performance and operational discipline.
2. Earlier-Than-Anticipated Completion of Masimo Acquisition.
The acquisition of Masimo Corporation was completed in early June 2026, ahead of schedule. This earlier close contributed to Danaher's decision to raise its full-year 2026 adjusted diluted net EPS guidance, as the acquisition is expected to be accretive to adjusted EPS in its first full year of ownership.
Show more
Danaher (DHR) stock has gained about 20% since 5/31/2026 because of the following key factors:
1. Strong Fiscal Q2 2026 Earnings and Upgraded Full-Year EPS Outlook.
Danaher reported robust results for its fiscal Q2 2026 (ended June 30, 2026), with adjusted diluted earnings per share (EPS) of $1.94, surpassing analyst estimates by 5.43%. Revenue reached $6.3 billion, exceeding expectations by 3.3% to 5.5%. Despite an initial market reaction to a revised core revenue outlook, the company increased its full-year 2026 adjusted diluted net EPS guidance to a range of $8.45 to $8.60 from the previous $8.35 to $8.55, reflecting strong performance and operational discipline.
2. Earlier-Than-Anticipated Completion of Masimo Acquisition.
The acquisition of Masimo Corporation was completed in early June 2026, ahead of schedule. This earlier close contributed to Danaher's decision to raise its full-year 2026 adjusted diluted net EPS guidance, as the acquisition is expected to be accretive to adjusted EPS in its first full year of ownership.
3. Resilient Performance in Life Sciences and Diagnostics Segments.
Danaher's Life Sciences businesses achieved their strongest quarter in several years during fiscal Q2 2026, with underlying bioprocessing order trends remaining robust, growing mid-teens, despite some revenue timing shifts. Core revenue, excluding respiratory testing, accelerated to 4.5% year-over-year in fiscal Q2 2026, indicating solid demand and recovery across key end-markets for the company's scientific instruments and consumables.
4. Increased Institutional Investor Confidence and Accumulation.
The stock's upward movement was supported by favorable reactions to quarterly institutional holdings disclosures, which showed sustained accumulation and expanded stakes from major asset managers. This institutional inflow signaled robust confidence in Danaher's enterprise value, contributing to a strong tailwind for the stock during the period.
Show less
Stock Movement Drivers
Fundamental Drivers
The 21.5% change in DHR stock from 5/31/2026 to 9/23/2026 was primarily driven by a 11.6% change in the company's P/E Multiple.| (LTM values as of) | 5312026 | 9232026 | Change |
|---|---|---|---|
| Stock Price ($) | 182.29 | 221.56 | 21.5% |
| Change Contribution By: | |||
| Total Revenues ($ Mil) | 24,778 | 25,107 | 1.3% |
| Net Income Margin (%) | 14.9% | 15.9% | 7.1% |
| P/E Multiple | 35.0 | 39.0 | 11.6% |
| Shares Outstanding (Mil) | 708 | 705 | 0.4% |
| Cumulative Contribution | 21.5% |
Market Drivers
5/31/2026 to 9/23/2026| Return | Correlation | |
|---|---|---|
| DHR | 21.5% | |
| Market (SPY) | 1.8% | -3.0% |
| Sector (XLV) | 13.4% | 45.7% |
Fundamental Drivers
The 5.6% change in DHR stock from 2/28/2026 to 9/23/2026 was primarily driven by a 8.4% change in the company's Net Income Margin (%).| (LTM values as of) | 2282026 | 9232026 | Change |
|---|---|---|---|
| Stock Price ($) | 209.76 | 221.56 | 5.6% |
| Change Contribution By: | |||
| Total Revenues ($ Mil) | 24,568 | 25,107 | 2.2% |
| Net Income Margin (%) | 14.7% | 15.9% | 8.4% |
| P/E Multiple | 41.1 | 39.0 | -4.9% |
| Shares Outstanding (Mil) | 707 | 705 | 0.3% |
| Cumulative Contribution | 5.6% |
Market Drivers
2/28/2026 to 9/23/2026| Return | Correlation | |
|---|---|---|
| DHR | 5.6% | |
| Market (SPY) | 12.5% | 14.6% |
| Sector (XLV) | 6.3% | 48.2% |
Fundamental Drivers
The 8.4% change in DHR stock from 8/31/2025 to 9/23/2026 was primarily driven by a 12.2% change in the company's Net Income Margin (%).| (LTM values as of) | 8312025 | 9232026 | Change |
|---|---|---|---|
| Stock Price ($) | 204.31 | 221.56 | 8.4% |
| Change Contribution By: | |||
| Total Revenues ($ Mil) | 24,013 | 25,107 | 4.6% |
| Net Income Margin (%) | 14.2% | 15.9% | 12.2% |
| P/E Multiple | 42.9 | 39.0 | -9.0% |
| Shares Outstanding (Mil) | 716 | 705 | 1.6% |
| Cumulative Contribution | 8.4% |
Market Drivers
8/31/2025 to 9/23/2026| Return | Correlation | |
|---|---|---|
| DHR | 8.4% | |
| Market (SPY) | 20.3% | 17.2% |
| Sector (XLV) | 25.0% | 52.8% |
Fundamental Drivers
The -4.3% change in DHR stock from 8/31/2023 to 9/23/2026 was primarily driven by a -42.2% change in the company's Net Income Margin (%).| (LTM values as of) | 8312023 | 9232026 | Change |
|---|---|---|---|
| Stock Price ($) | 231.43 | 221.56 | -4.3% |
| Change Contribution By: | |||
| Total Revenues ($ Mil) | 23,065 | 25,107 | 8.9% |
| Net Income Margin (%) | 27.6% | 15.9% | -42.2% |
| P/E Multiple | 26.8 | 39.0 | 45.5% |
| Shares Outstanding (Mil) | 737 | 705 | 4.5% |
| Cumulative Contribution | -4.3% |
Market Drivers
8/31/2023 to 9/23/2026| Return | Correlation | |
|---|---|---|
| DHR | -4.3% | |
| Market (SPY) | 77.0% | 41.0% |
| Sector (XLV) | 33.2% | 59.3% |
Price Returns Compared
| 2021 | 2022 | 2023 | 2024 | 2025 | 2026 | Total [1] | |
|---|---|---|---|---|---|---|---|
| Returns | |||||||
| DHR Return | 49% | -19% | -1% | -0% | 0% | -3% | 15% |
| Peers Return | 23% | -17% | -8% | -1% | 2% | 27% | 20% |
| S&P 500 Return | 27% | -19% | 24% | 23% | 16% | 13% | 107% |
Monthly Win Rates [3] | |||||||
| DHR Win Rate | 83% | 33% | 50% | 42% | 42% | 56% | |
| Peers Win Rate | 67% | 42% | 47% | 50% | 53% | 58% | |
| S&P 500 Win Rate | 75% | 42% | 67% | 75% | 67% | 56% | |
Max Drawdowns [4] | |||||||
| DHR Max Drawdown | -14% | -28% | -25% | -19% | -30% | -33% | |
| Peers Max Drawdown | -19% | -33% | -33% | -19% | -34% | -28% | |
| S&P 500 Max Drawdown | -5% | -25% | -10% | -8% | -19% | -9% | |
[1] Cumulative total returns since the beginning of 2021
[2] Peers: TMO, A, ABT, BDX, ILMN. See DHR Returns vs. Peers.
[3] Win Rate = % of calendar months in which monthly returns were positive
[4] Max drawdown represents maximum peak-to-trough decline within a year
[5] 2026 data is for the year up to 9/23/2026 (YTD)
How Low Can It Go
| Event | DHR | S&P 500 |
|---|---|---|
| 2025 US Tariff Shock | ||
| % Loss | -14.7% | -18.8% |
| % Gain to Breakeven | 17.2% | 23.1% |
| Time to Breakeven | 64 days | 79 days |
| Summer-Fall 2023 Five Percent Yield Shock | ||
| % Loss | -18.4% | -9.5% |
| % Gain to Breakeven | 22.6% | 10.5% |
| Time to Breakeven | 45 days | 24 days |
| 2023 SVB Regional Banking Crisis | ||
| % Loss | -13.3% | -6.7% |
| % Gain to Breakeven | 15.4% | 7.1% |
| Time to Breakeven | 71 days | 31 days |
| 2022 Inflation Shock & Fed Tightening | ||
| % Loss | -24.8% | -24.5% |
| % Gain to Breakeven | 33.1% | 32.4% |
| Time to Breakeven | 813 days | 427 days |
| 2020 COVID-19 Crash | ||
| % Loss | -25.9% | -33.7% |
| % Gain to Breakeven | 35.0% | 50.9% |
| Time to Breakeven | 32 days | 140 days |
| Q4 2018 Fed Policy Error / Growth Scare | ||
| % Loss | -12.6% | -19.2% |
| % Gain to Breakeven | 14.4% | 23.8% |
| Time to Breakeven | 37 days | 105 days |
In The Past
Danaher's stock fell -14.7% during the 2025 US Tariff Shock. Such a loss loss requires a 17.2% gain to breakeven.
Preserve Wealth
Limiting losses and compounding gains is essential to preserving wealth.
Asset Allocation
Actively managed asset allocation strategies protect wealth. Learn more.
| Event | DHR | S&P 500 |
|---|---|---|
| 2022 Inflation Shock & Fed Tightening | ||
| % Loss | -24.8% | -24.5% |
| % Gain to Breakeven | 33.1% | 32.4% |
| Time to Breakeven | 813 days | 427 days |
| 2020 COVID-19 Crash | ||
| % Loss | -25.9% | -33.7% |
| % Gain to Breakeven | 35.0% | 50.9% |
| Time to Breakeven | 32 days | 140 days |
| 2011 US Debt Ceiling Crisis & European Contagion | ||
| % Loss | -21.8% | -17.9% |
| % Gain to Breakeven | 27.8% | 21.8% |
| Time to Breakeven | 112 days | 123 days |
| 2008-2009 Global Financial Crisis | ||
| % Loss | -45.7% | -53.4% |
| % Gain to Breakeven | 84.1% | 114.4% |
| Time to Breakeven | 605 days | 1085 days |
In The Past
Danaher's stock fell -14.7% during the 2025 US Tariff Shock. Such a loss loss requires a 17.2% gain to breakeven.
Preserve Wealth
Limiting losses and compounding gains is essential to preserving wealth.
Asset Allocation
Actively managed asset allocation strategies protect wealth. Learn more.
About Danaher (DHR)
Danaher Corporation (DHR) is a global diversified science and technology innovator that designs, manufactures, and markets a broad range of professional, medical, industrial, and commercial products and services. Its Life Sciences segment is a key driver, providing critical tools and technologies that support scientific research and biopharmaceutical development. This includes advanced instruments like mass spectrometers and microscopes, genomics consumables, lab automation, and bioprocess solutions for filtration and purification. These offerings are essential for pharmaceutical and biopharmaceutical companies, universities, research institutions, and various industrial manufacturers to advance drug discovery, development, and manufacturing.
Beyond life sciences research, Danaher’s Diagnostics segment focuses on enabling precise disease detection and patient management. It supplies hospitals, reference laboratories, and physician offices with a comprehensive suite of clinical instruments, reagents, and software for chemistry, immunoassay, microbiology, hematology, and pathology diagnostics. Completing its portfolio is the Environmental & Applied Solutions segment, which addresses vital industrial and commercial needs. This segment offers advanced instrumentation and disinfection systems for water analysis and and treatment across residential, commercial, and industrial applications, ensuring water quality. Additionally, it provides solutions for color and appearance management, as well as marking, coding, and traceability for packaging across consumer, pharmaceutical, and industrial products.
AI Analysis | Feedback
Here are 1-3 brief analogies for Danaher:
- Danaher is like the 'Intel Inside' for scientific and medical industries, providing the critical instruments, software, and consumables that power labs, hospitals, and biopharmaceutical manufacturing.
- Think of Danaher as a high-tech 3M, providing a diverse array of specialized instruments and solutions for scientific research, healthcare diagnostics, and environmental management.
AI Analysis | Feedback
- Life Sciences Instrumentation: Provides mass spectrometers, flow cytometers, microscopes, and related lab automation tools and consumables for research and development.
- Bioprocess Technologies: Offers technologies, consumables, and services for biopharmaceutical manufacturing, including filtration, separation, and purification.
- Diagnostics Systems: Supplies clinical instruments, reagents, and software for a broad range of diagnostic testing, including chemistry, immunoassay, microbiology, and pathology.
- Water Quality Management: Develops instrumentation, consumables, and disinfection systems for analyzing, treating, and managing water quality across various applications.
- Product Identification & Color Management: Provides instruments, software, and services for color and appearance management, packaging design, printing, marking, coding, and traceability.
AI Analysis | Feedback
Danaher (DHR) primarily sells its products and services to other companies and institutions. Based on the provided background, its major customers are broadly categorized as follows:
-
Pharmaceutical and Biopharmaceutical Companies: These companies rely on Danaher's life sciences tools, bioprocess technologies, genomics consumables, and gene/cell therapy solutions, as well as packaging and marking systems. Examples include Pfizer (PFE), Johnson & Johnson (JNJ), and Merck & Co. (MRK).
-
Healthcare Providers and Diagnostic Laboratories: This category includes hospitals, physicians' offices, reference laboratories, and other critical care settings that utilize Danaher's diagnostics systems, reagents, consumables, and services. Examples include Quest Diagnostics (DGX) and LabCorp (LH).
-
Academic and Research Institutions: Universities, medical schools, and research institutions are significant customers for Danaher's various life sciences instruments and consumables like mass spectrometers, microscopes, and lab automation. These are typically non-profit or government-funded entities and do not have stock symbols.
-
Industrial, Commercial, and Food & Beverage Companies: This broad group encompasses industrial manufacturers, food and beverage companies, consumer product companies, and commercial entities that rely on Danaher's environmental solutions for water analysis and treatment, as well as instruments for color and appearance management, packaging, printing, marking, and coding. Examples include PepsiCo (PEP) and various industrial manufacturing firms.
AI Analysis | Feedback
AI Analysis | Feedback
Rainer M. Blair, President and Chief Executive Officer
Rainer M. Blair has served as President and Chief Executive Officer of Danaher since September 2020 and has been a director since 2020. He joined Danaher in 2010 and held various leadership roles, including Executive Vice President of Danaher's Life Sciences platform from 2017 to September 2020 and Vice President–Group Executive from 2014 to 2017. Prior to joining Danaher, he was President and CEO of MAPEI Americas and held leadership positions with BASF Group across three continents. Mr. Blair is also a U.S. Army veteran and serves on Nestlé's board of directors.
Matthew M. McGrew, Executive Vice President and Chief Financial Officer
Matthew M. McGrew has served as Danaher's Executive Vice President and Chief Financial Officer since January 2019. He joined Danaher in 2004 as Director, M&A Finance and has held roles of increasing responsibility, including Vice President of Investor Relations from 2009 to 2014 and a Danaher Group CFO from 2012 to 2018. Prior to joining Danaher, Mr. McGrew was a director in the Transaction Services Group at KPMG. He is slated to step down from his CFO role effective February 28, 2026, and will continue as an Executive Vice President as he transitions to retirement.
Julie Sawyer Montgomery, Executive Vice President, Danaher Diagnostics Platform
Julie Sawyer Montgomery serves as the Executive Vice President of Danaher's Diagnostics Platform.
Greg Milosevich, Executive Vice President, Life Sciences
Greg Milosevich holds the position of Executive Vice President for Danaher's Life Sciences segment.
Chris Riley, Executive Vice President, Biotechnology Group and CEO, Cytiva
Chris Riley is the Executive Vice President of Danaher's Biotechnology Group and also serves as the CEO of Cytiva.
AI Analysis | Feedback
- High Capital Intensity, Debt, and Acquisition-Related Risks: Danaher is a capital-intensive business with significant capital needs and mounting debt levels, often used to finance acquisitions. There is a risk that acquisitions may not be successful, leading to increased debt and integration challenges. For example, the acquisition of Masimo has raised concerns about higher debt levels and integration risks.
- Declining Organic Revenue Growth and Profitability: The company has experienced declining organic revenue growth, suggesting that its core business may be underperforming due to decreasing demand. This trend could necessitate improvements in product offerings, pricing strategies, or market approaches. Additionally, Danaher has seen shrinking adjusted operating margins and a declining Return on Invested Capital (ROIC), indicating potential challenges in capital efficiency and overall profitability.
- Legal & Regulatory Risks and Governance Scrutiny: Danaher faces legal and regulatory risks, including the potential for changes in governmental regulations to reduce demand for its products or increase expenses. Furthermore, there is ongoing scrutiny, including investigations by law firms, into potential breaches of fiduciary duties by certain officers and directors, particularly concerning capital allocation decisions related to large acquisitions like Masimo. Such investigations can impact investor confidence in future mergers and acquisitions and overall governance.
AI Analysis | Feedback
The clear emerging threat for Danaher is the rapid advancement and adoption of **point-of-care (POC) testing and non-invasive diagnostic technologies** in the healthcare industry.
Danaher's Diagnostics segment primarily provides clinical instruments, reagents, consumables, software, and services for centralized laboratories, hospitals, and reference labs. This established model is increasingly challenged by highly accurate, comprehensive, and cost-effective diagnostic devices that can be used directly at the patient's bedside, in physicians' offices, or even at home, reducing the need for large, traditional lab setups.
This trend is analogous to how Apple's iPhone disrupted Research in Motion's BlackBerry by offering a more convenient and versatile platform that eventually rendered dedicated communication devices less appealing, or how Netflix's on-demand streaming model disrupted Blockbuster's physical rental business. Similarly, the ability to obtain diagnostic results quickly and conveniently at the point of care, or even through entirely non-invasive means, poses a direct threat to the demand for Danaher's core centralized lab diagnostic systems and associated consumables.
AI Analysis | Feedback
Addressable Markets for Danaher Corporation (DHR)
Danaher Corporation operates across three main segments: Life Sciences, Diagnostics, and Environmental & Applied Solutions, each serving significant global markets.Life Sciences Segment
- Mass Spectrometry: The global mass spectrometry market size was estimated at USD 6.6 billion in 2024 and is projected to reach USD 10.65 billion by 2030. Another estimate places the global market at USD 8.17 billion in 2025, growing to approximately USD 17.75 billion by 2035.
- Flow Cytometry: The global flow cytometry market size was valued at USD 6.66 billion in 2025 and is projected to grow to USD 14.12 billion by 2034. Alternatively, the global market was accounted at USD 6.13 billion in 2025, expected to reach around USD 12.97 billion by 2035.
- Genomics: The global genomics market is projected to reach USD 85.09 billion by 2030 from USD 47.07 billion in 2025. Another forecast indicates the global genomics market size is expected to reach USD 175.18 billion by 2034, increasing from USD 44.21 billion in 2025. For genomics services specifically, the global market was valued at USD 9.80 billion in 2025 and is projected to grow to USD 30.85 billion by 2034.
- Lab Automation: The global laboratory automation market size was valued at USD 9.2 billion in 2025 and is projected to grow to USD 20.71 billion by 2034. Another report estimates the global lab automation market size at USD 8.36 billion in 2025, increasing to approximately USD 14.78 billion by 2034.
- Bioprocess Technologies: The global bioprocess technology market size was valued at USD 31.21 billion in 2024 and is estimated to reach USD 55.73 billion by 2033. Another source projects the global market to grow from USD 34.4 billion in 2025 to USD 141.5 billion by 2035.
- Gene and Cell Therapy Manufacturing: The global cell and gene therapy manufacturing market size was estimated at USD 21.15 billion in 2025 and is projected to hit around USD 215.18 billion by 2035. Another report indicates the global market will grow from USD 19.3 billion in 2024 to an estimated USD 146.2 billion by 2032.
- Pharmaceutical Filtration: The global pharmaceutical filtration market size is projected to grow from USD 13.21 billion in 2025 to USD 22.54 billion by 2032. Another source states the global market size was USD 13.64 billion in 2025, predicted to reach approximately USD 20.38 billion by 2034.
Diagnostics Segment
- In Vitro Diagnostics (IVD): The global in vitro diagnostics market size was estimated at USD 106.29 billion in 2025 and is projected to reach USD 128.18 billion by 2033. Other estimates for the global market include USD 77.73 billion in 2025, reaching USD 135.65 billion by 2034, USD 104.01 billion in 2025, reaching around USD 135.76 billion by 2035, and USD 122.6 billion in 2025, reaching USD 186.6 billion by 2034.
Environmental & Applied Solutions Segment
- Water Analysis Instrumentation: The global water analysis instrumentation market is projected to grow from USD 4.1 billion in 2025 to USD 7.1 billion by 2035. Another source indicates the global market size is estimated to reach over USD 8.20 billion by 2032 from a value of USD 4.78 billion in 2024. The global market size was also reported as USD 4.09 billion in 2026, reaching USD 6.37 billion by 2035.
- Color and Appearance Management (Software and Instruments): The global market for Color Management Software was estimated to be worth US$ 972 million in 2025 and is projected to reach US$ 1437 million by 2032. The global Color Management Comprehensive Measuring Instrument market was valued at USD 84.5 million in 2024 and is projected to reach USD 109 million by 2031.
- Product Identification, Marking, Coding, and Traceability: Null
AI Analysis | Feedback
Danaher Corporation (DHR) is expected to drive future revenue growth over the next 2-3 years through several key initiatives and market trends:
- Strong Bioprocessing Segment Growth: Danaher anticipates high single-digit growth in its bioprocessing business, particularly fueled by continued strength in consumables and increasing demand for monoclonal antibodies and biosimilar production. This segment is consistently highlighted as a primary driver of overall revenue growth.
- Continuous Innovation and New Product Launches: The company is focused on accelerating investments in innovation, leading to the launch of several impactful new products and technologies across its Life Sciences and Diagnostics segments. Recent examples include the expansion of Cytiva's Xcellerex X-platform bioreactor, the introduction of SCIEX's ZenoTOF 8600 mass spectrometer, and the expansion of Beckman Coulter Diagnostics' immunoassay platform. New product revenue has recently contributed significantly to growth.
- Strategic Acquisitions: Danaher has a proven track record of strategic acquisitions to enhance its portfolio, expand into attractive markets, and acquire companies with strong market positions and recurring revenue streams. Management views the M&A environment as more constructive, with a strong balance sheet ready for strategic acquisitions. Recent notable acquisitions include Masimo, expected to be accretive and enhance growth and margins.
- Improving Momentum in Diagnostics and Life Sciences End Markets: While some areas faced challenges, Danaher expects a gradual improvement in its broader Diagnostics and Life Sciences end markets. This includes sustained growth in non-respiratory Cepheid revenue, with particular strength in areas like sexual health and virology assays, driven by increasing menu adoption and system utilization, as well as geographic expansion opportunities.
AI Analysis | Feedback
Share Repurchases
- Danaher's annual share buybacks totaled $5.979 billion in 2024.
- In 2025, annual share buybacks for Danaher amounted to $3.088 billion.
- The trailing twelve months (TTM) annual share buybacks for DHR stock were $772 million.
Outbound Investments
- Danaher announced plans in February 2026 to acquire Masimo Corporation for an enterprise value of $9.9 billion, with the deal projected to close in the second half of 2026.
- In 2023, Danaher completed the acquisition of Abcam for approximately $5.7 billion.
- Danaher invested $9.6 billion in the acquisition of Aldevron in 2021.
Capital Expenditures
- Danaher's capital expenditures for fiscal year 2024 reached a peak of $1.392 billion.
- Capital expenditures for fiscal year 2025 were $1.156 billion.
- From fiscal years 2021 to 2025, Danaher's capital expenditures averaged $1.258 billion annually.
Peer Outperformance in Life Sciences Tools & Services
| Ticker | Name | Rev Growth 3Y Avg | P/E | 1Y | 3Y | 5Y | 5Y Gap |
|---|---|---|---|---|---|---|---|
| DHR | Danaher | 2.9% | 39.0x | 17.6% | 2.1% | -21.2% | — |
| TMO | Thermo Fisher Scientific | 2.2% | 35.4x | 42.1% | 33.6% | 10.7% | +32pp |
| IQV | IQVIA | 5.0% | 32.4x | 43.7% | 34.8% | 2.4% | +24pp |
| A | Agilent Technologies | 2.0% | 32.4x | 32.3% | 51.8% | -0.6% | +21pp |
| Industry | Names | 1Y med | 3Y med | 5Y med | Top 3 by 5Y |
|---|---|---|---|---|---|
| Health Care Distributors | 6 | 11.6% | 44.3% | 89.1% | CAH 382% · MCK 344% · COR 169% |
| Managed Health Care | 8 | 33.1% | -7.9% | -0.7% | OSCR 80% · HQY 37% · ELV 12% |
| Health Care Services | 20 | 18.1% | 34.7% | -2.4% | HIMS 250% · RDNT 151% · DGX 68% |
| Health Care Facilities | 24 | 5.4% | 11.5% | -4.7% | NHC 271% · THC 259% · ENSG 135% |
| Health Care Equipment | 50 | -1.9% | -1.3% | -20.7% | POCI 11788% · UFPT 362% · GKOS 203% |
| Health Care Supplies | 12 | 20.3% | -6.4% | -38.9% | LNTH 271% · HAE 54% · MMSI 20% |
| Pharmaceuticals | 63 | -9.2% | 9.6% | -40.4% | LQDA 2252% · INDV 1097% · ETON 1010% |
| Life Sciences Tools & Services ← | 113 | 4.7% | -9.1% | -68.4% | SNWV 1820% · NTRA 231% · MEDP 211% |
| Health Care Technology | 21 | -26.8% | -50.0% | -78.6% | SPOK 71% · HSTM 1% · VEEV -10% |
| Biotechnology | 378 | -4.0% | -21.9% | -79.0% | CELZ 1291% · DNTH 1151% · ELVN 997% |
Latest Trefis Analyses
| Title | Date | |
|---|---|---|
| DASHBOARDS | ||
| Danaher stock vs Agilent Technologies stock: Which Is A Better Investment? | 08/05/2026 | |
| Reading Between The Lines Of DHR's Latest Call | 07/24/2026 | |
| Danaher Earnings Notes | 07/18/2026 | |
| Danaher Stock Now 3.8% Cheaper, Time To Buy | 12/16/2025 | |
| How Low Can Danaher Stock Really Go? | 10/17/2025 | |
| DHR Leadership & 32% Price Drop - Time to Buy? | 10/15/2025 | |
| Now Is Not The Time To Buy Danaher Stock | 10/04/2025 | |
| ARTICLES | ||
| Reading Between The Lines Of DHR’s Latest Call | 07/24/2026 | |
| S&P 500 Movers | Winners: SNDK, WDC, MU | Losers: DHR, MSCI, TYL | 07/22/2026 | |
| How Will Danaher Stock React To Its Upcoming Earnings? | 07/20/2026 | |
| TMO, IQV Look Smarter Buy Than Danaher Stock | 06/25/2026 | |
| Agilent Technologies or Danaher: Which Stock Has More Upside? | 05/13/2026 |
Research & Analysis
Invest in Strategies
Wealth Management
Peer Comparisons
| Peers to compare with: |
Financials
| Median | |
|---|---|
| Name | |
| Mkt Price | 202.04 |
| Mkt Cap | 103.2 |
| Rev LTM | 24,178 |
| Op Inc LTM | 4,236 |
| FCF LTM | 3,988 |
| FCF 3Y Avg | 3,952 |
| CFO LTM | 4,948 |
| CFO 3Y Avg | 4,952 |
Growth & Margins
| Median | |
|---|---|
| Name | |
| Rev Chg LTM | 7.6% |
| Rev Chg 3Y Avg | 2.5% |
| Rev Chg Q | 8.7% |
| QoQ Delta Rev Chg LTM | 2.1% |
| Op Inc Chg LTM | 10.9% |
| Op Inc Chg 3Y Avg | 6.3% |
| Op Mgn LTM | 19.1% |
| Op Mgn 3Y Avg | 17.2% |
| QoQ Delta Op Mgn LTM | 0.2% |
| CFO/Rev LTM | 21.5% |
| CFO/Rev 3Y Avg | 20.8% |
| FCF/Rev LTM | 17.0% |
| FCF/Rev 3Y Avg | 17.0% |
Valuation
| Median | |
|---|---|
| Name | |
| Mkt Cap | 103.2 |
| P/S | 5.8 |
| P/Op Inc | 28.8 |
| P/EBIT | 26.8 |
| P/E | 37.2 |
| P/CFO | 25.5 |
| Total Yield | 3.4% |
| Dividend Yield | 0.6% |
| FCF Yield 3Y Avg | 3.8% |
| D/E | 0.2 |
| Net D/E | 0.1 |
Returns
| Median | |
|---|---|
| Name | |
| 1M Rtn | 4.4% |
| 3M Rtn | 25.0% |
| 6M Rtn | 27.3% |
| 12M Rtn | 30.0% |
| 3Y Rtn | 22.9% |
| 1M Excs Rtn | 3.8% |
| 3M Excs Rtn | 20.3% |
| 6M Excs Rtn | 9.7% |
| 12M Excs Rtn | 14.6% |
| 3Y Excs Rtn | -52.3% |
Comparison Analyses
Segment Financials
Revenue by Segment| $ Mil | 2025 | 2024 | 2023 | 2022 | 2021 |
|---|---|---|---|---|---|
| Diagnostics | 9,941 | 9,787 | 9,577 | 10,849 | 9,844 |
| Life Sciences | 7,334 | 7,329 | 7,141 | 7,036 | 6,388 |
| Biotechnology | 7,293 | 6,759 | 7,172 | 8,758 | 8,570 |
| Other | 0 | 0 | 0 | 0 | |
| Total | 24,568 | 23,875 | 23,890 | 26,643 | 24,802 |
| $ Mil | 2025 | 2024 | 2023 | 2022 | 2021 |
|---|---|---|---|---|---|
| Diagnostics | 2,650 | 2,625 | 2,406 | 3,436 | 2,313 |
| Biotechnology | 1,864 | 1,685 | 1,909 | 3,008 | 3,074 |
| Life Sciences | 520 | 879 | 1,209 | 1,414 | 1,293 |
| Other | -344 | -326 | -322 | -322 | -303 |
| Total | 4,690 | 4,863 | 5,202 | 7,536 | 6,377 |
| $ Mil | 2025 | 2024 | 2023 | 2022 | 2021 |
|---|---|---|---|---|---|
| Biotechnology | 37,337 | 34,605 | 37,421 | 37,536 | 38,118 |
| Life Sciences | 23,112 | 23,211 | 23,730 | 17,572 | 19,768 |
| Diagnostics | 14,748 | 14,204 | 14,552 | 14,722 | 15,054 |
| Other | 8,267 | 5,522 | 8,785 | 9,739 | 5,407 |
| Discontinued operations | 4,781 | 4,837 | |||
| Total | 83,464 | 77,542 | 84,488 | 84,350 | 83,184 |
Price Behavior
| Market Price | $221.56 | |
| Market Cap ($ Bil) | 156.3 | |
| First Trading Date | 12/29/2006 | |
| Distance from 52W High | -8.1% | |
| 50 Days | 200 Days | |
| DMA Price | $205.04 | $201.33 |
| DMA Trend | indeterminate | up |
| Distance from DMA | 8.1% | 10.0% |
| 3M | 1YR | |
| Volatility | 37.5% | 31.6% |
| Downside Capture | -63.53 | 31.04 |
| Upside Capture | 30.26 | 44.19 |
| Correlation (SPY) | -10.7% | 18.3% |
| 1M | 2M | 3M | 6M | 1Y | 3Y | |
|---|---|---|---|---|---|---|
| Beta | 0.08 | -0.73 | -0.30 | 0.31 | 0.39 | 0.77 |
| Up Beta | -1.14 | -1.52 | -1.21 | 0.18 | 0.32 | 0.90 |
| Down Beta | 0.53 | -1.17 | 0.78 | 1.00 | 0.68 | 0.81 |
| Up Capture | 126% | 9% | -2% | 10% | 21% | 25% |
| Bmk +ve Days | 10 | 21 | 32 | 68 | 138 | 427 |
| Stock +ve Days | 12 | 23 | 34 | 65 | 123 | 384 |
| Down Capture | -32% | -93% | -99% | 14% | 39% | 90% |
| Bmk -ve Days | 11 | 21 | 32 | 59 | 113 | 324 |
| Stock -ve Days | 9 | 19 | 30 | 62 | 128 | 367 |
[1] Upside and downside betas calculated using positive and negative benchmark daily returns respectively
Based On 1-Year Data
| Annualized Return | Annualized Volatility | Sharpe Ratio | Correlation with DHR | |
|---|---|---|---|---|
| DHR | 17.3% | 31.5% | 0.52 | - |
| Sector ETF (XLV) | 25.2% | 16.1% | 1.20 | 52.7% |
| Equity (SPY) | 16.2% | 13.0% | 0.88 | 18.1% |
| Gold (GLD) | 13.9% | 29.3% | 0.44 | 3.0% |
| Commodities (DBC) | 46.6% | 20.7% | 1.75 | -20.8% |
| Real Estate (VNQ) | 4.5% | 13.7% | 0.08 | 27.0% |
| Bitcoin (BTCUSD) | -23.2% | 44.8% | -0.46 | 9.7% |
Smart multi-asset allocation framework can stack odds in your favor. Learn How
Based On 5-Year Data
| Annualized Return | Annualized Volatility | Sharpe Ratio | Correlation with DHR | |
|---|---|---|---|---|
| DHR | -4.7% | 29.0% | -0.15 | - |
| Sector ETF (XLV) | 6.6% | 15.2% | 0.25 | 64.9% |
| Equity (SPY) | 12.9% | 17.2% | 0.57 | 52.3% |
| Gold (GLD) | 18.6% | 18.8% | 0.80 | 7.4% |
| Commodities (DBC) | 10.5% | 19.5% | 0.41 | 3.1% |
| Real Estate (VNQ) | 0.8% | 18.9% | -0.06 | 49.1% |
| Bitcoin (BTCUSD) | 12.5% | 52.6% | 0.41 | 18.6% |
Smart multi-asset allocation framework can stack odds in your favor. Learn How
Based On 10-Year Data
| Annualized Return | Annualized Volatility | Sharpe Ratio | Correlation with DHR | |
|---|---|---|---|---|
| DHR | 13.1% | 26.2% | 0.49 | - |
| Sector ETF (XLV) | 10.8% | 16.7% | 0.53 | 67.9% |
| Equity (SPY) | 15.5% | 17.9% | 0.73 | 58.4% |
| Gold (GLD) | 12.1% | 16.4% | 0.60 | 7.4% |
| Commodities (DBC) | 8.5% | 18.1% | 0.38 | 10.3% |
| Real Estate (VNQ) | 4.9% | 20.7% | 0.20 | 47.4% |
| Bitcoin (BTCUSD) | 64.2% | 66.2% | 1.04 | 13.6% |
Smart multi-asset allocation framework can stack odds in your favor. Learn How
Returns Analyses
Earnings Returns History
Updated 8/21/2026| Forward Returns | |||
|---|---|---|---|
| Earnings Date | 1D Returns | 5D Returns | 21D Returns |
| 7/21/2026 | 0.1% | 11.2% | 18.1% |
| 4/21/2026 | -5.4% | -8.0% | -12.0% |
| 1/28/2026 | -2.2% | -2.2% | -6.2% |
| 10/21/2025 | -1.2% | -1.8% | 0.7% |
| 7/22/2025 | 4.2% | 8.9% | 11.3% |
| 4/22/2025 | 3.8% | 5.9% | 6.9% |
| 1/29/2025 | -0.3% | -5.2% | -7.1% |
| 10/22/2024 | -2.0% | -7.1% | -10.8% |
| ... | |||
| SUMMARY STATS | |||
| # Positive | 12 | 12 | 13 |
| # Negative | 12 | 12 | 11 |
| Median Positive | 1.8% | 3.8% | 5.6% |
| Median Negative | -2.0% | -2.5% | -6.2% |
| Max Positive | 4.2% | 11.2% | 18.1% |
| Max Negative | -5.4% | -8.0% | -12.0% |
| Forward Returns | |||
|---|---|---|---|
| Earnings Date | 1D Returns | 5D Returns | 21D Returns |
| 7/21/2026 | 0.1% | 11.2% | 18.1% |
| 4/21/2026 | -5.4% | -8.0% | -12.0% |
| 1/28/2026 | -2.2% | -2.2% | -6.2% |
| 10/21/2025 | -1.2% | -1.8% | 0.7% |
| 7/22/2025 | 4.2% | 8.9% | 11.3% |
| 4/22/2025 | 3.8% | 5.9% | 6.9% |
| 1/29/2025 | -0.3% | -5.2% | -7.1% |
| 10/22/2024 | -2.0% | -7.1% | -10.8% |
| 7/23/2024 | 0.6% | 4.2% | 2.6% |
| 4/23/2024 | -1.1% | -2.6% | 5.6% |
| 1/30/2024 | -2.1% | 1.3% | 3.3% |
| 10/24/2023 | -2.1% | -2.4% | 12.4% |
| 7/25/2023 | 3.6% | -0.3% | -0.3% |
| 4/25/2023 | 0.2% | 4.7% | -1.8% |
| 1/24/2023 | -3.2% | -2.7% | -7.0% |
| 10/20/2022 | 0.6% | 2.1% | 7.2% |
| 7/21/2022 | -1.9% | 3.5% | 4.7% |
| 4/21/2022 | -4.9% | -7.6% | -9.5% |
| 1/27/2022 | 4.1% | 7.4% | 1.6% |
| 10/21/2021 | 0.8% | -2.0% | 1.1% |
| 7/22/2021 | 0.8% | 3.0% | 11.3% |
| 4/22/2021 | 2.7% | 1.4% | -0.1% |
| 1/28/2021 | 4.1% | 3.0% | -1.3% |
| 10/22/2020 | -0.6% | -1.7% | -3.5% |
| SUMMARY STATS | |||
| # Positive | 12 | 12 | 13 |
| # Negative | 12 | 12 | 11 |
| Median Positive | 1.8% | 3.8% | 5.6% |
| Median Negative | -2.0% | -2.5% | -6.2% |
| Max Positive | 4.2% | 11.2% | 18.1% |
| Max Negative | -5.4% | -8.0% | -12.0% |
SEC Filings
Expand for More| Report Date | Filing Date | Filing |
|---|---|---|
| 06/30/2026 | 07/21/2026 | 10-Q |
| 03/31/2026 | 04/21/2026 | 10-Q |
| 12/31/2025 | 02/24/2026 | 10-K |
| 09/30/2025 | 10/21/2025 | 10-Q |
| 06/30/2025 | 07/22/2025 | 10-Q |
| 03/31/2025 | 04/22/2025 | 10-Q |
| 12/31/2024 | 02/20/2025 | 10-K |
| 09/30/2024 | 10/22/2024 | 10-Q |
| 06/30/2024 | 07/23/2024 | 10-Q |
| 03/31/2024 | 04/23/2024 | 10-Q |
| 12/31/2023 | 02/21/2024 | 10-K |
| 09/30/2023 | 10/24/2023 | 10-Q |
| 06/30/2023 | 07/25/2023 | 10-Q |
| 03/31/2023 | 04/25/2023 | 10-Q |
| 12/31/2022 | 02/22/2023 | 10-K |
| 09/30/2022 | 10/20/2022 | 10-Q |
| Report Date | Filing Date | Filing |
|---|---|---|
| 06/30/2026 | 07/21/2026 | 10-Q |
| 03/31/2026 | 04/21/2026 | 10-Q |
| 12/31/2025 | 02/24/2026 | 10-K |
| 09/30/2025 | 10/21/2025 | 10-Q |
| 06/30/2025 | 07/22/2025 | 10-Q |
| 03/31/2025 | 04/22/2025 | 10-Q |
| 12/31/2024 | 02/20/2025 | 10-K |
| 09/30/2024 | 10/22/2024 | 10-Q |
| 06/30/2024 | 07/23/2024 | 10-Q |
| 03/31/2024 | 04/23/2024 | 10-Q |
| 12/31/2023 | 02/21/2024 | 10-K |
| 09/30/2023 | 10/24/2023 | 10-Q |
| 06/30/2023 | 07/25/2023 | 10-Q |
| 03/31/2023 | 04/25/2023 | 10-Q |
| 12/31/2022 | 02/22/2023 | 10-K |
| 09/30/2022 | 10/20/2022 | 10-Q |
| 06/30/2022 | 07/21/2022 | 10-Q |
| 03/31/2022 | 04/21/2022 | 10-Q |
| 12/31/2021 | 02/23/2022 | 10-K |
| 09/30/2021 | 10/21/2021 | 10-Q |
| 06/30/2021 | 07/22/2021 | 10-Q |
| 03/31/2021 | 04/22/2021 | 10-Q |
| 12/31/2020 | 02/25/2021 | 10-K |
| 09/30/2020 | 10/22/2020 | 10-Q |
| 06/30/2020 | 07/23/2020 | 10-Q |
| 03/31/2020 | 05/06/2020 | 10-Q |
| 12/31/2019 | 02/21/2020 | 10-K |
| 09/30/2019 | 10/24/2019 | 10-Q |
Recent Forward Guidance
Updated 7/22/2026Latest: Q2 2026 Earnings Reported 7/21/2026
| Forward Guidance | Guidance Change | |||||||
|---|---|---|---|---|---|---|---|---|
| Metric | Source | Low | Mid | High | % Chg | % Delta | Change | Prior |
| Q3 2026 Amortization of acquisition-related intangible assets | Reported | -500.00 Mil | ||||||
| Q3 2026 Corporate expense | Reported | -90.00 Mil | Lowered | Guidance: 90.00 Mil for Q2 2026 | ||||
| Q3 2026 Core Revenue Growth | Reported | 2.0% | 2.5% | 3.0% | ||||
| Q3 2026 Adjusted Operating Profit Margin | Reported | 26.5% | 0 | Affirmed | Guidance: 26.5% for Q2 2026 | |||
| Q3 2026 Interest expense, net | Reported | -115.00 Mil | Lowered | Guidance: 40.00 Mil for Q2 2026 | ||||
| Q3 2026 Effective tax rate | Reported | 17.0% | 0 | Affirmed | Guidance: 17.0% for Q2 2026 | |||
| 2026 Adjusted Diluted Net Earnings Per Common Share | Reported | 8.45 | 8.53 | 8.6 | Raised | Guidance: 8.45 for 2026 | ||
| 2026 Amortization of acquisition-related intangible assets | Reported | -1.90 Bil | ||||||
| 2026 Corporate expense | Reported | -360.00 Mil | Affirmed | Guidance: 360.00 Mil for 2026 | ||||
| 2026 Core Revenue Growth | Reported | 3.0% | 3.5% | 4.0% | -22.2% | -1.0% | Lowered | Guidance: 4.5% for 2026 |
| 2026 Interest expense, net | Reported | -310.00 Mil | Lowered | Guidance: 140.00 Mil for 2026 | ||||
| 2026 Effective tax rate | Reported | 17.0% | 0 | Affirmed | Guidance: 17.0% for 2026 | |||
Prior: Q1 2026 Earnings Reported 4/21/2026
| Forward Guidance | Guidance Change | |||||||
|---|---|---|---|---|---|---|---|---|
| Metric | Source | Low | Mid | High | % Chg | % Delta | Change | Prior |
| Q2 2026 Corporate Expense | Reported | -90.00 Mil | ||||||
| Q2 2026 Core Sales Growth | Reported | 2.5% | 25.0% | 0.5% | Higher New | Guidance: 2.0% for Q1 2026 | ||
| Q2 2026 Adjusted Operating Profit Margin | Reported | 26.5% | ||||||
| Q2 2026 Interest Expense, net | Reported | -40.00 Mil | ||||||
| Q2 2026 Effective Tax Rate | Reported | 17.0% | ||||||
| 2026 Adjusted Diluted Net Earnings Per Common Share | Reported | 8.35 | 8.45 | 8.55 | 0.3% | Raised | Guidance: 8.43 for 2026 | |
| 2026 Corporate Expense | Reported | -360.00 Mil | ||||||
| 2026 Core Sales Growth | Reported | 3.0% | 4.5% | 6.0% | 0.0% | 0.0% | Affirmed | Guidance: 4.5% for 2026 |
| 2026 Cepheid Respiratory Revenue | Reported | 1.60 Bil | 1.65 Bil | 1.70 Bil | ||||
| 2026 Interest Expense, net | Reported | -140.00 Mil | ||||||
| 2026 Effective Tax Rate | Reported | 17.0% | ||||||
Q4 2025 Earnings Reported 1/28/2026
| Forward Guidance | Guidance Change | |||||||
|---|---|---|---|---|---|---|---|---|
| Metric | Source | Low | Mid | High | % Chg | % Delta | Change | Prior |
| Q1 2026 Non-GAAP Core Revenue Growth | Reported | 2.0% | ||||||
| Q1 2026 Adjusted Operating Profit Margin | Reported | 28.5% | ||||||
| 2026 Adjusted Diluted Net Earnings Per Common Share | Reported | 8.35 | 8.43 | 8.5 | 8.7% | 67.5% | Higher New | Actual: 7.75 for 2025 |
| 2026 Non-GAAP Core Revenue Growth | Reported | 3.0% | 4.5% | 6.0% | ||||
Q3 2025 Earnings Reported 10/21/2025
| Forward Guidance | Guidance Change | |||||||
|---|---|---|---|---|---|---|---|---|
| Metric | Source | Low | Mid | High | % Chg | % Delta | Change | Prior |
| 2025 Adjusted Diluted Net Earnings Per Common Share | Reported | 7.7 | 7.75 | 7.8 | 0.0% | Affirmed | Guidance: 7.75 for 2025 | |
| Q4 2025 Corporate Expense | Reported | -85.00 Mil | ||||||
| Q4 2025 Biotechnology Core Sales Growth | Reported | 5.0% | ||||||
| Q4 2025 Life Sciences Core Sales Growth | Reported | -2.0% | ||||||
| Q4 2025 Diagnostics Core Sales Growth | Reported | 0.0% | ||||||
| Q4 2025 Interest Expense, Net | Reported | -50.00 Mil | ||||||
| Q4 2025 Effective Tax Rate | Reported | 17.0% | ||||||
Insider Activity
Updated 8/24/2026| # | Owner | Title | Holding | Action | Filing Date | Price | Shares | Transacted Value | Value of Held Shares | Form |
|---|---|---|---|---|---|---|---|---|---|---|
| 1 | Blair, Rainer | President & CEO | Trust | Sell | 8242026 | 218.63 | 58,255 | Form | ||
| 2 | Spoon, Alan G | Direct | Sell | 5042026 | 174.67 | 1,358 | 237,207 | 21,675,904 | Form | |
| 3 | Milosevich, Gregory M | Executive Vice President | Direct | Sell | 2202026 | 208.01 | 1,320 | 274,575 | 1,060,648 | Form |
| 4 | Rales, Mitchell P | Chairman of Exec. Committee | Through the Mitchell P. Rales Family Trust | Sell | 11262025 | 230.38 | 40,625 | 9,359,067 | 195,820,472 | Form |
| 5 | List, Teri | Direct | Sell | 11192025 | 226.50 | 3,298 | 746,997 | 4,702,592 | Form |
| # | Owner | Title | Holding | Action | Filing Date | Price | Shares | Transacted Value | Value of Held Shares | Form |
|---|---|---|---|---|---|---|---|---|---|---|
| 1 | Blair, Rainer | President & CEO | Trust | Sell | 8242026 | 218.63 | 58,255 | Form | ||
| 2 | Spoon, Alan G | Direct | Sell | 5042026 | 174.67 | 1,358 | 237,207 | 21,675,904 | Form | |
| 3 | Milosevich, Gregory M | Executive Vice President | Direct | Sell | 2202026 | 208.01 | 1,320 | 274,575 | 1,060,648 | Form |
| 4 | Rales, Mitchell P | Chairman of Exec. Committee | Through the Mitchell P. Rales Family Trust | Sell | 11262025 | 230.38 | 40,625 | 9,359,067 | 195,820,472 | Form |
| 5 | List, Teri | Direct | Sell | 11192025 | 226.50 | 3,298 | 746,997 | 4,702,592 | Form | |
| 6 | Ellis, Brian W | Senior Vice President - GC | Direct | Sell | 11132025 | 219.23 | 21,776 | 4,773,863 | 3,190,394 | Form |
| 7 | Rales, Mitchell P | Chairman of Exec. Committee | Direct | Sell | 11132025 | 218.69 | 437,000 | 95,566,167 | 120,983,705 | Form |
| 8 | McGrew, Matthew | EVP & Chief Financial Officer | Direct | Sell | 11132025 | 214.62 | 16,172 | 3,470,831 | 4,305,702 | Form |
| 9 | Couchara, Georgeann | SVP, Human Resources | Direct | Sell | 11112025 | 210.42 | 5,174 | 1,088,704 | 552,348 | Form |
| 10 | Rales, Mitchell P | Chairman of Exec. Committee | Direct | Sell | 11042025 | 216.06 | 600,000 | 129,636,027 | 213,948,706 | Form |
| 11 | List, Teri | Direct | Sell | 8252025 | 211.06 | 2,778 | 586,319 | 4,379,595 | Form |
Investor Activity (13F)
Updated Sep 24, 2026Active managers (13F portfolio over $250M, at least 3 holdings) with a position over $5M that is either over 10% of their portfolio or held in a concentrated book of 50 or fewer total positions. Index/ETF, sovereign, bank, community-bank and charitable/donor-advised filers are excluded.
| Active Manager | Value | % of Portfolio | Total Positions | QoQ | Filing |
|---|---|---|---|---|---|
| Generation Investment Management LLP | $1.4 Bil | 12.4% | 29 | Hold | 13F |
| Defender Capital, LLC. | $29.9 Mil | 10.6% | 34 | Hold | 13F |
| Dorsey Asset Management, LLC | $110.0 Mil | 8.8% | 11 | TRIM -29.9% | 13F |
| Anomaly Capital Management, LP | $144.6 Mil | 8.8% | 21 | ADD +119.3% | 13F |
| Arvin Capital Management LP | $35.2 Mil | 8.2% | 23 | ADD +35.9% | 13F |
| 11 Capital Partners LP | $23.0 Mil | 7.5% | 19 | ADD +7.4% | 13F |
| Two Creeks Capital Management, LP | $67.4 Mil | 7.1% | 21 | ADD +33.0% | 13F |
| Weitz Investment Management, Inc. | $90.6 Mil | 6.3% | 49 | TRIM -7.0% | 13F |
| Manchester Global Management (UK) Ltd | $43.7 Mil | 5.8% | 23 | Hold | 13F |
| Consulta Ltd | $113.8 Mil | 5.7% | 13 | Hold | 13F |
| Spear Holdings RSC Ltd | $52.9 Mil | 5.7% | 17 | New | 13F |
| PBCay One RSC Ltd | $52.9 Mil | 5.7% | 17 | New | 13F |
| Palestra Capital Management LLC | $128.5 Mil | 5.0% | 22 | Hold | 13F |
| Third Point LLC | $99.5 Mil | 4.8% | 33 | TRIM -12.5% | 13F |
| L1 Capital International Pty Ltd | $75.1 Mil | 4.5% | 23 | Hold | 13F |
| Highlander Partners, L.P. | $11.0 Mil | 4.3% | 47 | New | 13F |
| Coalescence Partners Investment Management, LP | $18.5 Mil | 4.0% | 12 | Hold | 13F |
| D1 Capital Partners L.P. | $436.9 Mil | 3.9% | 44 | ADD +311.7% | 13F |
| BlueSpruce Investments, LP | $24.1 Mil | 3.8% | 10 | TRIM -79.8% | 13F |
| Dudley & Shanley, Inc. | $21.8 Mil | 3.6% | 38 | Hold | 13F |
| Milestones Administradora de Recursos Ltda. | $13.3 Mil | 3.5% | 17 | ADD +62.2% | 13F |
| Spinecap SAS | $9.4 Mil | 3.4% | 15 | Hold | 13F |
| Castle Hook Partners LP | $166.8 Mil | 3.4% | 44 | TRIM -23.6% | 13F |
| Generali Powszechne Towarzystwo Emerytalne | $17.3 Mil | 3.1% | 28 | Hold | 13F |
| M.D. Sass, LLC | $38.1 Mil | 2.9% | 36 | TRIM -34.0% | 13F |
| Active Manager | Value | % of Portfolio | Total Positions | QoQ | Filing |
|---|---|---|---|---|---|
| Southpoint Capital Advisors LP | $113.8 Mil | 2.3% | 41 | New | 13F |
| Eminence Capital, LP | $106.4 Mil | 2.4% | 33 | New | 13F |
| Gates Foundation Trust | $70.7 Mil | 0.2% | 22 | New | 13F |
| Spear Holdings RSC Ltd | $52.9 Mil | 5.7% | 17 | New | 13F |
| PBCay One RSC Ltd | $52.9 Mil | 5.7% | 17 | New | 13F |
| Woodbridge Co Ltd | $19.7 Mil | 0.1% | 46 | New | 13F |
| Highlander Partners, L.P. | $11.0 Mil | 4.3% | 47 | New | 13F |
| Capco Asset Management, LLC | $8.4 Mil | 2.3% | 27 | New | 13F |
| D1 Capital Partners L.P. | $436.9 Mil | 3.9% | 44 | ADD +311.7% | 13F |
| Anomaly Capital Management, LP | $144.6 Mil | 8.8% | 21 | ADD +119.3% | 13F |
| Milestones Administradora de Recursos Ltda. | $13.3 Mil | 3.5% | 17 | ADD +62.2% | 13F |
| Arvin Capital Management LP | $35.2 Mil | 8.2% | 23 | ADD +35.9% | 13F |
| Two Creeks Capital Management, LP | $67.4 Mil | 7.1% | 21 | ADD +33.0% | 13F |
| Skye Global Management LP | $47.0 Mil | 1.0% | 44 | ADD +26.5% | 13F |
| Unisphere Establishment | $121.2 Mil | 1.0% | 50 | ADD +12.3% | 13F |
| Mar Vista Investment Partners LLC | $22.8 Mil | 2.3% | 35 | ADD +12.3% | 13F |
| 11 Capital Partners LP | $23.0 Mil | 7.5% | 19 | ADD +7.4% | 13F |
| Active Manager | Value | % of Portfolio | Total Positions | QoQ | As Of | Filing |
|---|---|---|---|---|---|---|
| Tri Locum Partners LP | $79.4 Mil | 10.3% | 15 | Exited | Dec 31, 2025 | 13F |
| Cartenna Capital, LP | $60.7 Mil | 3.2% | 36 | Exited | Dec 31, 2025 | 13F |
| Saraza Management, LP | $17.2 Mil | 6.7% | 15 | Exited | Dec 31, 2025 | 13F |
| Napean Trading & Investment Co (Singapore) PTE Ltd | $13.7 Mil | 2.7% | 37 | Exited | Dec 31, 2025 | 13F |
| Archon Partners LLC | $9.2 Mil | 1.0% | 42 | Exited | Dec 31, 2025 | 13F |
| Cooper Investors PTY LTD | $7.0 Mil | 2.3% | 41 | Exited | Dec 31, 2025 | 13F |
| BlueSpruce Investments, LP | $24.1 Mil | 3.8% | 10 | TRIM -79.8% | Mar 31, 2026 | 13F |
| Owl Creek Asset Management, L.P. | $6.6 Mil | 1.3% | 21 | TRIM -45.4% | Mar 31, 2026 | 13F |
| M.D. Sass, LLC | $38.1 Mil | 2.9% | 36 | TRIM -34.0% | Mar 31, 2026 | 13F |
| Blue Whale Capital LLP | $29.2 Mil | 1.4% | 26 | TRIM -32.1% | Mar 31, 2026 | 13F |
| Dorsey Asset Management, LLC | $110.0 Mil | 8.8% | 11 | TRIM -29.9% | Mar 31, 2026 | 13F |
| Castle Hook Partners LP | $166.8 Mil | 3.4% | 44 | TRIM -23.6% | Mar 31, 2026 | 13F |
| Glenview Capital Management, LLC | $29.6 Mil | 0.8% | 41 | TRIM -21.9% | Mar 31, 2026 | 13F |
| Third Point LLC | $99.5 Mil | 4.8% | 33 | TRIM -12.5% | Mar 31, 2026 | 13F |
| Weitz Investment Management, Inc. | $90.6 Mil | 6.3% | 49 | TRIM -7.0% | Mar 31, 2026 | 13F |
| Active Manager | Value | % of Portfolio | Total Positions | QoQ | Filing |
|---|---|---|---|---|---|
| Generation Investment Management LLP | $1.4 Bil | 12.4% | 29 | Hold | 13F |
| D1 Capital Partners L.P. | $436.9 Mil | 3.9% | 44 | ADD +311.7% | 13F |
| Mirova US LLC | $199.4 Mil | 2.3% | 42 | Hold | 13F |
| Castle Hook Partners LP | $166.8 Mil | 3.4% | 44 | TRIM -23.6% | 13F |
| Anomaly Capital Management, LP | $144.6 Mil | 8.8% | 21 | ADD +119.3% | 13F |
| Palestra Capital Management LLC | $128.5 Mil | 5.0% | 22 | Hold | 13F |
| Unisphere Establishment | $121.2 Mil | 1.0% | 50 | ADD +12.3% | 13F |
| Consulta Ltd | $113.8 Mil | 5.7% | 13 | Hold | 13F |
| Southpoint Capital Advisors LP | $113.8 Mil | 2.3% | 41 | New | 13F |
| Dorsey Asset Management, LLC | $110.0 Mil | 8.8% | 11 | TRIM -29.9% | 13F |
| Eminence Capital, LP | $106.4 Mil | 2.4% | 33 | New | 13F |
| Third Point LLC | $99.5 Mil | 4.8% | 33 | TRIM -12.5% | 13F |
| Weitz Investment Management, Inc. | $90.6 Mil | 6.3% | 49 | TRIM -7.0% | 13F |
| L1 Capital International Pty Ltd | $75.1 Mil | 4.5% | 23 | Hold | 13F |
| Gates Foundation Trust | $70.7 Mil | 0.2% | 22 | New | 13F |
| Two Creeks Capital Management, LP | $67.4 Mil | 7.1% | 21 | ADD +33.0% | 13F |
| Spear Holdings RSC Ltd | $52.9 Mil | 5.7% | 17 | New | 13F |
| PBCay One RSC Ltd | $52.9 Mil | 5.7% | 17 | New | 13F |
| Skye Global Management LP | $47.0 Mil | 1.0% | 44 | ADD +26.5% | 13F |
| Manchester Global Management (UK) Ltd | $43.7 Mil | 5.8% | 23 | Hold | 13F |
| M.D. Sass, LLC | $38.1 Mil | 2.9% | 36 | TRIM -34.0% | 13F |
| Arvin Capital Management LP | $35.2 Mil | 8.2% | 23 | ADD +35.9% | 13F |
| Defender Capital, LLC. | $29.9 Mil | 10.6% | 34 | Hold | 13F |
| Glenview Capital Management, LLC | $29.6 Mil | 0.8% | 41 | TRIM -21.9% | 13F |
| Blue Whale Capital LLP | $29.2 Mil | 1.4% | 26 | TRIM -32.1% | 13F |
DHR Trade Sentinel
Neutral / Watch
CONVICTION RATIONALE
Danaher's premium life sciences portfolio is at a crossroads. While core businesses outside of respiratory testing are accelerating, a sharp slowdown in the critical bioprocessing segment led to a reduced 2026 revenue outlook. The investment case now hinges on whether management's claim of strong mid-teens order growth materializes into revenue, proving the recent weakness was temporary.
STOCK ARCHETYPE
Installed Base & Consumables (Razor & Blade)(Size of Instrument Installed Base) x (Utilization Rate per Instrument) x (Price per Consumable) + (New Instrument Sales) The high-margin, recurring revenue stream from consumables, which benefits from a large and growing installed base of instruments that create a sticky customer relationship.
INVESTMENT THESIS
Evidence suggests the recent bioprocessing revenue miss was a temporary issue of shipment timing, not a structural demand problem.
- Bioprocessing orders grew at a mid-teens rate in Q2 2026.
- Core revenue excluding respiratory testing accelerated to 4.5% growth.
- The Life Sciences segment delivered its strongest quarter in several years.
- Full-year 2026 adjusted EPS guidance was raised to a range of $8.45 to $8.60.
PRIMARY RISK
The bioprocessing slowdown is a sign of market share loss to better-executing peers, with a massive inventory build-up signaling a deeper-than-stated demand problem.
- Bioprocessing core revenue decelerated to low single-digit growth in Q2.
- Full-year 2026 core revenue growth guidance was lowered to 3.0%-4.0%.
- Inventory grew 21.2% while revenue grew 5.5% in the latest quarter.
- A key peer reported an 'excellent quarter' in its bioproduction business.
- TTM revenue growth of 4.5% lags peers Thermo Fisher (7.2%) and Agilent (8.6%).
| KPI | Status | Rationale |
|---|---|---|
| Bioprocessing Core Revenue Growth | Low single-digit growth in Q2 2026 - Decelerating | Management attributed the sharp deceleration to the timing of a few large customer shipments for commercial programs moving out of the quarter. However, they emphasized that underlying demand remains healthy, citing mid-teens order growth in both consumables and equipment for the bioprocessing business in the latest quarter. |
| Diagnostics Core Revenue Growth (excluding respiratory testing) | 5.0% growth in Q2 2026 - Accelerating | The growth was broad-based within the segment's clinical diagnostics businesses. Management noted that core sales were up mid-single digits, led by high single-digit growth at both Leica Biosystems and Radiometer, and mid-single-digit growth at Beckman Coulter Diagnostics. |
| Core Revenue Growth (ex-respiratory testing) | 4.5% (Q2 2026) | Measures the underlying growth of the business by excluding volatile respiratory testing revenue, providing a clearer view of trends in the base business. |
| Bioprocessing Order Growth | mid-teens (Q2 2026) | Indicates future revenue trends for the bioprocessing business, which is a key part of the Biotechnology segment. Strong order growth suggests healthy underlying demand despite reported revenue volatility. |
| Inventory-to-Revenue Growth Divergence | 15.7 percentage points (Q2 2026) | A significant divergence where inventory growth (21.2%) far outpaces revenue growth (5.5%) can signal a potential future slowdown, excess stock, or mismatch with demand. This is a sharp reversal from the prior quarter's -0.7 percentage point divergence. |
Shipment Timing vs. Demand Destruction
BULL VIEW
Bulls believe management's claim that strong mid-teens order growth is the true indicator of demand, and the Q2 revenue miss was simply a few large orders slipping into Q3.
CORE TENSION
Can mid-teens order growth overcome a 21.2% inventory surge, which the market punished with an -11.0% stock decline?
PREVAILING SENTIMENT
The latest reported data (Q2 revenue miss, inventory build) favors the bear case. The bull case rests entirely on a leading indicator (orders) that has not yet converted.
BEAR VIEW
Bears see the 15.7 percentage point inventory-to-revenue growth gap as proof of a collapse in end-demand, making the order book commentary irrelevant and suggesting a guidance cut.
| Timeline | Event & Metric To Watch |
|---|---|
October 1, 2026 | New CEO Takes Helm Watch: New CEO Julie Sawyer Montgomery's tenure begins, with Rainer Blair retiring. |
10/13/2026 | Negative Peer Read-Through Watch: Commentary from ABT and TMO on biopharma customer spending, capital equipment demand, and China market conditions. |
10/19/2026 | Bioprocessing Revenue Miss Watch: Whether delayed shipments materialize and if mid-teens order growth converts to revenue, validating management's timing explanation. |
10/19/2026 | CEO Transition Uncertainty Watch: The new CEO's tone and any shifts in strategic priorities or financial outlook on the Q3 earnings call. |
10/20/2026 | Peer Thermo Fisher Earnings Watch: Peer Thermo Fisher Scientific (TMO) is scheduled to report earnings. |
10/28/2026 | Peer Illumina Earnings Report Watch: Peer Illumina (ILMN) is scheduled to report earnings. |
No set date | Masimo Legal Developments Watch: Court filings or company disclosures regarding the Kiani employment litigation or other lawsuits disclosed in SEC filings. |
| Date | Event | Stock Impact |
|---|---|---|
2026-08-03 | New CEO Appointed Details: The Board appointed Julie Sawyer Montgomery as President and CEO, effective October 1, 2026, to succeed the retiring Rainer Blair. | -0.1% $194.98 -> $194.78 |
2026-07-21 | Q2 Earnings and Guidance Cut Details: Q2 core revenue grew 3.0%, but the company lowered its full-year 2026 core revenue growth guidance. The stock fell -11.0% in a two-day reaction. | -10.9% $201.11 -> $179.14 |
2026-06-10 | Masimo Acquisition Completed Details: Danaher completed its acquisition of Masimo Corporation for a cash purchase price of approximately $9.8 billion, net of cash acquired. | -4.0% $188.02 -> $180.42 |
2026-05-05 | Quarterly Dividend Declared Details: The Board of Directors approved a regular quarterly cash dividend of $0.40 per share of its common stock, payable on July 31, 2026. | +0.5% $173.68 -> $174.56 |
2026-04-22 | Q1 Earnings Reported Details: The company reported first-quarter 2026 sales of $6.0 billion, with core revenue up 0.5% year-over-year, as bioprocessing strength offset a lighter respiratory season. | -8.2% $194.14 -> $178.20 |
Position Sizing
4% - 6%
NORMAL POSITION
Sizing is volatility-based: DHR trades at roughly 30% annualized options-implied volatility versus about 13% for the S&P 500 (2.2x the market), around the 57th percentile of its own trailing year. A 4% - 6% position keeps a single-name swing of that size within a diversified portfolio's risk budget.
Diversification Alternatives
TMO - Thermo Fisher Scientific
Scale and MomentumThermo Fisher offers greater scale, with revenue 1.8 times that of Danaher, and demonstrated stronger recent execution with 7.2% trailing-twelve-month revenue growth and an 'excellent quarter' in bioproduction.
A - a business partner
Pure-Play InnovationAgilent appears to have superior product momentum with cutting-edge researchers, evidenced by its pharma business growing 12% and strong customer response to new instrument platforms driving share gains.
A high-quality compounder in life sciences and diagnostics that uses a disciplined M&A strategy and its proprietary 'Danaher Business System' to drive growth and margin expansion, currently navigating a lumpy post-pandemic recovery in customer spending.
Danaher operates a diversified portfolio of businesses with strong recurring revenue from consumables tied to a large installed base of instruments. The company's core strategy involves acquiring leading assets in attractive, high-growth healthcare markets and improving their performance through its operational methodology, the Danaher Business System (DBS). While long-term secular trends are favorable, near-term performance is subject to the cyclicality of customer capital budgets and R&D spending, as evidenced by recent volatility in its bioprocessing segment.
Sustained acceleration in core revenue growth ex-respiratory, successful integration and performance of the Masimo acquisition, and a return to strong growth in the bioprocessing segment.
Continued bioprocessing weakness, margin compression from pricing pressure (e.g., in China), or signs that the Danaher Business System is failing to extract value from new acquisitions.
Short-term stock price reactions to single-quarter earnings, or general market volatility not specific to Danaher's end markets.
Repricing Catalyst
The market is currently repricing the stock based on the Q2 2026 earnings report, which featured a cut to the full-year revenue outlook and a significant miss in the key Biotechnology segment, overshadowing a profit forecast raise. A newly appointed CEO, effective October 1, 2026, also introduces a leadership transition.
Diagnostics
$10.1B TTM (40% of Total) · 25% MarginWhat It Is
Sells clinical instruments, consumables, software, and services to hospitals, physicians' offices, reference laboratories, and other critical care settings. Key brands include Beckman Coulter, Cepheid, and Radiometer.
Who Pays & How
Hospitals, labs, and physicians' offices purchase these products to diagnose diseases and make treatment decisions. They choose Danaher for product quality, reliability, accuracy, speed, and the breadth of tests that can be performed.
Competition
Life Sciences
$7.5B TTM (30% of Total) · 14% MarginWhat It Is
Sells instruments, consumables, services, and software to pharmaceutical and biotechnology companies, universities, medical schools, and research institutions. Key brands include SCIEX, Beckman Coulter (Life Sciences), Leica Microsystems, and Abcam.
Who Pays & How
Research and development departments at pharma/biotech companies and academic institutions purchase these products to study DNA, proteins, and cells to understand diseases, identify new therapies, and manufacture new drugs.
Competition
Biotechnology
$7.5B TTM (30% of Total) · 26% MarginWhat It Is
Sells equipment, consumables, and services to pharmaceutical and biopharmaceutical companies, and contract manufacturing organizations (CMOs) for the research, development, and manufacturing of biological medicines. Key brands are Cytiva and Pall.
Who Pays & How
Biopharma companies and their manufacturing partners purchase these products to advance and accelerate the production of therapies like monoclonal antibodies, vaccines, and cell and gene therapies.
Competition
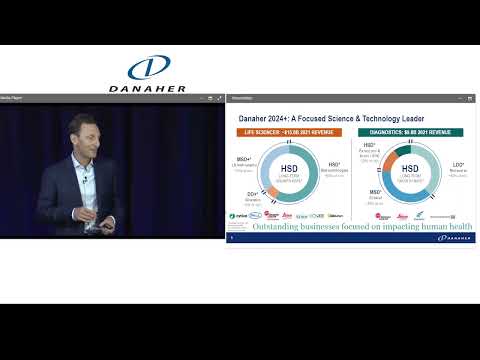
Danaher — Investor Video Playlist


Industry Resources
| Health Care Resources |
| U.S. National Library of Medicine |
| ClinicalTrials.gov |
| Modern Healthcare |
| Healthcare Dive |
| Fierce Healthcare |
| Health Affairs |
| Health Data Management |
| FDA Tracker |
| Life Sciences Tools & Services Resources |
| GenomeWeb |
| BioSpace |
| The Scientist |
External Quote Links
| Y Finance | Barrons |
| TradingView | Morningstar |
| SeekingAlpha | ValueLine |
| Motley Fool | Robinhood |
| CNBC | Etrade |
| MarketWatch | Unusual Whales |
| YCharts | Perplexity Finance |
| FinViz |
Prefer one of these to Trefis? Tell us why.