
Dentsply Sirona (XRAY)
Market Price (10/15/2026): $8.56 | Market Cap: $1.7 BilSector: Health Care | Industry: Health Care Supplies
Dentsply Sirona (XRAY)
Market Price (10/15/2026): $8.56Market Cap: $1.7 BilSector: Health CareIndustry: Health Care Supplies
Investment Highlights Why It Matters Detailed financial logic regarding cash flow yields vs trend-riding momentum.
Valuation becoming less expensiveP/S 6M Chg %Price/Sales change over 6 months. Declining P/S indicates valuation has become less expensive. is -27% Attractive yieldDividend Yield is 5.7%, FCF Yield is 8.5% Low stock price volatilityVol 12M is 47% Megatrend and thematic driversMegatrends include Digital Health & Telemedicine, Aging Population & Chronic Disease, and Precision Medicine. Themes include AI in Healthcare Management, Show more. | Weak multi-year price returns2Y Excs Rtn is -98%, 3Y Excs Rtn is -152% Meaningful short interestShort Interest % of Basic SharesShort Interest % of Basic Shares = (Short Interest Quantity) / (Basic Shares Outstanding). A high fraction of short interest can indicate potential risk of a short squeeze. is 13% | Debt is significantNet D/ENet Debt/Equity. Debt net of cash. Negative indicates net cash. Equity is taken as the Market Capitalization is 123% Weak revenue growthRev Chg 3Y AvgRevenue Change % averaged over trailing 3 years is -2.5%, Rev Chg QQuarterly Revenue Change % is -4.1% Yield minus risk free rate is negativeERPEquity Risk Premium (ERP) = Total Yield - Risk Free Rate, Reflects the premium above risk free assets offered by the investment. is -31% Key risksXRAY key risks include [1] weakened demand and significant competitive pressure in its U.S. Show more. |
| Valuation becoming less expensiveP/S 6M Chg %Price/Sales change over 6 months. Declining P/S indicates valuation has become less expensive. is -27% |
| Attractive yieldDividend Yield is 5.7%, FCF Yield is 8.5% |
| Low stock price volatilityVol 12M is 47% |
| Megatrend and thematic driversMegatrends include Digital Health & Telemedicine, Aging Population & Chronic Disease, and Precision Medicine. Themes include AI in Healthcare Management, Show more. |
| Weak multi-year price returns2Y Excs Rtn is -98%, 3Y Excs Rtn is -152% |
| Meaningful short interestShort Interest % of Basic SharesShort Interest % of Basic Shares = (Short Interest Quantity) / (Basic Shares Outstanding). A high fraction of short interest can indicate potential risk of a short squeeze. is 13% |
| Debt is significantNet D/ENet Debt/Equity. Debt net of cash. Negative indicates net cash. Equity is taken as the Market Capitalization is 123% |
| Weak revenue growthRev Chg 3Y AvgRevenue Change % averaged over trailing 3 years is -2.5%, Rev Chg QQuarterly Revenue Change % is -4.1% |
| Yield minus risk free rate is negativeERPEquity Risk Premium (ERP) = Total Yield - Risk Free Rate, Reflects the premium above risk free assets offered by the investment. is -31% |
| Key risksXRAY key risks include [1] weakened demand and significant competitive pressure in its U.S. Show more. |
Qualitative Assessment
AI Analysis | Feedback
Dentsply Sirona (XRAY) stock has lost about 20% since 6/30/2026 because of the following key factors:
1. Fiscal Q2 2026 revenue decline and negative net margin overshadowed an adjusted EPS beat. Dentsply Sirona reported adjusted diluted earnings per share (EPS) of $0.52 for fiscal Q2 2026, ended June 30, 2026, surpassing analysts' consensus estimates of $0.35. Similarly, net sales of $898 million also slightly exceeded the $889.93 million consensus. However, the company's revenue declined by 4.1% year-over-year, and it posted a negative net margin of 14.99%. The adjusted EPS figure also included a positive impact of $0.17 per share from tariff refunds, suggesting that operational performance, excluding this benefit, was weaker.
2. Cautious fiscal Q3 2026 guidance and persistent operational challenges. Management indicated that fiscal Q3 2026 earnings were expected to be below fiscal Q2 2026 levels (excluding the tariff refund benefit) due to normal seasonality and investment timing, with improvement anticipated only in fiscal Q4. Additionally, the company acknowledged ongoing struggles in the U.S. implant market and cited EMEA delays due to conflict uncertainty. Factors like "Byte impact" and "SureSmile U.S." were also noted for contributing to a soft performance in the Orthodontic and Implant Solutions (OIS) segment.
Show more
Dentsply Sirona (XRAY) stock has lost about 20% since 6/30/2026 because of the following key factors:
1. Fiscal Q2 2026 revenue decline and negative net margin overshadowed an adjusted EPS beat. Dentsply Sirona reported adjusted diluted earnings per share (EPS) of $0.52 for fiscal Q2 2026, ended June 30, 2026, surpassing analysts' consensus estimates of $0.35. Similarly, net sales of $898 million also slightly exceeded the $889.93 million consensus. However, the company's revenue declined by 4.1% year-over-year, and it posted a negative net margin of 14.99%. The adjusted EPS figure also included a positive impact of $0.17 per share from tariff refunds, suggesting that operational performance, excluding this benefit, was weaker.
2. Cautious fiscal Q3 2026 guidance and persistent operational challenges. Management indicated that fiscal Q3 2026 earnings were expected to be below fiscal Q2 2026 levels (excluding the tariff refund benefit) due to normal seasonality and investment timing, with improvement anticipated only in fiscal Q4. Additionally, the company acknowledged ongoing struggles in the U.S. implant market and cited EMEA delays due to conflict uncertainty. Factors like "Byte impact" and "SureSmile U.S." were also noted for contributing to a soft performance in the Orthodontic and Implant Solutions (OIS) segment.
3. Negative analyst sentiment and price target adjustments. Analyst sentiment remained mixed but leaned neutral, with a consensus "Hold" rating and an average price target substantially above recent trading levels. However, some firms adjusted their outlook downward; BMO Capital Markets, for instance, lowered its price objective from $13.00 to $10.00 on September 17, 2026. These adjustments reflect ongoing concerns regarding the company's turnaround execution and near-term catalysts.
4. Overall negative financial trends contributing to broader investor concerns. The stock hit a new 52-week low of $8.77 on October 1, 2026, reflecting a significant drop from its 52-week high of $14.68, and a 3-month decline of approximately 23.95%. This decline is underpinned by a trailing negative EPS of -$2.75 and a substantially negative return on equity of -33.03% as of September 29, 2026, signaling deeper financial difficulties and a bearish market momentum for the company.
Show less
Stock Movement Drivers
Fundamental Drivers
The -20.5% change in XRAY stock from 6/30/2026 to 10/14/2026 was primarily driven by a -19.7% change in the company's P/S Multiple.| (LTM values as of) | 6302026 | 10142026 | Change |
|---|---|---|---|
| Stock Price ($) | 10.61 | 8.44 | -20.5% |
| Change Contribution By: | |||
| Total Revenues ($ Mil) | 3,681 | 3,643 | -1.0% |
| P/S Multiple | 0.6 | 0.5 | -19.7% |
| Shares Outstanding (Mil) | 200 | 200 | 0.1% |
| Cumulative Contribution | -20.5% |
Market Drivers
6/30/2026 to 10/14/2026| Return | Correlation | |
|---|---|---|
| XRAY | -20.5% | |
| Market (SPY) | 3.1% | 7.8% |
| Sector (XLV) | 9.6% | 12.1% |
Fundamental Drivers
The -27.2% change in XRAY stock from 3/31/2026 to 10/14/2026 was primarily driven by a -26.5% change in the company's P/S Multiple.| (LTM values as of) | 3312026 | 10142026 | Change |
|---|---|---|---|
| Stock Price ($) | 11.60 | 8.44 | -27.2% |
| Change Contribution By: | |||
| Total Revenues ($ Mil) | 3,680 | 3,643 | -1.0% |
| P/S Multiple | 0.6 | 0.5 | -26.5% |
| Shares Outstanding (Mil) | 200 | 200 | 0.0% |
| Cumulative Contribution | -27.2% |
Market Drivers
3/31/2026 to 10/14/2026| Return | Correlation | |
|---|---|---|
| XRAY | -27.2% | |
| Market (SPY) | 18.6% | 17.6% |
| Sector (XLV) | 19.2% | 26.5% |
Fundamental Drivers
The -32.5% change in XRAY stock from 9/30/2025 to 10/14/2026 was primarily driven by a -31.9% change in the company's P/S Multiple.| (LTM values as of) | 9302025 | 10142026 | Change |
|---|---|---|---|
| Stock Price ($) | 12.51 | 8.44 | -32.5% |
| Change Contribution By: | |||
| Total Revenues ($ Mil) | 3,671 | 3,643 | -0.8% |
| P/S Multiple | 0.7 | 0.5 | -31.9% |
| Shares Outstanding (Mil) | 199 | 200 | -0.2% |
| Cumulative Contribution | -32.5% |
Market Drivers
9/30/2025 to 10/14/2026| Return | Correlation | |
|---|---|---|
| XRAY | -32.5% | |
| Market (SPY) | 16.5% | 32.1% |
| Sector (XLV) | 26.6% | 37.0% |
Fundamental Drivers
The -73.3% change in XRAY stock from 9/30/2023 to 10/14/2026 was primarily driven by a -72.8% change in the company's P/S Multiple.| (LTM values as of) | 9302023 | 10142026 | Change |
|---|---|---|---|
| Stock Price ($) | 31.62 | 8.44 | -73.3% |
| Change Contribution By: | |||
| Total Revenues ($ Mil) | 3,936 | 3,643 | -7.4% |
| P/S Multiple | 1.7 | 0.5 | -72.8% |
| Shares Outstanding (Mil) | 212 | 200 | 6.1% |
| Cumulative Contribution | -73.3% |
Market Drivers
9/30/2023 to 10/14/2026| Return | Correlation | |
|---|---|---|
| XRAY | -73.3% | |
| Market (SPY) | 86.2% | 34.7% |
| Sector (XLV) | 41.5% | 36.0% |
Price Returns Compared
| 2021 | 2022 | 2023 | 2024 | 2025 | 2026 | Total [1] | |
|---|---|---|---|---|---|---|---|
| Returns | |||||||
| XRAY Return | 7% | -42% | 14% | -45% | -37% | -26% | -82% |
| Peers Return | 12% | -23% | -2% | -4% | 2% | 3% | -15% |
| S&P 500 Return | 27% | -19% | 24% | 23% | 16% | 14% | 108% |
Monthly Win Rates [3] | |||||||
| XRAY Win Rate | 42% | 33% | 67% | 25% | 33% | 50% | |
| Peers Win Rate | 50% | 45% | 45% | 48% | 53% | 52% | |
| S&P 500 Win Rate | 75% | 42% | 67% | 75% | 67% | 50% | |
Max Drawdowns [4] | |||||||
| XRAY Max Drawdown | -30% | -54% | -35% | -53% | -50% | -42% | |
| Peers Max Drawdown | -21% | -40% | -39% | -28% | -29% | -22% | |
| S&P 500 Max Drawdown | -5% | -25% | -10% | -8% | -19% | -9% | |
[1] Cumulative total returns since the beginning of 2021
[2] Peers: ALGN, NVST, ZBH, HSIC, MMM. See XRAY Returns vs. Peers.
[3] Win Rate = % of calendar months in which monthly returns were positive
[4] Max drawdown represents maximum peak-to-trough decline within a year
[5] 2026 data is for the year up to 10/14/2026 (YTD)
How Low Can It Go
| Event | XRAY | S&P 500 |
|---|---|---|
| 2020 COVID-19 Crash | ||
| % Loss | -45.6% | -33.7% |
| % Gain to Breakeven | 83.7% | 50.9% |
| Time to Breakeven | 291 days | 140 days |
| 2015-2016 China Devaluation / Global Growth Scare | ||
| % Loss | -11.1% | -12.2% |
| % Gain to Breakeven | 12.5% | 13.9% |
| Time to Breakeven | 12 days | 62 days |
| 2011 US Debt Ceiling Crisis & European Contagion | ||
| % Loss | -26.3% | -17.9% |
| % Gain to Breakeven | 35.7% | 21.8% |
| Time to Breakeven | 136 days | 123 days |
| 2010 Eurozone Sovereign Debt Crisis / Flash Crash | ||
| % Loss | -21.3% | -15.4% |
| % Gain to Breakeven | 27.1% | 18.2% |
| Time to Breakeven | 175 days | 125 days |
| 2008-2009 Global Financial Crisis | ||
| % Loss | -51.4% | -53.4% |
| % Gain to Breakeven | 105.9% | 114.4% |
| Time to Breakeven | 1521 days | 1085 days |
In The Past
Dentsply Sirona's stock fell -3.2% during the 2024 Yen Carry Trade Unwind. Such a loss loss requires a 3.3% gain to breakeven.
Preserve Wealth
Limiting losses and compounding gains is essential to preserving wealth.
Asset Allocation
Actively managed asset allocation strategies protect wealth. Learn more.
| Event | XRAY | S&P 500 |
|---|---|---|
| 2020 COVID-19 Crash | ||
| % Loss | -45.6% | -33.7% |
| % Gain to Breakeven | 83.7% | 50.9% |
| Time to Breakeven | 291 days | 140 days |
| 2011 US Debt Ceiling Crisis & European Contagion | ||
| % Loss | -26.3% | -17.9% |
| % Gain to Breakeven | 35.7% | 21.8% |
| Time to Breakeven | 136 days | 123 days |
| 2010 Eurozone Sovereign Debt Crisis / Flash Crash | ||
| % Loss | -21.3% | -15.4% |
| % Gain to Breakeven | 27.1% | 18.2% |
| Time to Breakeven | 175 days | 125 days |
| 2008-2009 Global Financial Crisis | ||
| % Loss | -51.4% | -53.4% |
| % Gain to Breakeven | 105.9% | 114.4% |
| Time to Breakeven | 1521 days | 1085 days |
In The Past
Dentsply Sirona's stock fell -3.2% during the 2024 Yen Carry Trade Unwind. Such a loss loss requires a 3.3% gain to breakeven.
Preserve Wealth
Limiting losses and compounding gains is essential to preserving wealth.
Asset Allocation
Actively managed asset allocation strategies protect wealth. Learn more.
About Dentsply Sirona (XRAY)
Dentsply Sirona Inc. (XRAY) is a global leader specializing in the professional dental market. The company is dedicated to designing, developing, manufacturing, and distributing a comprehensive range of dental products and technologies. It serves dental professionals worldwide, providing integrated and innovative solutions across nearly every aspect of modern dentistry.
The company's extensive product portfolio encompasses essential dental equipment, including treatment centers, advanced imaging equipment, motorized dental handpieces, and various lab equipment. A significant area of focus is digital dentistry, where Dentsply Sirona offers CAD/CAM products, intraoral scanners for digital impressions, and milling units. Additionally, the company is prominent in orthodontics with clear aligner solutions such as SureSmile and Byte, and provides a full suite of dental implant products, endodontic instruments and materials, and restorative solutions like prosthetics and dental ceramics.
Beyond major equipment and systems, Dentsply Sirona also supplies a broad array of small equipment, including intraoral curing light systems and ultrasonic scalers, alongside a wide range of essential dental supplies. These consumables include dental anesthetics, prophylaxis paste, impression materials, teeth whiteners, and topical fluoride. Through this comprehensive offering, Dentsply Sirona aims to support dental practices, laboratories, and specialists globally with advanced tools, materials, and technologies for patient care.
AI Analysis | Feedback
- The 'Johnson & Johnson' or 'Medtronic' of the dental industry.
- Grainger for dental professionals.
AI Analysis | Feedback
- Dental Equipment: Comprehensive range including treatment centers, imaging equipment, handpieces, and laboratory apparatus.
- Dental CAD/CAM Products: Digital dentistry solutions encompassing scanners, mills, and related services for restorations.
- Orthodontic Solutions: Clear aligner technologies (SureSmile, Byte) and auxiliary devices like VPro for tooth movement.
- Dental Implant Systems: Implants, bone regeneration solutions, and educational support for implantology.
- Urology & Healthcare Consumables: Specialty urology catheters and various other healthcare-related consumable products.
- Endodontic Instruments & Materials: Specialized tools and supplies for root canal treatments, such as files, sealers, and drills.
- Restorative Dental Products: Prosthetics including artificial teeth, dental ceramics, digital dentures, and crown/bridge materials.
- Dental Supplies: Consumables like anesthetics, whitening agents, sealants, impression materials, and fluoride treatments.
AI Analysis | Feedback
The major customers of Dentsply Sirona (XRAY) are primarily other companies within the professional dental market. While the company sells directly to a vast and fragmented network of individual dental practices, clinics, and laboratories globally, its major customers, particularly those identifiable as public companies acting as key intermediaries and large purchasers in the supply chain, are dental distributors. These distributors purchase a broad range of Dentsply Sirona's products for resale to dental professionals and laboratories worldwide.
- Henry Schein, Inc. (Symbol: HSIC)
- Patterson Companies, Inc. (Symbol: PDCO)
AI Analysis | Feedback
AI Analysis | Feedback
Daniel Scavilla President and Chief Executive Officer
Daniel Scavilla was appointed President and Chief Executive Officer of Dentsply Sirona, effective August 1, 2025. He previously served as President and CEO of Globus Medical, where he led the acquisition of NuVasive in a $3 billion all-stock deal and oversaw the integration of the two companies to form the world's second-largest spine technology company. Prior to that, he held various executive leadership roles at Globus Medical, including Chief Financial Officer, Executive Vice President, Chief Commercial Officer, and President, Trauma, where he scaled manufacturing and distribution and launched the Orthopedics and Trauma business unit. Before joining Globus Medical in 2015, Mr. Scavilla spent 28 years in financial and operational leadership positions at Johnson & Johnson.
Daniel Scavilla Interim Principal Financial Officer
In addition to his role as CEO, Daniel Scavilla was appointed interim principal financial officer for SEC reporting purposes, effective November 7, 2025, following the departure of Matthew Garth.
Aldo M. Denti Executive Vice President, Chief Commercial Officer
Aldo M. Denti was appointed Executive Vice President, Chief Commercial Officer in October 2025. Prior to joining Dentsply Sirona, he held leadership positions at Johnson & Johnson MedTech.
Andrea Frohning Senior Vice President, Chief Human Resources Officer
Andrea Frohning serves as the Senior Vice President and Chief Human Resources Officer for Dentsply Sirona.
Richard C. Rosenzweig Executive Vice President, Corporate Development, General Counsel and Secretary
Richard C. Rosenzweig holds the position of Executive Vice President, Corporate Development, General Counsel and Secretary at Dentsply Sirona.
AI Analysis | Feedback
1. Intense Competition and Dependence on Continuous Innovation
Dentsply Sirona operates in a highly competitive market where numerous players vie for market share based on product performance, quality, safety, ease of use, and price. To maintain its competitive advantage, the company must continuously innovate and offer superior products and services, requiring ongoing investment and strategic focus. The dental industry is characterized by rapid technological advancements, especially in areas like digital dentistry (e.g., CAD/CAM, digital impressions, clear aligners), and the company's success hinges on its ability to keep pace with these changes. This reliance on continuous innovation demands significant investment and resources, which could strain the company's financials if not managed effectively.2. Regulatory Challenges and Compliance
The medical device industry, including dental products, is subject to stringent regulations globally from authorities such as the U.S. Food and Drug Administration (FDA) and the European Union's Medical Device Regulation. Changes in these regulatory frameworks can impose additional compliance costs, impact the company's ability to market its products, and lead to disruptions in business operations. Dentsply Sirona has faced concerns and investigations related to regulatory compliance and internal financial reporting in the past, including a voluntary suspension of sales and marketing for its Byte Aligners and Impression Kits due to a review of regulatory requirements.3. Operational and Financial Execution Challenges
Dentsply Sirona has encountered significant operational and financial challenges. These include substantial non-cash impairment charges for goodwill and intangible assets, particularly in its Orthodontic and Implant Solutions segment, signaling performance issues and weakened demand in critical business areas. The company has also faced weakened demand in the U.S. market and experienced financial pressure from tariffs, impacting its financial results and gross margins and leading to revised earnings outlooks. Furthermore, the company is undergoing a global Enterprise Resource Planning (ERP) system rollout, which carries inherent execution risks, and is implementing restructuring programs to achieve cost savings, the successful execution of which is crucial for improving financial performance.AI Analysis | Feedback
AI Analysis | Feedback
- Dental Equipment: The global dental equipment market size was valued at approximately USD 11.95 billion in 2024. The market is projected to reach around USD 22.1 billion by 2034, growing at a CAGR of 6.34% between 2025 and 2034.
- Dental CAD/CAM Products: The global dental CAD/CAM market size reached USD 3.3 billion in 2024. It is expected to reach USD 7.0 billion by 2033, exhibiting a compound annual growth rate (CAGR) of 8.2% from 2025 to 2033.
- Orthodontic Products (Clear Aligners): The global clear aligners market size was estimated at USD 8.29 billion in 2025. It is projected to reach USD 56.81 billion by 2033, growing at a CAGR of 26.95% from 2026 to 2033.
- Dental Implant Products: The global dental implants market size was estimated at USD 5.56 billion in 2025. This market is projected to reach USD 11.02 billion by 2033, with a CAGR of 9.02% from 2026 to 2033.
- Endodontic Products: The global endodontics market was valued at USD 2.3 billion in 2025. It is expected to grow to USD 4 billion by 2035, at a CAGR of 5.2% during the forecast period.
- Restorative Products (Dental Prosthetics, Artificial Teeth, Dental Ceramics, Crown and Bridge Porcelain Products): The global dental restoration materials market size was valued at USD 22.89 billion in 2024. It is expected to reach USD 38.22 billion by 2032, at a CAGR of 6.62% during the forecast period. The global restorative dentistry market, which includes these products, was estimated at USD 22.4 billion in 2024.
- Dental Supplies and Small Equipment (including dental anesthetics, prophylaxis paste, dental sealants, impression materials, teeth whiteners, topical fluoride, intraoral curing light systems, dental diagnostic systems, and ultrasonic scalers and polishers): The global dental consumables market size was valued at USD 36.76 billion in 2024. It is projected to reach USD 81.55 billion by 2034, growing at a CAGR of 8.3% from 2025 to 2034.
- Urology Catheters and other healthcare-related consumable products: null
AI Analysis | Feedback
Dentsply Sirona (XRAY) anticipates driving future revenue growth over the next 2-3 years through a multi-faceted "Return to Growth" action plan. This plan focuses on several key areas:
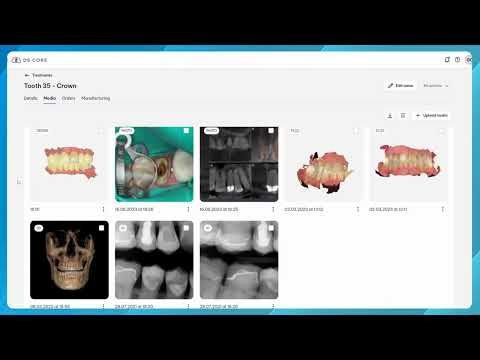
- Increased Investment in Research & Development and Innovation: The company plans to significantly increase its R&D investment, with a double-digit rise in 2026, to accelerate innovation across its core product lines. This includes modernizing its Essential Dental Solutions (EDS) portfolio with advanced technologies like artificial intelligence (AI) and robotics, as well as enhancing platforms like DS Core.
- Strengthening Dealer Relationships and Optimizing the Supply Chain: Dentsply Sirona is focused on enhancing its relationships with dealer partners by simplifying deal structures and transitioning to a volume-based approach. A shift to a dropship model is also underway to streamline inventory management and purchasing processes for both the company and its dealers.
- Targeted Market Penetration and Enhanced Clinical Education: The company is prioritizing the improvement of its U.S. business, which is a key focus for restoring overall health. Strategic efforts include a new implant strategy that emphasizes re-establishing dealer relationships and expanding clinical and sales representative education programs. Additionally, Dentsply Sirona is forming a dedicated team to better penetrate the Dental Service Organization (DSO) market segment and is increasing investments in Wellspect market penetration.
AI Analysis | Feedback
Share Repurchases
- Dentsply Sirona initiated a $150 million accelerated share repurchase program in March 2022.
- In February 2026, the company announced the elimination of its quarterly dividend to redirect capital towards debt retirement and opportunistic share repurchases.
- The strategy for capital reallocation prioritizes debt retirement initially, with share repurchases to follow as cash flow permits.
Share Issuance
- No specific dollar amounts for large-scale share issuances by the company were found within the last 3-5 years.
Inbound Investments
- No information on large inbound investments (e.g., from strategic partners or private equity firms directly into the company) was found for the specified period.
Outbound Investments
- Dentsply Sirona expanded and renewed distribution partnerships with Burkhart Dental Supply, Patterson Dental, and Benco Dental to enhance the availability of its full technology portfolio, including CEREC systems, Primescan scanners, and imaging systems, across the U.S.
- The company plans a double-digit increase in R&D investment in 2026 to accelerate innovation across key product lines as part of its "Return to Growth" action plan.
Capital Expenditures
- Capital expenditures in Q4 2025 were $41.0 million.
- For the full year 2025, capital expenditures amounted to -$131.0 million (representing cash outflow).
- In 2025, 51% of the company's strategic capital deployed was allocated to capital expenditures.
Peer Outperformance in Health Care Supplies
| Ticker | Name | Rev Growth 3Y Avg | P/E | 1Y | 3Y | 5Y | 5Y Gap |
|---|---|---|---|---|---|---|---|
| XRAY | Dentsply Sirona | -2.5% | -3.1x | -29.3% | -70.2% | -83.2% | — |
| ICUI | ICU Medical | -1.9% | 135.6x | 40.4% | 51.1% | -29.6% | +54pp |
| Industry | Names | 1Y med | 3Y med | 5Y med | Top 3 by 5Y |
|---|---|---|---|---|---|
| Health Care Distributors | 6 | 15.2% | 47.5% | 101.1% | CAH 456% · MCK 395% · COR 193% |
| Health Care Services | 20 | 21.8% | 36.8% | 9.2% | HIMS 256% · RDNT 152% · DGX 80% |
| Managed Health Care | 8 | 40.1% | -2.3% | 8.0% | OSCR 133% · HQY 42% · ELV 22% |
| Health Care Facilities | 24 | 3.2% | 18.1% | 6.2% | THC 337% · NHC 272% · EHC 144% |
| Health Care Equipment | 50 | -2.1% | 3.7% | -13.7% | UFPT 365% · GKOS 252% · TMDX 183% |
| Pharmaceuticals | 61 | -8.9% | -4.7% | -32.7% | LQDA 720% · KNSA 573% · CORT 459% |
| Health Care Supplies ← | 12 | 29.1% | -4.7% | -35.3% | LNTH 328% · HAE 74% · MMSI 22% |
| Life Sciences Tools & Services | 109 | -13.5% | -6.4% | -67.0% | NTRA 257% · MEDP 232% · GH 59% |
| Biotechnology | 361 | -24.8% | -28.4% | -81.2% | DNTH 1023% · ELVN 926% · ADMA 804% |
| Health Care Technology | 22 | -27.8% | -63.0% | -83.6% | VEEV 1% · DOCS -61% |
Latest Trefis Analyses
Research & Analysis
Invest in Strategies
Wealth Management
Peer Comparisons
| Peers to compare with: |
Financials
| Median | |
|---|---|
| Name | |
| Mkt Price | 88.67 |
| Mkt Cap | 10.0 |
| Rev LTM | 6,324 |
| Op Inc LTM | 715 |
| FCF LTM | 573 |
| FCF 3Y Avg | 502 |
| CFO LTM | 728 |
| CFO 3Y Avg | 652 |
Growth & Margins
| Median | |
|---|---|
| Name | |
| Rev Chg LTM | 5.4% |
| Rev Chg 3Y Avg | 3.3% |
| Rev Chg Q | 4.6% |
| QoQ Delta Rev Chg LTM | 1.1% |
| Op Inc Chg LTM | 1.6% |
| Op Inc Chg 3Y Avg | 2.6% |
| Op Mgn LTM | 13.1% |
| Op Mgn 3Y Avg | 11.1% |
| QoQ Delta Op Mgn LTM | 0.3% |
| CFO/Rev LTM | 14.4% |
| CFO/Rev 3Y Avg | 12.3% |
| FCF/Rev LTM | 12.0% |
| FCF/Rev 3Y Avg | 9.2% |
Valuation
| Median | |
|---|---|
| Name | |
| Mkt Cap | 10.0 |
| P/S | 1.7 |
| P/Op Inc | 12.6 |
| P/EBIT | 14.1 |
| P/E | 24.5 |
| P/CFO | 12.9 |
| Total Yield | 4.1% |
| Dividend Yield | 0.5% |
| FCF Yield 3Y Avg | 5.6% |
| D/E | 0.4 |
| Net D/E | 0.3 |
Returns
| Median | |
|---|---|
| Name | |
| 1M Rtn | -5.2% |
| 3M Rtn | -8.2% |
| 6M Rtn | -8.8% |
| 12M Rtn | 10.5% |
| 3Y Rtn | -7.7% |
| 1M Excs Rtn | -7.3% |
| 3M Excs Rtn | -12.9% |
| 6M Excs Rtn | -20.0% |
| 12M Excs Rtn | -6.2% |
| 3Y Excs Rtn | -93.5% |
Comparison Analyses
Segment Financials
Revenue by Segment| $ Mil | 2025 | 2024 | 2023 | 2022 | 2021 |
|---|---|---|---|---|---|
| Essential Dental Solutions | 1,469 | 1,454 | 1,468 | 1,427 | 1,516 |
| Connected Technology Solutions | 1,036 | 1,062 | 1,169 | 1,219 | 1,348 |
| Orthodontic and Implant Solutions | 850 | 973 | 1,040 | 1,006 | 1,064 |
| Wellspect Healthcare | 325 | 304 | 288 | 270 | 303 |
| Total | 3,680 | 3,793 | 3,965 | 3,922 | 4,231 |
| $ Mil | 2025 | 2024 | 2023 | 2022 | 2021 |
|---|---|---|---|---|---|
| Essential Dental Solutions | 514 | 479 | 478 | 467 | 511 |
| Orthodontic and Implant Solutions | 108 | 80 | 156 | 193 | 217 |
| Wellspect Healthcare | 102 | 98 | 87 | 73 | 87 |
| Connected Technology Solutions | 52 | 70 | 101 | 161 | 267 |
| Depreciation resulting from the fair value step-up of property, plant, and equipment from business | -2 | -3 | -3 | -3 | -6 |
| Restructuring and other costs | -24 | -53 | -67 | -14 | -17 |
| Amortization of intangible assets | -211 | -216 | -211 | -209 | -222 |
| Unallocated corporate costs | -311 | -320 | -319 | -318 | |
| Goodwill and intangible asset impairments | -650 | -1,014 | -307 | -1,287 | 0 |
| All Other | -229 | ||||
| Total | -422 | -879 | -85 | -937 | 608 |
| $ Mil | 2022 | 2021 | 2020 | 2019 | 2018 |
|---|---|---|---|---|---|
| Technologies & Equipment | 5,518 | 6,902 | 7,014 | 5,927 | 6,380 |
| Consumables | 1,928 | 2,123 | 2,170 | 2,443 | 2,158 |
| All Other | 197 | 214 | 166 | 233 | 148 |
| Total | 7,643 | 9,239 | 9,350 | 8,603 | 8,687 |
Price Behavior
| Market Price | $8.44 | |
| Market Cap ($ Bil) | 1.7 | |
| First Trading Date | 04/25/1991 | |
| Distance from 52W High | -42.5% | |
| 50 Days | 200 Days | |
| DMA Price | $10.32 | $11.50 |
| DMA Trend | down | down |
| Distance from DMA | -18.2% | -26.6% |
| 3M | 1YR | |
| Volatility | 44.2% | 47.2% |
| Downside Capture | 301.28 | 172.24 |
| Upside Capture | -19.94 | 99.46 |
| Correlation (S&P 500) | 8.4% | 32.3% |
| 1M | 2M | 3M | 6M | 1Y | 3Y | |
|---|---|---|---|---|---|---|
| Beta | 0.28 | 1.00 | 0.40 | 0.64 | 1.20 | 0.98 |
| Up Beta | -4.67 | 0.48 | -0.85 | 0.21 | 1.24 | 0.95 |
| Down Beta | 5.22 | 2.41 | -0.82 | 0.01 | 1.04 | 0.84 |
| Up Capture | -79% | -37% | 57% | 45% | 90% | 36% |
| Bmk +ve Days | 6 | 16 | 27 | 66 | 132 | 424 |
| Stock +ve Days | 6 | 14 | 28 | 61 | 119 | 363 |
| Down Capture | 266% | 326% | 167% | 152% | 134% | 108% |
| Bmk -ve Days | 16 | 26 | 37 | 60 | 120 | 328 |
| Stock -ve Days | 16 | 28 | 36 | 65 | 132 | 380 |
[1] Upside and downside betas calculated using positive and negative benchmark daily returns respectively
Based On 1-Year Data
| Annualized Return | Annualized Volatility | Sharpe Ratio | Correlation with XRAY | |
|---|---|---|---|---|
| XRAY | -30.0% | 47.2% | -0.61 | - |
| Sector ETF (XLV) | 24.2% | 16.0% | 1.16 | 36.3% |
| Equity (SPY) | 17.1% | 12.7% | 0.96 | 31.3% |
| Gold (GLD) | -0.6% | 29.4% | -0.02 | 18.3% |
| Commodities (DBC) | 49.3% | 20.7% | 1.82 | -15.6% |
| Real Estate (VNQ) | 5.7% | 13.7% | 0.15 | 36.6% |
| Bitcoin (BTCUSD) | -27.9% | 43.7% | -0.63 | 16.9% |
Smart multi-asset allocation framework can stack odds in your favor. Learn How
Based On 5-Year Data
| Annualized Return | Annualized Volatility | Sharpe Ratio | Correlation with XRAY | |
|---|---|---|---|---|
| XRAY | -30.4% | 38.9% | -0.83 | - |
| Sector ETF (XLV) | 8.4% | 15.2% | 0.35 | 38.8% |
| Equity (SPY) | 13.6% | 17.1% | 0.60 | 39.9% |
| Gold (GLD) | 17.9% | 18.9% | 0.76 | 11.2% |
| Commodities (DBC) | 10.0% | 19.5% | 0.39 | 4.0% |
| Real Estate (VNQ) | 1.2% | 18.8% | -0.05 | 39.9% |
| Bitcoin (BTCUSD) | 8.5% | 51.8% | 0.34 | 18.3% |
Smart multi-asset allocation framework can stack odds in your favor. Learn How
Based On 10-Year Data
| Annualized Return | Annualized Volatility | Sharpe Ratio | Correlation with XRAY | |
|---|---|---|---|---|
| XRAY | -16.5% | 35.6% | -0.41 | - |
| Sector ETF (XLV) | 11.1% | 16.7% | 0.54 | 43.5% |
| Equity (SPY) | 15.4% | 17.9% | 0.73 | 44.9% |
| Gold (GLD) | 12.0% | 16.4% | 0.60 | 6.2% |
| Commodities (DBC) | 8.2% | 18.1% | 0.37 | 10.8% |
| Real Estate (VNQ) | 4.8% | 20.7% | 0.19 | 42.8% |
| Bitcoin (BTCUSD) | 63.5% | 66.2% | 1.03 | 13.7% |
Smart multi-asset allocation framework can stack odds in your favor. Learn How
Earnings Returns History
Updated 8/7/2026| Forward Returns | |||
|---|---|---|---|
| Earnings Date | 1D Returns | 5D Returns | 21D Returns |
| 5/5/2026 | -2.0% | -3.3% | -13.1% |
| 2/26/2026 | 15.5% | 4.9% | -9.8% |
| 11/6/2025 | -12.7% | -14.1% | -12.0% |
| 7/21/2025 | -0.3% | 2.2% | -11.6% |
| 5/8/2025 | 16.3% | 20.2% | 16.5% |
| 2/27/2025 | -8.8% | -14.1% | -16.9% |
| 11/7/2024 | -28.0% | -27.6% | -20.4% |
| 7/31/2024 | 1.3% | -9.8% | -7.7% |
| ... | |||
| SUMMARY STATS | |||
| # Positive | 8 | 10 | 8 |
| # Negative | 18 | 16 | 18 |
| Median Positive | 7.8% | 4.3% | 9.6% |
| Median Negative | -6.5% | -6.9% | -10.2% |
| Max Positive | 16.3% | 20.2% | 17.1% |
| Max Negative | -28.0% | -27.6% | -20.4% |
| Forward Returns | |||
|---|---|---|---|
| Earnings Date | 1D Returns | 5D Returns | 21D Returns |
| 5/5/2026 | -2.0% | -3.3% | -13.1% |
| 2/26/2026 | 15.5% | 4.9% | -9.8% |
| 11/6/2025 | -12.7% | -14.1% | -12.0% |
| 7/21/2025 | -0.3% | 2.2% | -11.6% |
| 5/8/2025 | 16.3% | 20.2% | 16.5% |
| 2/27/2025 | -8.8% | -14.1% | -16.9% |
| 11/7/2024 | -28.0% | -27.6% | -20.4% |
| 7/31/2024 | 1.3% | -9.8% | -7.7% |
| 5/2/2024 | -6.0% | -7.9% | -7.2% |
| 2/29/2024 | -1.9% | 0.3% | 0.2% |
| 1/9/2024 | 1.8% | 0.1% | -6.1% |
| 11/2/2023 | -7.5% | -10.2% | 5.5% |
| 8/2/2023 | -3.4% | -5.4% | -8.8% |
| 5/3/2023 | -3.8% | -2.8% | -10.5% |
| 2/28/2023 | 10.2% | 13.7% | 9.3% |
| 1/11/2023 | 5.4% | 10.8% | 9.9% |
| 11/14/2022 | -5.3% | -2.9% | -1.2% |
| 8/4/2022 | 2.6% | 3.5% | -11.4% |
| 5/10/2022 | -7.3% | -2.5% | 1.9% |
| 2/28/2022 | -7.8% | -10.4% | -14.9% |
| 11/4/2021 | -7.2% | -5.9% | -14.4% |
| 8/5/2021 | -7.1% | -8.4% | -3.1% |
| 5/6/2021 | -0.3% | -2.8% | -1.9% |
| 3/1/2021 | 12.5% | 13.1% | 17.1% |
| 11/5/2020 | -3.1% | 3.6% | 11.7% |
| 8/6/2020 | -7.7% | -4.0% | -4.9% |
| SUMMARY STATS | |||
| # Positive | 8 | 10 | 8 |
| # Negative | 18 | 16 | 18 |
| Median Positive | 7.8% | 4.3% | 9.6% |
| Median Negative | -6.5% | -6.9% | -10.2% |
| Max Positive | 16.3% | 20.2% | 17.1% |
| Max Negative | -28.0% | -27.6% | -20.4% |
SEC Filings
Expand for More| Report Date | Filing Date | Filing |
|---|---|---|
| 06/30/2026 | 08/06/2026 | 10-Q |
| 03/31/2026 | 05/05/2026 | 10-Q |
| 12/31/2025 | 02/26/2026 | 10-K |
| 09/30/2025 | 11/06/2025 | 10-Q |
| 06/30/2025 | 08/07/2025 | 10-Q |
| 03/31/2025 | 05/08/2025 | 10-Q |
| 12/31/2024 | 02/27/2025 | 10-K |
| 09/30/2024 | 11/07/2024 | 10-Q |
| 06/30/2024 | 07/31/2024 | 10-Q |
| 03/31/2024 | 05/02/2024 | 10-Q |
| 12/31/2023 | 02/29/2024 | 10-K |
| 09/30/2023 | 11/02/2023 | 10-Q |
| 06/30/2023 | 08/07/2023 | 10-Q |
| 03/31/2023 | 05/03/2023 | 10-Q |
| 12/31/2022 | 03/01/2023 | 10-K |
| 09/30/2022 | 11/14/2022 | 10-Q |
| Report Date | Filing Date | Filing |
|---|---|---|
| 06/30/2026 | 08/06/2026 | 10-Q |
| 03/31/2026 | 05/05/2026 | 10-Q |
| 12/31/2025 | 02/26/2026 | 10-K |
| 09/30/2025 | 11/06/2025 | 10-Q |
| 06/30/2025 | 08/07/2025 | 10-Q |
| 03/31/2025 | 05/08/2025 | 10-Q |
| 12/31/2024 | 02/27/2025 | 10-K |
| 09/30/2024 | 11/07/2024 | 10-Q |
| 06/30/2024 | 07/31/2024 | 10-Q |
| 03/31/2024 | 05/02/2024 | 10-Q |
| 12/31/2023 | 02/29/2024 | 10-K |
| 09/30/2023 | 11/02/2023 | 10-Q |
| 06/30/2023 | 08/07/2023 | 10-Q |
| 03/31/2023 | 05/03/2023 | 10-Q |
| 12/31/2022 | 03/01/2023 | 10-K |
| 09/30/2022 | 11/14/2022 | 10-Q |
| 06/30/2022 | 11/07/2022 | 10-Q |
| 03/31/2022 | 11/07/2022 | 10-Q |
| 12/31/2021 | 03/01/2022 | 10-K |
| 09/30/2021 | 11/04/2021 | 10-Q |
| 06/30/2021 | 08/05/2021 | 10-Q |
| 03/31/2021 | 05/06/2021 | 10-Q |
| 12/31/2020 | 03/01/2021 | 10-K |
| 09/30/2020 | 11/05/2020 | 10-Q |
| 06/30/2020 | 08/06/2020 | 10-Q |
| 03/31/2020 | 05/11/2020 | 10-Q |
| 12/31/2019 | 03/02/2020 | 10-K |
| 09/30/2019 | 11/07/2019 | 10-Q |
Recent Forward Guidance
Updated 10/8/2026Latest: Q1 2026 Earnings Reported 5/5/2026
| Forward Guidance | Guidance Change | |||||||
|---|---|---|---|---|---|---|---|---|
| Metric | Source | Low | Mid | High | % Chg | % Delta | Change | Prior |
| 2026 Net Sales | Reported | 3.50 Bil | 3.55 Bil | 3.60 Bil | 0 | Affirmed | Guidance: 3.55 Bil for 2026 | |
| 2026 Adjusted EPS | Reported | 1.4 | 1.45 | 1.5 | 0 | Affirmed | Guidance: 1.45 for 2026 | |
Prior: Q4 2025 Earnings Reported 2/26/2026
| Forward Guidance | Guidance Change | |||||||
|---|---|---|---|---|---|---|---|---|
| Metric | Source | Low | Mid | High | % Chg | % Delta | Change | Prior |
| 2026 Restructuring Charges | Reported | 55.00 Mil | 60.00 Mil | 65.00 Mil | ||||
| 2026 Annualized Cost Savings | Reported | 120.00 Mil | ||||||
| 2026 Revenue | Reported | 3.50 Bil | 3.55 Bil | 3.60 Bil | -2.7% | Lower New | Guidance: 3.65 Bil for 2025 | |
| 2026 Adjusted EPS | Reported | 1.4 | 1.45 | 1.5 | -9.4% | Lower New | Guidance: 1.6 for 2025 | |
Insider Activity
Updated 8/11/2026| # | Owner | Title | Holding | Action | Filing Date | Price | Shares | Transacted Value | Value of Held Shares | Form |
|---|---|---|---|---|---|---|---|---|---|---|
| 1 | Hosein, Clyde | Direct | Buy | 6162026 | 9.98 | 6,500 | 64,902 | 704,696 | Form | |
| 2 | Gladden, Brian T | Direct | Buy | 6152026 | 10.02 | 9,985 | 100,000 | 619,413 | Form | |
| 3 | McKeon, Brian P | a Trust | Buy | 6152026 | 10.12 | 10,000 | 101,200 | 101,200 | Form | |
| 4 | Holden, Betsy D | Direct | Buy | 6152026 | 9.88 | 10,086 | 99,692 | 865,144 | Form | |
| 5 | Barber, Michael J | Direct | Buy | 6152026 | 9.88 | 15,175 | 150,005 | 552,997 | Form |
| # | Owner | Title | Holding | Action | Filing Date | Price | Shares | Transacted Value | Value of Held Shares | Form |
|---|---|---|---|---|---|---|---|---|---|---|
| 1 | Hosein, Clyde | Direct | Buy | 6162026 | 9.98 | 6,500 | 64,902 | 704,696 | Form | |
| 2 | Gladden, Brian T | Direct | Buy | 6152026 | 10.02 | 9,985 | 100,000 | 619,413 | Form | |
| 3 | McKeon, Brian P | a Trust | Buy | 6152026 | 10.12 | 10,000 | 101,200 | 101,200 | Form | |
| 4 | Holden, Betsy D | Direct | Buy | 6152026 | 9.88 | 10,086 | 99,692 | 865,144 | Form | |
| 5 | Barber, Michael J | Direct | Buy | 6152026 | 9.88 | 15,175 | 150,005 | 552,997 | Form | |
| 6 | Lucier, Gregory T | a Trust | Buy | 3092026 | 12.45 | 15,000 | 186,675 | 808,925 | Form | |
| 7 | Forbes, James D | Direct | Buy | 3092026 | 12.48 | 5,000 | 62,400 | 124,800 | Form | |
| 8 | Lucier, Gregory T | a Trust | Buy | 3032026 | 14.03 | 22,445 | 314,858 | 701,400 | Form | |
| 9 | Forbes, James D | Direct | Buy | 3032026 | 13.47 | 5,000 | 67,345 | 67,345 | Form | |
| 10 | Lucier, Gregory T | a Trust | Buy | 3032026 | 14.24 | 27,555 | 392,521 | 392,521 | Form | |
| 11 | Lucier, Gregory T | Direct | Sell | 12102025 | 11.14 | 82,200 | Form | |||
| 12 | Varon, Leslie F | Direct | Buy | 11252025 | 10.71 | 9,337 | 99,999 | 614,143 | Form |
Investor Activity (13F)
Updated Oct 15, 2026Active managers (13F portfolio over $250M, at least 3 holdings) with a position over $5M that is either over 10% of their portfolio or held in a concentrated book of 50 or fewer total positions. Index/ETF, sovereign, bank, community-bank and charitable/donor-advised filers are excluded.
| Active Manager |
|---|
Dentsply Sirona — Investor Video Playlist




External Quote Links
| Y Finance | Barrons |
| TradingView | Morningstar |
| SeekingAlpha | ValueLine |
| Motley Fool | Robinhood |
| CNBC | Etrade |
| MarketWatch | Unusual Whales |
| YCharts | Perplexity Finance |
| FinViz |
Prefer one of these to Trefis? Tell us why.