
Orchestra BioMed (OBIO)
Market Price (10/3/2026): $5.965 | Market Cap: $380.6 MilSector: Health Care | Industry: Biotechnology
Orchestra BioMed (OBIO)
Market Price (10/3/2026): $5.965Market Cap: $380.6 MilSector: Health CareIndustry: Biotechnology
Investment Highlights Why It Matters Detailed financial logic regarding cash flow yields vs trend-riding momentum.
Megatrend and thematic driversMegatrends include Precision Medicine, Aging Population & Chronic Disease, and Digital Health & Telemedicine. Themes include Targeted Therapies, Show more. | Key risksOBIO key risks include [1] failure to obtain regulatory approval for its Virtue® SAB and BackBeat CNT™ product candidates, Show more. |
| Megatrend and thematic driversMegatrends include Precision Medicine, Aging Population & Chronic Disease, and Digital Health & Telemedicine. Themes include Targeted Therapies, Show more. |
| Key risksOBIO key risks include [1] failure to obtain regulatory approval for its Virtue® SAB and BackBeat CNT™ product candidates, Show more. |
Qualitative Assessment
AI Analysis | Feedback
Orchestra BioMed (OBIO) stock has gained about 40% since 6/30/2026 because of the following key factors:
1. Successful Enrollment in Pivotal BACKBEAT Trial Exceeds Targets.
Orchestra BioMed announced on October 1, 2026, that it had surpassed its enrollment goal for the BACKBEAT Global Pivotal Trial of its Atrioventricular Interval Modulation (AVIM) Therapy. By the end of fiscal Q3 2026 (September 30, 2026), 330 patients were randomized, exceeding the initial target of 316 participants. This achievement marks a significant de-risking milestone for their lead product candidate, with primary data presentation targeted for fiscal Q2 2027.
2. Strengthened Financial Position and Strategic Capital Inflow.
The company reported a robust cash balance of $110 million at the end of fiscal Q2 2026 (June 30, 2026), providing a projected cash runway into fiscal Q4 2027 and through key upcoming milestones for its pivotal programs. This strong financial standing was bolstered by $35 million in strategic capital received from Medtronic and Ligand during the fiscal second quarter. Additionally, Orchestra BioMed received a $6.1 million milestone payment in September 2026 from the acquisition of Vivasure by Haemonetics.
Show more
Orchestra BioMed (OBIO) stock has gained about 40% since 6/30/2026 because of the following key factors:
1. Successful Enrollment in Pivotal BACKBEAT Trial Exceeds Targets.
Orchestra BioMed announced on October 1, 2026, that it had surpassed its enrollment goal for the BACKBEAT Global Pivotal Trial of its Atrioventricular Interval Modulation (AVIM) Therapy. By the end of fiscal Q3 2026 (September 30, 2026), 330 patients were randomized, exceeding the initial target of 316 participants. This achievement marks a significant de-risking milestone for their lead product candidate, with primary data presentation targeted for fiscal Q2 2027.
2. Strengthened Financial Position and Strategic Capital Inflow.
The company reported a robust cash balance of $110 million at the end of fiscal Q2 2026 (June 30, 2026), providing a projected cash runway into fiscal Q4 2027 and through key upcoming milestones for its pivotal programs. This strong financial standing was bolstered by $35 million in strategic capital received from Medtronic and Ligand during the fiscal second quarter. Additionally, Orchestra BioMed received a $6.1 million milestone payment in September 2026 from the acquisition of Vivasure by Haemonetics.
3. Positive Analyst Sentiment and Increased Price Targets.
Orchestra BioMed maintains a consensus "Strong Buy" rating from analysts, with an average 12-month price target of $12.14, indicating a significant potential upside from current trading levels. Multiple analyst firms reiterated or raised their price targets during the specified period, reflecting confidence in the company's progress and pipeline.
4. Inclusion in Prestigious Russell Indexes.
Effective June 26, 2026, just prior to the analysis period, Orchestra BioMed was added to both the broad-market Russell 3000® Index and the small-cap Russell 2000® Index. This inclusion significantly increased the company's visibility among institutional investors and index funds, potentially contributing to increased demand for its stock.
Show less
Stock Movement Drivers
Fundamental Drivers
The 47.2% change in OBIO stock from 6/30/2026 to 10/1/2026 was primarily driven by a 53.2% change in the company's P/S Multiple.| (LTM values as of) | 6302026 | 10012026 | Change |
|---|---|---|---|
| Stock Price ($) | 4.32 | 6.35 | 47.2% |
| Change Contribution By: | |||
| Total Revenues ($ Mil) | 33 | 32 | -2.3% |
| P/S Multiple | 8.3 | 12.7 | 53.2% |
| Shares Outstanding (Mil) | 63 | 64 | -1.7% |
| Cumulative Contribution | 47.2% |
Market Drivers
6/30/2026 to 10/1/2026| Return | Correlation | |
|---|---|---|
| OBIO | 47.2% | |
| Market (SPY) | 2.3% | 1.5% |
| Sector (XLV) | 4.8% | -2.8% |
Fundamental Drivers
The 49.4% change in OBIO stock from 3/31/2026 to 10/1/2026 was primarily driven by a 61.1% change in the company's P/S Multiple.| (LTM values as of) | 3312026 | 10012026 | Change |
|---|---|---|---|
| Stock Price ($) | 4.25 | 6.35 | 49.4% |
| Change Contribution By: | |||
| Total Revenues ($ Mil) | 33 | 32 | -4.5% |
| P/S Multiple | 7.9 | 12.7 | 61.1% |
| Shares Outstanding (Mil) | 62 | 64 | -2.9% |
| Cumulative Contribution | 49.4% |
Market Drivers
3/31/2026 to 10/1/2026| Return | Correlation | |
|---|---|---|
| OBIO | 49.4% | |
| Market (SPY) | 17.8% | 14.6% |
| Sector (XLV) | 13.9% | 20.1% |
Fundamental Drivers
The 156.0% change in OBIO stock from 9/30/2025 to 10/1/2026 was primarily driven by a 986.1% change in the company's Total Revenues ($ Mil).| (LTM values as of) | 9302025 | 10012026 | Change |
|---|---|---|---|
| Stock Price ($) | 2.48 | 6.35 | 156.0% |
| Change Contribution By: | |||
| Total Revenues ($ Mil) | 3 | 32 | 986.1% |
| P/S Multiple | 32.3 | 12.7 | -60.8% |
| Shares Outstanding (Mil) | 38 | 64 | -39.8% |
| Cumulative Contribution | 156.0% |
Market Drivers
9/30/2025 to 10/1/2026| Return | Correlation | |
|---|---|---|
| OBIO | 156.0% | |
| Market (SPY) | 15.6% | 24.6% |
| Sector (XLV) | 21.0% | 26.4% |
Fundamental Drivers
The -27.2% change in OBIO stock from 9/30/2023 to 10/1/2026 was primarily driven by a -81.8% change in the company's P/S Multiple.| (LTM values as of) | 9302023 | 10012026 | Change |
|---|---|---|---|
| Stock Price ($) | 8.72 | 6.35 | -27.2% |
| Change Contribution By: | |||
| Total Revenues ($ Mil) | 4 | 32 | 635.9% |
| P/S Multiple | 69.5 | 12.7 | -81.8% |
| Shares Outstanding (Mil) | 35 | 64 | -45.8% |
| Cumulative Contribution | -27.2% |
Market Drivers
9/30/2023 to 10/1/2026| Return | Correlation | |
|---|---|---|
| OBIO | -27.2% | |
| Market (SPY) | 84.9% | 26.5% |
| Sector (XLV) | 35.2% | 20.5% |
Price Returns Compared
| 2021 | 2022 | 2023 | 2024 | 2025 | 2026 | Total [1] | |
|---|---|---|---|---|---|---|---|
| Returns | |||||||
| OBIO Return | -21% | -1% | -9% | -56% | 4% | 47% | -53% |
| Peers Return | 20% | -19% | 10% | -8% | -5% | -30% | -35% |
| S&P 500 Return | 27% | -19% | 24% | 23% | 16% | 12% | 104% |
Monthly Win Rates [3] | |||||||
| OBIO Win Rate | 33% | 67% | 50% | 33% | 33% | 44% | |
| Peers Win Rate | 54% | 44% | 52% | 60% | 52% | 40% | |
| S&P 500 Win Rate | 75% | 42% | 67% | 75% | 67% | 44% | |
Max Drawdowns [4] | |||||||
| OBIO Max Drawdown | -33% | -3% | -80% | -57% | -61% | -28% | |
| Peers Max Drawdown | -18% | -34% | -22% | -19% | -28% | -43% | |
| S&P 500 Max Drawdown | -5% | -25% | -10% | -8% | -19% | -9% | |
[1] Cumulative total returns since the beginning of 2021
[2] Peers: MDT, BSX, ABT, EW, AMIX.
[3] Win Rate = % of calendar months in which monthly returns were positive
[4] Max drawdown represents maximum peak-to-trough decline within a year
[5] 2026 data is for the year up to 10/2/2026 (YTD)
How Low Can It Go
| Event | OBIO | S&P 500 |
|---|---|---|
| 2025 US Tariff Shock | ||
| % Loss | -57.5% | -18.8% |
| % Gain to Breakeven | 135.5% | 23.1% |
| Time to Breakeven | 492 days | 79 days |
| Summer-Fall 2023 Five Percent Yield Shock | ||
| % Loss | -35.8% | -9.5% |
| % Gain to Breakeven | 55.9% | 10.5% |
| Time to Breakeven | 22 days | 24 days |
| 2023 SVB Regional Banking Crisis | ||
| % Loss | -22.1% | -6.7% |
| % Gain to Breakeven | 28.4% | 7.1% |
| Time to Breakeven | 74 days | 31 days |
In The Past
Orchestra BioMed's stock fell -57.5% during the 2025 US Tariff Shock. Such a loss loss requires a 135.5% gain to breakeven.
Preserve Wealth
Limiting losses and compounding gains is essential to preserving wealth.
Asset Allocation
Actively managed asset allocation strategies protect wealth. Learn more.
| Event | OBIO | S&P 500 |
|---|---|---|
| 2025 US Tariff Shock | ||
| % Loss | -57.5% | -18.8% |
| % Gain to Breakeven | 135.5% | 23.1% |
| Time to Breakeven | 492 days | 79 days |
| Summer-Fall 2023 Five Percent Yield Shock | ||
| % Loss | -35.8% | -9.5% |
| % Gain to Breakeven | 55.9% | 10.5% |
| Time to Breakeven | 22 days | 24 days |
| 2023 SVB Regional Banking Crisis | ||
| % Loss | -22.1% | -6.7% |
| % Gain to Breakeven | 28.4% | 7.1% |
| Time to Breakeven | 74 days | 31 days |
In The Past
Orchestra BioMed's stock fell -57.5% during the 2025 US Tariff Shock. Such a loss loss requires a 135.5% gain to breakeven.
Preserve Wealth
Limiting losses and compounding gains is essential to preserving wealth.
Asset Allocation
Actively managed asset allocation strategies protect wealth. Learn more.
About Orchestra BioMed (OBIO)
Orchestra BioMed, trading under the symbol OBIO, operates as a Special Purpose Acquisition Company (SPAC), which is essentially a shell corporation without significant ongoing business operations. Its primary purpose is to identify and effect a business combination with one or more private operating businesses. This strategic maneuver typically involves a merger, share exchange, asset acquisition, share purchase, recapitalization, or reorganization.
As a SPAC, Orchestra BioMed does not currently offer products or services in the conventional sense. Instead, its core "offering" is the vehicle it provides for a private company to become a publicly traded entity. The primary "customers" or "markets" it addresses are twofold: investors who purchase its shares, anticipating a future merger with an attractive operating company, and private businesses seeking an alternative path to the public markets through an acquisition by the SPAC.
AI Analysis | Feedback
Here are 1-2 brief analogies for Orchestra BioMed (OBIO), based on the provided background description of it as a SPAC:
- It's like a publicly traded private equity firm whose sole mission is to acquire one private company and take it public.
- Think of it as a publicly listed investment fund that specializes in finding and acquiring a single private company to bring to the stock market.
AI Analysis | Feedback
- Virtue® Sirolimus-Eluting Balloon (SEB): A drug-eluting balloon designed to prevent restenosis in patients with coronary and peripheral artery disease by delivering sirolimus to the vessel wall.
- BACKBEAT™ Cardiac Neuromodulation Therapy (CNT): A therapy platform under development that aims to reduce blood pressure in pacemaker patients by modulating the autonomic nervous system via specialized pacing.
AI Analysis | Feedback
AI Analysis | Feedback
AI Analysis | Feedback
David P. Hochman, Chairman, Chief Executive Officer and Founder
Mr. Hochman has served as Chairman and Chief Executive Officer of Orchestra BioMed since May 2018. He is also the founder of Orchestra BioMed, Orchestra Medical Ventures, an investment firm focused on creating high-impact medical device therapies, and Accelerated Technologies, Inc., a medical device accelerator company now owned by Orchestra BioMed. With over two decades of experience in healthcare entrepreneurship, venture capital, and investment banking, Mr. Hochman was a co-founder of PROLOR Biotech, Inc., which was acquired by Opko Health for over $600 million in 2013. He also served as a board advisor of Health Dialog Services Corporation, acquired in 2008 by the British United Provident Association for $750 million. Prior to Orchestra Medical Ventures, Mr. Hochman was Chief Executive Officer of Spencer Trask Edison Partners, LLC, an investment partnership focused on early-stage healthcare companies.
Andrew Taylor, Chief Financial Officer
Mr. Taylor was appointed Chief Financial Officer of Orchestra BioMed in June 2023. He brings over 20 years of CFO experience, with the last 15 years in the medical device sector. Previously, Mr. Taylor served as CFO of Motus GI Holdings, Inc., where he helped lead the company's 2018 IPO. He also spent 10 years as CFO and President of Avertix Medical, Inc. (formerly Angel Medical Systems, Inc.) and was CFO and Corporate Director of Operations for Safe3w, Inc. (acquired by iPass).
Darren R. Sherman, President, Chief Operating Officer and Founder
Mr. Sherman serves as President, Chief Operating Officer, and a Founder of Orchestra BioMed.
Bill Little, Executive Vice President, Corporate Development and Strategy
Mr. Little joined Orchestra BioMed in June 2023. Prior to joining Orchestra BioMed, he served as Chief Operating Officer at Neovasc, which was successfully acquired by Shockwave Medical in April 2023. He has 25 years of experience in the medical device industry, including leadership roles at Abbott Vascular, where he was Divisional Vice President of Global Marketing, and St. Jude Medical, where he served as Vice President of Global Cardiovascular Therapies.
Mark Pomeranz, Executive Vice President and General Manager, Interventional Therapies
Mr. Pomeranz joined Orchestra BioMed in November 2024, bringing over 35 years of experience in the medical device industry. He has a track record of commercializing more than 50 products. Prior to Orchestra BioMed, he was CEO of Motus GI and was the founding CEO of Svelte Medical Systems from 2007 to 2014, where he led the development of a drug-eluting stent platform. He also spent nearly a decade at Cordis, a Johnson & Johnson company, as Vice President.
AI Analysis | Feedback
- Clinical Trial and Regulatory Approval Risks: As a company developing medical devices and therapies, Orchestra BioMed is subject to inherent risks associated with the success rates of clinical trials and the arduous process of obtaining regulatory approvals. The company's flagship product candidates, AVIM Therapy for hypertension and Virtue Sirolimus AngioInfusion Balloon (SAB) for atherosclerotic artery disease, are currently in clinical development. The failure of these trials or the inability to secure necessary regulatory approvals (e.g., FDA approval) would significantly impede the company's ability to commercialize its products and generate substantial revenue, making it a fundamentally speculative investment at this stage of development.
- Financial Health and Profitability Challenges: Despite reporting some revenue increases, Orchestra BioMed has demonstrated ongoing challenges with profitability, exhibiting significant net losses and negative earnings per share. The company's net margin and operating margin are substantially negative, reflecting high operational costs, particularly in research and development due to ongoing pivotal studies. While the company has secured new capital and extended its cash runway, persistent unprofitability and significant cash burn raise concerns about its long-term financial stability and its ability to fund crucial clinical programs if substantial, sustainable revenues are not achieved.
- High Stock Volatility: Orchestra BioMed's stock exhibits high volatility, with a beta of 1.9, indicating greater sensitivity to overall market movements. This high volatility suggests that the stock price can experience significant fluctuations, which may present a higher risk for investors.
AI Analysis | Feedback
AI Analysis | Feedback
Orchestra BioMed (OBIO) focuses on two primary product candidates with significant addressable markets:
- Atrioventricular Interval Modulation (AVIM) Therapy (also known as BackBeat Cardiac Neuromodulation Therapy): This therapy is designed for the treatment of hypertension. Orchestra BioMed estimates an addressable market of over 7.7 million patients in the U.S. who meet the criteria for Breakthrough Device Designation for AVIM therapy, specifically those with uncontrolled hypertension and increased cardiovascular risk who are indicated for a pacemaker. Additionally, the company estimates a worldwide annual market comprising at least 3.7 million patients with uncontrolled hypertension not yet indicated for a pacemaker but with high cardiovascular risk and co-morbidities, representing a potential annual revenue opportunity of over $15 billion.
- Virtue® Sirolimus AngioInfusion™ Balloon (Virtue SAB): This product is for the treatment of atherosclerotic artery disease. Orchestra BioMed estimates the total global market opportunity for drug-eluting balloons, which includes Virtue SAB, to be over $10 billion annually. For context, the broader global angioplasty balloons market was valued at US$3 billion in 2023 and is projected to reach US$4.2 billion by the end of 2033, with the United States holding a 40% market share.
AI Analysis | Feedback
Here are 3-5 expected drivers of future revenue growth for Orchestra BioMed (OBIO) over the next 2-3 years:
- Commercialization of BackBeat Cardiac Neuromodulation Therapy (AVIM Therapy) for Hypertension: Orchestra BioMed's flagship product candidate, BackBeat Cardiac Neuromodulation Therapy (CNT), also referred to as Atrioventricular Interval Modulation (AVIM) therapy, is designed to treat hypertension. The company is actively accelerating patient enrollment in the global pivotal BACKBEAT study in collaboration with Medtronic. The AVIM therapy has received FDA Breakthrough Device Designation, which could expedite its path through the regulatory approval process. With an estimated total addressable market of 750,000 patients worldwide annually and a potential revenue opportunity of $2 billion, successful completion of clinical trials and subsequent commercial launch of AVIM therapy are significant revenue drivers.
- Commercialization of Virtue Sirolimus AngioInfusion Balloon (Virtue SAB) for Artery Disease: The Virtue Sirolimus AngioInfusion Balloon (Virtue SAB), a proprietary drug/device combination product, is another lead product candidate aimed at treating atherosclerotic artery disease. Orchestra BioMed has initiated patient enrollments in the Virtue SAB U.S. pivotal trial, comparing it to a commercially available paclitaxel-coated balloon. The company has also established a right of first refusal agreement with Terumo related to Virtue SAB for coronary artery disease, following a new agreement in late 2025 that significantly contributed to 2025 revenue. Future revenue growth is anticipated from the eventual commercialization and market penetration of Virtue SAB through this strategic partnership.
- Expansion and Leveraging of Strategic Partnerships: Orchestra BioMed operates with a partnership-enabled business model, forging collaborations with market-leading global medical device companies to accelerate the commercialization of its products. These partnerships, such as those with Medtronic for AVIM Therapy and Terumo for Virtue SAB, are crucial for sharing development costs and gaining access to established commercial networks and customers globally. The company bolstered its financial position with approximately $150 million in new capital and commitments from strategic transactions with Medtronic, Ligand, and Terumo in the second half of 2025, which underscores the importance of these collaborations for funding and future revenue streams.
- Successful Outcomes of Pivotal Clinical Trials and Regulatory Approvals: A primary driver of future revenue growth hinges on the successful execution and positive outcomes of the ongoing pivotal clinical trials for both AVIM Therapy (BACKBEAT study) and Virtue SAB (Virtue Trial). Favorable results from these trials are essential for obtaining regulatory approvals from bodies like the FDA, which will enable the company and its partners to market and sell these high-impact therapies in large, established global procedure markets.
AI Analysis | Feedback
Share Issuance
- In August 2025, Orchestra BioMed raised approximately $40 million in gross proceeds from a public follow-on offering of 9,413,367 shares of common stock and pre-funded warrants to purchase up to 5,136,363 shares, priced at $2.75 per share.
- As part of strategic transactions in August 2025, Medtronic invested $11.2 million and Ligand invested $5 million in private placements of common stock, contributing to total gross proceeds of $56.2 million from equity offerings including the public offering.
- The number of outstanding shares increased by 48.5% in the past year, indicating substantial dilution.
Inbound Investments
- In the second half of 2025, Orchestra BioMed secured nearly $150 million in new capital and capital commitments through strategic transactions, including partnerships with Medtronic, Ligand, and Terumo.
- In July 2025, Orchestra BioMed secured $70 million in new capital from Ligand Pharmaceuticals and Medtronic. Ligand committed $35 million in exchange for a tiered royalty on future sales and a $5 million equity investment, while Medtronic committed $20 million via a convertible promissory note and $10 million for shares in an equity private placement.
- Terumo invested an additional $20.0 million in Orchestra BioMed through a new series of non-voting convertible preferred stock, convertible into common stock at a minimum of $12 per share.
Outbound Investments
- Orchestra BioMed is expected to receive up to $21 million in total proceeds in connection with the acquisition of Vivasure Medical, a former strategic holding of Orchestra BioMed, by Haemonetics.
Capital Expenditures
- Capital expenditures for Orchestra BioMed Holdings, Inc. were -$489.0 thousand in 2025, representing a 69.2% year-over-year decrease.
- Net cash used in operating activities and for the purchase of fixed assets (excluding certain payments) was $66.9 million in 2025, primarily driven by increased cash outflows for research and development and clinical trial activities.
- Research and development expenses significantly increased by 36% to $58.2 million in 2025, primarily due to the ongoing BACKBEAT global pivotal study and the Virtue SAB program.
Peer Outperformance in Biotechnology
nullLatest Trefis Analyses
| Title | Date | |
|---|---|---|
| DASHBOARDS | ||
| Is Orchestra BioMed Stock Built to Withstand More Downside? | 10/17/2025 |
| Title | |
|---|---|
| ARTICLES |
Research & Analysis
Invest in Strategies
Wealth Management
Peer Comparisons
| Peers to compare with: |
Financials
| Median | |
|---|---|
| Name | |
| Mkt Price | 85.91 |
| Mkt Cap | 86.8 |
| Rev LTM | 29,268 |
| Op Inc LTM | 5,778 |
| FCF LTM | 3,969 |
| FCF 3Y Avg | 3,875 |
| CFO LTM | 6,282 |
| CFO 3Y Avg | 5,588 |
Growth & Margins
| Median | |
|---|---|
| Name | |
| Rev Chg LTM | 11.6% |
| Rev Chg 3Y Avg | 9.6% |
| Rev Chg Q | 13.3% |
| QoQ Delta Rev Chg LTM | 3.2% |
| Op Inc Chg LTM | 11.4% |
| Op Inc Chg 3Y Avg | 7.2% |
| Op Mgn LTM | 20.0% |
| Op Mgn 3Y Avg | 18.8% |
| QoQ Delta Op Mgn LTM | 0.4% |
| CFO/Rev LTM | 21.5% |
| CFO/Rev 3Y Avg | 20.6% |
| FCF/Rev LTM | 16.6% |
| FCF/Rev 3Y Avg | 14.9% |
Segment Financials
Revenue by Segment| $ Mil | 2025 | 2024 | 2023 | 2022 | 2021 |
|---|---|---|---|---|---|
| Development of clinical and preclinical product candidates through risk-reward sharing partnerships | 33 | 3 | 3 | ||
| Partnership revenue | 3 | -1 | |||
| Product revenue | 1 | 1 | |||
| Total | 33 | 3 | 3 | 4 | -1 |
| $ Mil | 2025 | 2024 | 2023 |
|---|---|---|---|
| Development of clinical and preclinical product candidates through risk-reward sharing partnerships | -53 | -61 | -49 |
| Total | -53 | -61 | -49 |
Price Behavior
| Market Price | $6.35 | |
| Market Cap ($ Bil) | 0.4 | |
| First Trading Date | 08/04/2020 | |
| Distance from 52W High | 0.0% | |
| 50 Days | 200 Days | |
| DMA Price | $5.10 | $4.38 |
| DMA Trend | up | up |
| Distance from DMA | 24.4% | 45.1% |
| 3M | 1YR | |
| Volatility | 61.2% | 69.3% |
| Downside Capture | -210.58 | 84.36 |
| Upside Capture | 43.61 | 177.65 |
| Correlation (SPY) | 1.6% | 24.8% |
| 1M | 2M | 3M | 6M | 1Y | 3Y | |
|---|---|---|---|---|---|---|
| Beta | -0.37 | -0.63 | 0.08 | 0.68 | 1.31 | 1.55 |
| Up Beta | -0.54 | 2.29 | 1.75 | 1.78 | 1.99 | 1.28 |
| Down Beta | 3.33 | -1.46 | 0.70 | 1.19 | 0.63 | 1.73 |
| Up Capture | 13% | 12% | 31% | 50% | 265% | 283% |
| Bmk +ve Days | 6 | 16 | 27 | 66 | 132 | 424 |
| Stock +ve Days | 12 | 22 | 30 | 58 | 119 | 362 |
| Down Capture | -307% | -575% | -238% | -49% | 89% | 111% |
| Bmk -ve Days | 16 | 26 | 37 | 60 | 120 | 328 |
| Stock -ve Days | 9 | 19 | 32 | 65 | 126 | 373 |
[1] Upside and downside betas calculated using positive and negative benchmark daily returns respectively
Based On 1-Year Data
| Annualized Return | Annualized Volatility | Sharpe Ratio | Correlation with OBIO | |
|---|---|---|---|---|
| OBIO | 157.0% | 69.2% | 1.63 | - |
| Sector ETF (XLV) | 21.0% | 16.0% | 1.00 | 26.4% |
| Equity (SPY) | 15.7% | 13.0% | 0.85 | 24.6% |
| Gold (GLD) | 7.7% | 29.6% | 0.25 | 14.0% |
| Commodities (DBC) | 45.6% | 20.8% | 1.69 | -18.0% |
| Real Estate (VNQ) | 1.2% | 13.6% | -0.16 | 14.1% |
| Bitcoin (BTCUSD) | -25.7% | 44.5% | -0.54 | 12.4% |
Smart multi-asset allocation framework can stack odds in your favor. Learn How
Based On 5-Year Data
| Annualized Return | Annualized Volatility | Sharpe Ratio | Correlation with OBIO | |
|---|---|---|---|---|
| OBIO | -9.9% | 92.3% | 0.28 | - |
| Sector ETF (XLV) | 6.3% | 15.2% | 0.23 | 15.3% |
| Equity (SPY) | 13.0% | 17.2% | 0.57 | 18.1% |
| Gold (GLD) | 18.6% | 18.9% | 0.80 | 6.8% |
| Commodities (DBC) | 10.6% | 19.6% | 0.42 | 3.4% |
| Real Estate (VNQ) | 0.4% | 18.9% | -0.08 | 13.9% |
| Bitcoin (BTCUSD) | 13.6% | 52.3% | 0.43 | 10.2% |
Smart multi-asset allocation framework can stack odds in your favor. Learn How
Based On 10-Year Data
| Annualized Return | Annualized Volatility | Sharpe Ratio | Correlation with OBIO | |
|---|---|---|---|---|
| OBIO | -6.3% | 84.3% | 0.23 | - |
| Sector ETF (XLV) | 10.4% | 16.7% | 0.51 | 14.5% |
| Equity (SPY) | 15.3% | 17.9% | 0.72 | 17.5% |
| Gold (GLD) | 11.6% | 16.4% | 0.58 | 7.6% |
| Commodities (DBC) | 8.4% | 18.1% | 0.38 | 3.6% |
| Real Estate (VNQ) | 4.4% | 20.7% | 0.17 | 13.2% |
| Bitcoin (BTCUSD) | 64.2% | 66.2% | 1.04 | 10.4% |
Smart multi-asset allocation framework can stack odds in your favor. Learn How
Returns Analyses
SEC Filings
Expand for More| Report Date | Filing Date | Filing |
|---|---|---|
| 06/30/2026 | 08/10/2026 | 10-Q |
| 03/31/2026 | 05/12/2026 | 10-Q |
| 12/31/2025 | 03/12/2026 | 10-K |
| 09/30/2025 | 11/10/2025 | 10-Q |
| 06/30/2025 | 08/12/2025 | 10-Q |
| 03/31/2025 | 05/12/2025 | 10-Q |
| 12/31/2024 | 03/31/2025 | 10-K |
| 09/30/2024 | 11/12/2024 | 10-Q |
| 06/30/2024 | 08/12/2024 | 10-Q |
| 03/31/2024 | 05/13/2024 | 10-Q |
| 12/31/2023 | 03/27/2024 | 10-K |
| 09/30/2023 | 11/13/2023 | 10-Q |
| 06/30/2023 | 08/10/2023 | 10-Q |
| 03/31/2023 | 05/12/2023 | 10-Q |
| 06/30/2022 | 10/24/2022 | S-4/A |
| Report Date | Filing Date | Filing |
|---|---|---|
| 06/30/2026 | 08/10/2026 | 10-Q |
| 03/31/2026 | 05/12/2026 | 10-Q |
| 12/31/2025 | 03/12/2026 | 10-K |
| 09/30/2025 | 11/10/2025 | 10-Q |
| 06/30/2025 | 08/12/2025 | 10-Q |
| 03/31/2025 | 05/12/2025 | 10-Q |
| 12/31/2024 | 03/31/2025 | 10-K |
| 09/30/2024 | 11/12/2024 | 10-Q |
| 06/30/2024 | 08/12/2024 | 10-Q |
| 03/31/2024 | 05/13/2024 | 10-Q |
| 12/31/2023 | 03/27/2024 | 10-K |
| 09/30/2023 | 11/13/2023 | 10-Q |
| 06/30/2023 | 08/10/2023 | 10-Q |
| 03/31/2023 | 05/12/2023 | 10-Q |
| 06/30/2022 | 10/24/2022 | S-4/A |
Insider Activity
Updated 10/2/2026| # | Owner | Title | Holding | Action | Filing Date | Price | Shares | Transacted Value | Value of Held Shares | Form |
|---|---|---|---|---|---|---|---|---|---|---|
| 1 | Sherman, Darren | See Remarks | Direct | Sell | 10022026 | 6.36 | 15,000 | 95,400 | 7,119,397 | Form |
| 2 | Hochman, David P | See Remarks | Direct | Buy | 9082026 | 4.79 | 10,000 | 47,900 | 5,128,873 | Form |
| 3 | Sherman, Darren | See Remarks | Direct | Sell | 9022026 | 4.94 | 15,000 | 74,100 | 5,603,946 | Form |
| 4 | Sherman, Darren | See Remarks | son | Buy | 8282026 | 5.33 | 2,000 | 10,660 | 10,660 | Form |
| 5 | Sherman, Darren | See Remarks | Direct | Sell | 8042026 | 4.09 | 15,000 | 61,350 | 4,721,197 | Form |
| # | Owner | Title | Holding | Action | Filing Date | Price | Shares | Transacted Value | Value of Held Shares | Form |
|---|---|---|---|---|---|---|---|---|---|---|
| 1 | Sherman, Darren | See Remarks | Direct | Sell | 10022026 | 6.36 | 15,000 | 95,400 | 7,119,397 | Form |
| 2 | Hochman, David P | See Remarks | Direct | Buy | 9082026 | 4.79 | 10,000 | 47,900 | 5,128,873 | Form |
| 3 | Sherman, Darren | See Remarks | Direct | Sell | 9022026 | 4.94 | 15,000 | 74,100 | 5,603,946 | Form |
| 4 | Sherman, Darren | See Remarks | son | Buy | 8282026 | 5.33 | 2,000 | 10,660 | 10,660 | Form |
| 5 | Sherman, Darren | See Remarks | Direct | Sell | 8042026 | 4.09 | 15,000 | 61,350 | 4,721,197 | Form |
| 6 | Sherman, Darren | See Remarks | Direct | Sell | 7022026 | 4.27 | 15,000 | 64,050 | 4,993,026 | Form |
| 7 | Hochman, David P | See Remarks | Direct | Buy | 6022026 | 3.83 | 5,000 | 19,150 | 4,075,231 | Form |
| 8 | Sherman, Darren | See Remarks | Direct | Sell | 6022026 | 3.87 | 15,000 | 58,050 | 4,583,345 | Form |
| 9 | Aryeh, Jason | Direct | Buy | 5202026 | 3.75 | 665 | 2,494 | 442,942 | Form | |
| 10 | Fain, Eric S | the Fain Living Trust | Buy | 5182026 | 4.13 | 20,000 | 82,600 | 378,758 | Form | |
| 11 | Rtw, Investments, LP | See footnote | Sell | 4292026 | 4.13 | 32 | 132 | 39,466,540 | Form | |
| 12 | Hochman, David P | See Remarks | Direct | Buy | 3162026 | 4.29 | 10,000 | 42,900 | 4,660,943 | Form |
| 13 | Hochman, David P | See Remarks | Direct | Buy | 11172025 | 4.07 | 5,000 | 20,350 | 2,494,186 | Form |
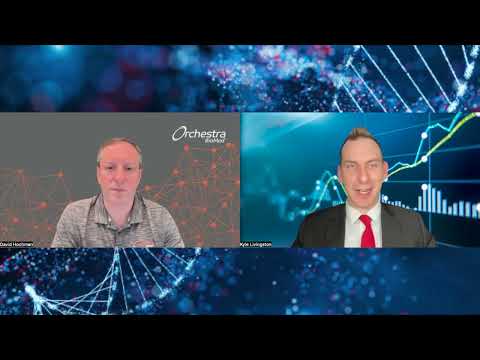
Orchestra BioMed — Investor Video Playlist




Industry Resources
External Quote Links
| Y Finance | Barrons |
| TradingView | Morningstar |
| SeekingAlpha | ValueLine |
| Motley Fool | Robinhood |
| CNBC | Etrade |
| MarketWatch | Unusual Whales |
| YCharts | Perplexity Finance |
| FinViz |
Prefer one of these to Trefis? Tell us why.