
Waters (WAT)
Market Price (10/5/2026): $430.62 | Market Cap: $42.3 BilInvestor Relations Sector: Health Care | Industry: Life Sciences Tools & Services
Waters (WAT)
Market Price (10/5/2026): $430.62Market Cap: $42.3 BilSector: Health CareIndustry: Life Sciences Tools & Services
Investment Highlights Why It Matters Detailed financial logic regarding cash flow yields vs trend-riding momentum.
Strong revenue growthRev Chg LTMRevenue Change % Last Twelve Months (LTM) is 52% Attractive cash flow generationCFO/Rev LTMCash Flow from Operations / Revenue (Sales), Last Twelve Months (LTM) is 12% Low stock price volatilityVol 12M is 35% Megatrend and thematic driversMegatrends include Precision Medicine, Biotechnology & Genomics, and Water Infrastructure. Themes include Biopharmaceutical R&D, Show more. | Trading close to highsDist 52W High is -4.1%, Dist 3Y High is -4.1% Weak multi-year price returns2Y Excs Rtn is -16%, 3Y Excs Rtn is -25% | Expensive valuation multiplesP/EBITPrice/EBIT or Price/(Operating Income) ratio is 118x, P/CFOPrice/(Cash Flow from Operations). CFO is cash before capital expenditures. is 76x, P/EPrice/Earnings or Price/(Net Income) is 251x Yield minus risk free rate is negativeERPEquity Risk Premium (ERP) = Total Yield - Risk Free Rate, Reflects the premium above risk free assets offered by the investment. is -3.5% Key risksWAT key risks include [1] substantial execution and integration challenges stemming from its large-scale acquisition of BD's Biosciences & Diagnostic Solutions unit. |
| Strong revenue growthRev Chg LTMRevenue Change % Last Twelve Months (LTM) is 52% |
| Attractive cash flow generationCFO/Rev LTMCash Flow from Operations / Revenue (Sales), Last Twelve Months (LTM) is 12% |
| Low stock price volatilityVol 12M is 35% |
| Megatrend and thematic driversMegatrends include Precision Medicine, Biotechnology & Genomics, and Water Infrastructure. Themes include Biopharmaceutical R&D, Show more. |
| Trading close to highsDist 52W High is -4.1%, Dist 3Y High is -4.1% |
| Weak multi-year price returns2Y Excs Rtn is -16%, 3Y Excs Rtn is -25% |
| Expensive valuation multiplesP/EBITPrice/EBIT or Price/(Operating Income) ratio is 118x, P/CFOPrice/(Cash Flow from Operations). CFO is cash before capital expenditures. is 76x, P/EPrice/Earnings or Price/(Net Income) is 251x |
| Yield minus risk free rate is negativeERPEquity Risk Premium (ERP) = Total Yield - Risk Free Rate, Reflects the premium above risk free assets offered by the investment. is -3.5% |
| Key risksWAT key risks include [1] substantial execution and integration challenges stemming from its large-scale acquisition of BD's Biosciences & Diagnostic Solutions unit. |
Qualitative Assessment
AI Analysis | Feedback
Waters (WAT) stock has gained about 15% since 6/30/2026 because of the following key factors:
1. Strong fiscal Q2 2026 financial performance and upward revision of full-year guidance.
Waters reported adjusted earnings per share (EPS) of $3.05 for fiscal Q2 2026, surpassing the consensus estimate of $3.01. The company's revenue for the quarter reached $1.645 billion, exceeding analyst expectations of $1.62 billion and representing a 113.3% increase year-over-year. Following these results, Waters raised its full fiscal year 2026 guidance for organic constant currency revenue growth to a range of 7% to 9% and adjusted EPS to between $14.45 and $14.65.
2. Positive analyst sentiment driven by an anticipated strong analytical instrument replacement cycle.
Several analyst firms upgraded Waters' stock rating and increased price targets during the period. Notably, TD Cowen upgraded the stock from "hold" to "buy" and raised its price target from $408 to $475 on August 5, 2026. Similarly, Piper Sandler upgraded Waters to "Overweight" from "Neutral" on August 27, 2026, increasing its price target from $400 to $480, citing a demand recovery and a significant analytical instrument replacement cycle that is still in its earlier stages and expected to continue through at least fiscal year 2027.
Show more
Waters (WAT) stock has gained about 15% since 6/30/2026 because of the following key factors:
1. Strong fiscal Q2 2026 financial performance and upward revision of full-year guidance.
Waters reported adjusted earnings per share (EPS) of $3.05 for fiscal Q2 2026, surpassing the consensus estimate of $3.01. The company's revenue for the quarter reached $1.645 billion, exceeding analyst expectations of $1.62 billion and representing a 113.3% increase year-over-year. Following these results, Waters raised its full fiscal year 2026 guidance for organic constant currency revenue growth to a range of 7% to 9% and adjusted EPS to between $14.45 and $14.65.
2. Positive analyst sentiment driven by an anticipated strong analytical instrument replacement cycle.
Several analyst firms upgraded Waters' stock rating and increased price targets during the period. Notably, TD Cowen upgraded the stock from "hold" to "buy" and raised its price target from $408 to $475 on August 5, 2026. Similarly, Piper Sandler upgraded Waters to "Overweight" from "Neutral" on August 27, 2026, increasing its price target from $400 to $480, citing a demand recovery and a significant analytical instrument replacement cycle that is still in its earlier stages and expected to continue through at least fiscal year 2027.
3. Robust performance of acquired businesses and growth in strategic market segments.
The Biosciences and Diagnostic Solutions (BDS) businesses, acquired from Becton, Dickinson and Company, contributed $817 million in revenue during fiscal Q2 2026, outperforming the company's guidance by $15 million. Additionally, Waters experienced strong demand in key areas, with GLP-1 testing contributing over 40% growth in fiscal Q2 2026. The company also noted that the China market has become accretive due to improvements in the biotech and pharma sectors, supported by localization strategies and new government reimbursement policies. Strategic product launches, such as the BD FACSDiscover A7 Cell Analyzer in September 2026, further contributed to market optimism.
Show less
Stock Movement Drivers
Fundamental Drivers
The 13.4% change in WAT stock from 6/30/2026 to 10/4/2026 was primarily driven by a 266.5% change in the company's P/E Multiple.| (LTM values as of) | 6302026 | 10042026 | Change |
|---|---|---|---|
| Stock Price ($) | 375.04 | 425.21 | 13.4% |
| Change Contribution By: | |||
| Total Revenues ($ Mil) | 3,770 | 4,644 | 23.2% |
| Net Income Margin (%) | 11.9% | 3.6% | -70.0% |
| P/E Multiple | 68.6 | 251.3 | 266.5% |
| Shares Outstanding (Mil) | 82 | 98 | -16.4% |
| Cumulative Contribution | 13.4% |
Market Drivers
6/30/2026 to 10/4/2026| Return | Correlation | |
|---|---|---|
| WAT | 13.4% | |
| Market (SPY) | 3.1% | 39.5% |
| Sector (XLV) | 4.7% | 45.0% |
Fundamental Drivers
The 42.8% change in WAT stock from 3/31/2026 to 10/4/2026 was primarily driven by a 810.1% change in the company's P/E Multiple.| (LTM values as of) | 3312026 | 10042026 | Change |
|---|---|---|---|
| Stock Price ($) | 297.80 | 425.21 | 42.8% |
| Change Contribution By: | |||
| Total Revenues ($ Mil) | 3,165 | 4,644 | 46.7% |
| Net Income Margin (%) | 20.3% | 3.6% | -82.4% |
| P/E Multiple | 27.6 | 251.3 | 810.1% |
| Shares Outstanding (Mil) | 60 | 98 | -39.4% |
| Cumulative Contribution | 42.8% |
Market Drivers
3/31/2026 to 10/4/2026| Return | Correlation | |
|---|---|---|
| WAT | 42.8% | |
| Market (SPY) | 18.6% | 31.8% |
| Sector (XLV) | 13.8% | 32.8% |
Fundamental Drivers
The 41.8% change in WAT stock from 9/30/2025 to 10/4/2026 was primarily driven by a 831.0% change in the company's P/E Multiple.| (LTM values as of) | 9302025 | 10042026 | Change |
|---|---|---|---|
| Stock Price ($) | 299.81 | 425.21 | 41.8% |
| Change Contribution By: | |||
| Total Revenues ($ Mil) | 3,046 | 4,644 | 52.5% |
| Net Income Margin (%) | 21.7% | 3.6% | -83.5% |
| P/E Multiple | 27.0 | 251.3 | 831.0% |
| Shares Outstanding (Mil) | 60 | 98 | -39.4% |
| Cumulative Contribution | 41.8% |
Market Drivers
9/30/2025 to 10/4/2026| Return | Correlation | |
|---|---|---|
| WAT | 41.8% | |
| Market (SPY) | 16.5% | 30.8% |
| Sector (XLV) | 20.9% | 40.2% |
Fundamental Drivers
The 55.1% change in WAT stock from 9/30/2023 to 10/4/2026 was primarily driven by a 950.5% change in the company's P/E Multiple.| (LTM values as of) | 9302023 | 10042026 | Change |
|---|---|---|---|
| Stock Price ($) | 274.21 | 425.21 | 55.1% |
| Change Contribution By: | |||
| Total Revenues ($ Mil) | 2,992 | 4,644 | 55.2% |
| Net Income Margin (%) | 22.5% | 3.6% | -84.1% |
| P/E Multiple | 23.9 | 251.3 | 950.5% |
| Shares Outstanding (Mil) | 59 | 98 | -40.1% |
| Cumulative Contribution | 55.1% |
Market Drivers
9/30/2023 to 10/4/2026| Return | Correlation | |
|---|---|---|
| WAT | 55.1% | |
| Market (SPY) | 86.2% | 41.9% |
| Sector (XLV) | 35.2% | 49.6% |
Price Returns Compared
| 2021 | 2022 | 2023 | 2024 | 2025 | 2026 | Total [1] | |
|---|---|---|---|---|---|---|---|
| Returns | |||||||
| WAT Return | 51% | -8% | -4% | 13% | 2% | 16% | 78% |
| Peers Return | 43% | -17% | -10% | -0% | 3% | 22% | 33% |
| S&P 500 Return | 27% | -19% | 24% | 23% | 16% | 12% | 104% |
Monthly Win Rates [3] | |||||||
| WAT Win Rate | 83% | 42% | 42% | 50% | 42% | 56% | |
| Peers Win Rate | 80% | 40% | 45% | 43% | 50% | 56% | |
| S&P 500 Win Rate | 75% | 42% | 67% | 75% | 67% | 44% | |
Max Drawdowns [4] | |||||||
| WAT Max Drawdown | -23% | -28% | -32% | -22% | -33% | -29% | |
| Peers Max Drawdown | -18% | -32% | -34% | -19% | -33% | -30% | |
| S&P 500 Max Drawdown | -5% | -25% | -10% | -8% | -19% | -9% | |
[1] Cumulative total returns since the beginning of 2021
[2] Peers: A, TMO, DHR, RVTY, MTD. See WAT Returns vs. Peers.
[3] Win Rate = % of calendar months in which monthly returns were positive
[4] Max drawdown represents maximum peak-to-trough decline within a year
[5] 2026 data is for the year up to 10/2/2026 (YTD)
How Low Can It Go
| Event | WAT | S&P 500 |
|---|---|---|
| 2025 US Tariff Shock | ||
| % Loss | -18.6% | -18.8% |
| % Gain to Breakeven | 22.8% | 23.1% |
| Time to Breakeven | 217 days | 79 days |
| Summer-Fall 2023 Five Percent Yield Shock | ||
| % Loss | -17.4% | -9.5% |
| % Gain to Breakeven | 21.1% | 10.5% |
| Time to Breakeven | 32 days | 24 days |
| 2023 SVB Regional Banking Crisis | ||
| % Loss | -26.5% | -6.7% |
| % Gain to Breakeven | 36.0% | 7.1% |
| Time to Breakeven | 266 days | 31 days |
| 2022 Inflation Shock & Fed Tightening | ||
| % Loss | -26.1% | -24.5% |
| % Gain to Breakeven | 35.3% | 32.4% |
| Time to Breakeven | 763 days | 427 days |
| 2020 COVID-19 Crash | ||
| % Loss | -25.1% | -33.7% |
| % Gain to Breakeven | 33.4% | 50.9% |
| Time to Breakeven | 114 days | 140 days |
| Q4 2018 Fed Policy Error / Growth Scare | ||
| % Loss | -10.3% | -19.2% |
| % Gain to Breakeven | 11.5% | 23.8% |
| Time to Breakeven | 16 days | 105 days |
In The Past
Waters's stock fell -18.6% during the 2025 US Tariff Shock. Such a loss loss requires a 22.8% gain to breakeven.
Preserve Wealth
Limiting losses and compounding gains is essential to preserving wealth.
Asset Allocation
Actively managed asset allocation strategies protect wealth. Learn more.
| Event | WAT | S&P 500 |
|---|---|---|
| 2023 SVB Regional Banking Crisis | ||
| % Loss | -26.5% | -6.7% |
| % Gain to Breakeven | 36.0% | 7.1% |
| Time to Breakeven | 266 days | 31 days |
| 2022 Inflation Shock & Fed Tightening | ||
| % Loss | -26.1% | -24.5% |
| % Gain to Breakeven | 35.3% | 32.4% |
| Time to Breakeven | 763 days | 427 days |
| 2020 COVID-19 Crash | ||
| % Loss | -25.1% | -33.7% |
| % Gain to Breakeven | 33.4% | 50.9% |
| Time to Breakeven | 114 days | 140 days |
| 2011 US Debt Ceiling Crisis & European Contagion | ||
| % Loss | -26.4% | -17.9% |
| % Gain to Breakeven | 35.8% | 21.8% |
| Time to Breakeven | 636 days | 123 days |
| 2008-2009 Global Financial Crisis | ||
| % Loss | -61.4% | -53.4% |
| % Gain to Breakeven | 159.0% | 114.4% |
| Time to Breakeven | 638 days | 1085 days |
In The Past
Waters's stock fell -18.6% during the 2025 US Tariff Shock. Such a loss loss requires a 22.8% gain to breakeven.
Preserve Wealth
Limiting losses and compounding gains is essential to preserving wealth.
Asset Allocation
Actively managed asset allocation strategies protect wealth. Learn more.
About Waters (WAT)
Waters Corporation (WAT) is a global specialty measurement company that provides analytical workflow solutions. Essentially, Waters equips laboratories across various industries with advanced instrumentation and software designed to analyze and understand the composition and properties of different substances. The company operates through two main segments: "Waters," which focuses on separation and identification technologies, and "TA," specializing in material characterization.
The "Waters" segment offers high-performance liquid chromatography (HPLC) and mass spectrometry (MS) systems, along with support products like chromatography columns, consumables, and software. These instruments are vital for applications such as drug discovery and development, clinical trial testing, protein analysis, nutritional safety, and environmental testing. The "TA" segment provides thermal analysis, rheometry, and calorimetry instruments, which are used to predict the suitability and stability of materials like fine chemicals, pharmaceuticals, polymers, and metals across industrial, consumer goods, healthcare, and life science research.
Waters' diverse product portfolio serves a broad range of scientific and industrial customers globally. Its primary clients include organizations in the life science, pharmaceutical, biochemical, industrial, nutritional safety, environmental, academic, and governmental sectors. These customers utilize Waters' cutting-edge technology for critical research and development activities, quality assurance, and other essential laboratory applications worldwide.
AI Analysis | Feedback
The Applied Materials of scientific labs, providing high-tech instruments for chemical analysis.
A more specialized Thermo Fisher Scientific, focused on advanced instruments for chemical measurement.
The KLA Corporation for life science and industrial labs, delivering critical precision analysis tools.
AI Analysis | Feedback
- Liquid Chromatography (LC) Systems: Instruments designed for separating, identifying, and quantifying components in a sample.
- Mass Spectrometry (MS) Systems: Advanced instruments used for detailed molecular analysis in various scientific and industrial applications.
- Thermal Analysis, Rheometry, and Calorimetry Instruments: Devices for measuring material properties such as heat flow, viscosity, and thermal transitions.
- Chromatography Consumables: Essential products like columns and other supplies required for the operation of chromatography systems.
- Software Solutions: Software-based products that interface with and enhance the functionality of their analytical instruments.
- Post-Warranty Service Plans: Services providing maintenance and support for their analytical instruments beyond the initial warranty period.
AI Analysis | Feedback
Major Customers of Waters Corporation (WAT)
Waters Corporation primarily sells its analytical workflow solutions, instruments, and services to other organizations and companies, rather than individuals.
Based on the provided background information, specific names of individual customer companies are not disclosed. However, Waters Corporation identifies its major customer segments across various sectors:
- Life science organizations
- Pharmaceutical companies (for drug discovery, development, clinical trial testing)
- Biochemical industries (for protein analysis in disease processes)
- Industrial customers
- Nutritional safety analysis laboratories
- Environmental testing organizations
- Academic institutions (for research and development)
- Governmental agencies (for research and development, quality assurance, and other laboratory applications)
AI Analysis | Feedback
AI Analysis | Feedback
Udit Batra, Ph.D. President and Chief Executive Officer
Dr. Udit Batra joined Waters Corporation as President and CEO in September 2020. He brings over two decades of leadership and operational expertise in healthcare and life sciences. Prior to Waters, he served as CEO of MilliporeSigma, an $8 billion global business with over 22,000 employees. In 2015, he led the formation of MilliporeSigma, which was the largest merger in the life sciences tools industry at the time. From 2011-2013, Dr. Batra was CEO of Merck KGaA's consumer health business, where he doubled its profitability. Earlier in his career, he held various leadership positions at Novartis.
Amol Chaubal Senior Vice President, Chief Financial Officer
Amol Chaubal was appointed Chief Financial Officer at Waters Corporation in 2021. He is responsible for all aspects of the Finance and Information Technology organizations. Before joining Waters, Mr. Chaubal served as CFO at Quanterix starting in 2019. From 2017 to 2019, he was Chief Financial Officer of Global Operations at Smith & Nephew. Prior to that, he was Corporate Vice President and Head of Finance for PAREXEL's Clinical Research Services and Access businesses from 2015 to 2017. He has finance leadership experience across consumer products, pharma, and energy sectors.
Jianqing Bennett Senior Vice President, TA Instruments Division and Waters Clinical Business
Jianqing Bennett serves as the Senior Vice President of the TA Instruments Division and Waters Clinical Business. She previously served as Senior Vice President of TA Instruments Division and as Senior Vice President of high growth markets at Beckman Coulter Diagnostics since 2017.
Rob Carpio Senior Vice President, Waters Division
Rob Carpio is the Senior Vice President of the Waters Division. He was previously the Senior Vice President of Waters Analytical Sciences.
Keeley Aleman Senior Vice President, General Counsel & Secretary
Keeley Aleman holds the position of Senior Vice President, General Counsel & Secretary at Waters Corporation.
AI Analysis | Feedback
-
Integration and Execution Risk from Mergers and Acquisitions: Waters Corporation's growth strategy relies significantly on mergers and acquisitions (M&A), including the recent, transformative acquisition of BDX's Biosciences & Dx business. This strategy exposes the company to substantial execution and integration risks. Challenges may arise from integrating cultural differences, resolving operational incompatibilities, and managing unforeseen complications, which could delay or diminish the expected synergies. There is also a risk of overpaying for acquisitions in a competitive market, potentially straining financial resources and leading to future goodwill impairments. Difficulties in integration could result in temporary operational disruptions, increased costs, or slower realization of revenue synergies, impacting financial performance and investor confidence.
-
Intense Competition and the Continuous Need for Innovation: The analytical instruments market, in which Waters Corporation operates, is highly competitive, featuring global suppliers such as Agilent, Thermo Fisher Scientific, and Danaher. To maintain its competitive edge and market share, Waters must continuously innovate, particularly with its high and ultra-performance liquid chromatography and mass spectrometry (LC/MS) technology systems. Competitors, some with more diversified portfolios or greater financial resources, may challenge Waters' position through aggressive pricing strategies or new technological advancements, necessitating ongoing investment in research and development.
-
Dependence on the Biopharmaceutical Sector and Exposure to Regulatory Changes: Waters Corporation has strong ties to and a significant focus on the biopharmaceutical and biotechnology sectors. While this specialization is a strength, it also creates a concentration risk. Any downturns, shifts in drug discovery and development trends, or significant regulatory changes within the healthcare sector could disproportionately impact the demand for Waters' products and services, thereby affecting its financial performance.
AI Analysis | Feedback
AI Analysis | Feedback
Waters Corporation operates in several key analytical instrumentation markets globally, providing solutions in liquid chromatography, mass spectrometry, chromatography consumables, thermal analysis, rheometry, and calorimetry.
Addressable Markets for Waters Corporation's Main Products and Services:
- High and Ultra-Performance Liquid Chromatography (HPLC/UPLC) Systems: The global high-performance liquid chromatography market was valued at approximately USD 5.41 billion in 2024 and is projected to reach about USD 8.92 billion by 2034, growing at a CAGR of 5.2% during the forecast period (2025–2034). North America held the largest market share for HPLC in 2025, accounting for 37.66% of the global market.
- Mass Spectrometry (MS) Technology Systems: The global mass spectrometer market was valued at approximately USD 7.16 billion in 2024 and is poised to grow to about USD 13.73 billion by 2033, exhibiting a CAGR of 7.5% during the forecast period (2026–2033). North America dominated the global market for mass spectrometry with a 38.58% share in 2018. The U.S. mass spectrometry market alone was estimated at USD 2.38 billion in 2025 and is expected to reach USD 4.97 billion by 2035.
- Chromatography Columns and Other Consumable Products: The global chromatography consumables market was valued at approximately USD 4.75 billion in 2024 and is projected to grow to about USD 9.5 billion by 2033, with a CAGR of 8% (2026–2033). North America held the major market share, with a market size of approximately USD 1.71 billion in 2025.
- Thermal Analysis Instruments: The global thermal analysis instruments market was valued at approximately USD 552.65 million in 2024 and is expected to reach about USD 828.39 million by 2033, growing at a CAGR of 4.6% from 2025 to 2033. North America is estimated to hold the highest share in the global thermal analysis market, with approximately 38% of the global market share in 2025. The U.S. market was valued at USD 286.4 million in 2024.
- Rheometry Instruments: The global rheometer market size was valued at approximately USD 900 million in 2024 and is expected to reach nearly USD 1.23 billion by 2032, growing at a CAGR of 4.5% from 2025 to 2032. North America dominates this market due to strong industrial infrastructure and research investment, holding 38.12% of the global market share in 2025.
- Calorimetry Instruments: The global calorimeter market was valued at approximately USD 280 million in 2024 and is projected to reach about USD 391.17 million by 2034, growing at a CAGR of 3.4% during the forecast period (2025–2034). North America leads the global calorimeter market with a 34% share.
AI Analysis | Feedback
- New Product Innovation and Differentiated Portfolio: Waters Corporation anticipates revenue growth from its ongoing pipeline of innovative new products and a differentiated portfolio of analytical workflow solutions. This includes instruments such as high and ultra-performance liquid chromatography (LC), mass spectrometry (MS) technology systems, and specific product lines like the Alliance iS, Xevo TQ Absolute, and Max Peak Premier Columns. These new offerings are expected to drive adoption and expand the company's market reach.
- Growth in Key Market Segments and High-Demand Applications: The company expects continued strong performance in the pharmaceutical market, its largest end market. Specific "idiosyncratic growth drivers" include increasing demand for GLP-1 (Glucagon-like peptide-1) related testing and PFAS (per- and polyfluoroalkyl substances) testing, which are projected to contribute significantly to annual growth. Additionally, the growing generics market in India is anticipated to add to revenue growth.
- Recurring Revenue Expansion: Waters is focused on expanding its recurring revenue streams, which primarily consist of service and chemistry consumables. Efforts to increase service plan attachment rates and the strong demand for chemistry consumables, particularly new bioseparations products, are expected to provide a stable and growing revenue base.
- Strategic Acquisitions: The acquisition of BD's Biosciences and Diagnostic Solutions business, completed in early 2026, is a significant expected driver of future revenue. This transformative acquisition is projected to add substantial reported revenue, with an anticipated contribution of approximately $3.000 billion for the full year 2026, and is expected to bring revenue synergies and expand Waters' position in high-growth adjacencies. The earlier acquisition of Wyatt Technology in 2023 also contributed to growth in 2024.
- Instrument Replacement Cycles and Commercial Excellence Initiatives: The company is benefiting from ongoing instrument replacement cycles, where customers upgrade older equipment. Waters is also implementing commercial excellence initiatives, including enhanced e-commerce capabilities and a focus on service attachment, to capture this demand and drive overall revenue growth. The transition to a subscription-based model for Empower is also seen as strategically attractive for long-term recurring revenue benefits.
AI Analysis | Feedback
Share Repurchases
- Waters Corporation did not make any open market share repurchases in 2024 or 2025.
- The company repurchased $14 million and $13 million of common stock related to the vesting of restricted stock units during the six months ended June 28, 2025, and June 29, 2024, respectively.
- For the three months ended March 30, 2024, and April 1, 2023, Waters repurchased $13 million and $11 million of common stock, respectively, related to the vesting of restricted stock units.
Share Issuance
- Waters shareholders approved the issuance of Waters common stock to Becton, Dickinson and Company (BD) shareholders in connection with the proposed combination of BD's Biosciences & Diagnostic Solutions business with Waters, a transaction expected to close on February 9, 2026.
- Upon the completion of this merger, BD's shareholders are expected to own approximately 39.2% of the combined company, and existing Waters Corporation shareholders are expected to own approximately 60.8%.
- The updated capital structure for 2026 projects approximately 94.3 million diluted shares outstanding on a full-year average basis, with the new share count at closing being 98.4 million shares.
Outbound Investments
- Waters Corporation announced the acquisition of BD's Biosciences and Diagnostic Solutions business, a move anticipated to be transformative and drive revenue synergies and cost efficiencies.
- As a condition of the distribution related to the BD transaction, the SpinCo (BD's business) was to make a cash payment to BD of $4.0 billion.
Capital Expenditures
- In the last 12 months (prior to February 2026), capital expenditures amounted to -$112.75 million.
- Waters plans to invest more in India and focus on biologics, glucagon-like peptide 1 (GLP-1) testing, and per- and polyfluoroalkyl substances (PFAS) testing.
- The company is also accelerating strategic research and development investments in chemistry and informatics.
Peer Outperformance in Life Sciences Tools & Services
| Ticker | Name | Rev Growth 3Y Avg | P/E | 1Y | 3Y | 5Y | 5Y Gap |
|---|---|---|---|---|---|---|---|
| WAT | Waters | 18.2% | 251.3x | 29.5% | 59.9% | 21.7% | — |
| MEDP | Medpace | 18.7% | 34.4x | 12.6% | 145.6% | 210.1% | +188pp |
| Industry | Names | 1Y med | 3Y med | 5Y med | Top 3 by 5Y |
|---|---|---|---|---|---|
| Health Care Distributors | 6 | 12.8% | 43.2% | 91.3% | CAH 414% · MCK 366% · COR 175% |
| Health Care Services | 20 | 18.8% | 36.3% | 9.1% | HIMS 295% · RDNT 144% · DGX 81% |
| Managed Health Care | 8 | 25.4% | -8.6% | 4.2% | OSCR 92% · HQY 38% · ELV 11% |
| Health Care Facilities | 24 | -2.1% | 5.0% | -3.6% | THC 291% · NHC 272% · ENSG 131% |
| Health Care Equipment | 50 | -8.9% | -0.2% | -16.2% | POCI 11050% · UFPT 374% · GKOS 253% |
| Pharmaceuticals | 62 | -7.4% | -2.8% | -30.9% | INDV 1117% · ETON 1046% · LQDA 953% |
| Health Care Supplies | 12 | 21.5% | -4.9% | -37.5% | LNTH 296% · HAE 52% · MMSI 19% |
| Life Sciences Tools & Services ← | 109 | -5.7% | -11.3% | -66.7% | SNWV 1867% · NTRA 269% · MEDP 210% |
| Health Care Technology | 21 | -35.8% | -55.3% | -79.1% | SPOK 79% · HSTM 10% · VEEV -2% |
| Biotechnology | 362 | -18.3% | -24.6% | -79.3% | CELZ 1252% · ELVN 1139% · DNTH 1108% |
Latest Trefis Analyses
Research & Analysis
Invest in Strategies
Wealth Management
Peer Comparisons
| Peers to compare with: |
Financials
| Median | |
|---|---|
| Name | |
| Mkt Price | 323.39 |
| Mkt Cap | 44.9 |
| Rev LTM | 6,008 |
| Op Inc LTM | 1,407 |
| FCF LTM | 1,065 |
| FCF 3Y Avg | 1,064 |
| CFO LTM | 1,292 |
| CFO 3Y Avg | 1,302 |
Growth & Margins
| Median | |
|---|---|
| Name | |
| Rev Chg LTM | 7.1% |
| Rev Chg 3Y Avg | 2.1% |
| Rev Chg Q | 6.8% |
| QoQ Delta Rev Chg LTM | 1.6% |
| Op Inc Chg LTM | 7.4% |
| Op Inc Chg 3Y Avg | 0.2% |
| Op Mgn LTM | 19.4% |
| Op Mgn 3Y Avg | 20.5% |
| QoQ Delta Op Mgn LTM | 0.4% |
| CFO/Rev LTM | 21.7% |
| CFO/Rev 3Y Avg | 22.0% |
| FCF/Rev LTM | 18.2% |
| FCF/Rev 3Y Avg | 17.7% |
Segment Financials
Revenue by Segment| $ Mil | 2025 | 2024 | 2023 | 2022 | 2021 |
|---|---|---|---|---|---|
| Waters instrument systems | 1,102 | 1,032 | 1,109 | 1,210 | 1,089 |
| Waters service | 1,080 | 1,006 | 951 | 891 | 877 |
| Chemistry consumables | 631 | 565 | 541 | 525 | 507 |
| Thermal Analysis (TA) instrument systems | 244 | 246 | 253 | 252 | 226 |
| Thermal Analysis (TA) service | 108 | 108 | 102 | 93 | 87 |
| Total | 3,165 | 2,958 | 2,956 | 2,972 | 2,786 |
Price Behavior
| Market Price | $425.21 | |
| Market Cap ($ Bil) | 41.8 | |
| First Trading Date | 11/17/1995 | |
| Distance from 52W High | -4.1% | |
| 50 Days | 200 Days | |
| DMA Price | $410.18 | $363.14 |
| DMA Trend | up | up |
| Distance from DMA | 3.7% | 17.1% |
| 3M | 1YR | |
| Volatility | 27.5% | 35.3% |
| Downside Capture | 73.34 | 65.29 |
| Upside Capture | 120.15 | 84.00 |
| Correlation (SPY) | 40.4% | 31.1% |
| 1M | 2M | 3M | 6M | 1Y | 3Y | |
|---|---|---|---|---|---|---|
| Beta | 0.88 | 1.33 | 1.01 | 0.95 | 0.86 | 0.98 |
| Up Beta | -0.31 | 0.83 | 0.92 | 1.05 | 1.04 | 1.00 |
| Down Beta | 0.85 | 2.07 | 0.58 | 1.03 | 0.74 | 0.83 |
| Up Capture | 136% | 188% | 150% | 119% | 100% | 103% |
| Bmk +ve Days | 6 | 16 | 27 | 66 | 132 | 424 |
| Stock +ve Days | 14 | 25 | 35 | 66 | 127 | 372 |
| Down Capture | 26% | 63% | 67% | 52% | 70% | 102% |
| Bmk -ve Days | 16 | 26 | 37 | 60 | 120 | 328 |
| Stock -ve Days | 8 | 17 | 29 | 60 | 125 | 378 |
[1] Upside and downside betas calculated using positive and negative benchmark daily returns respectively
Based On 1-Year Data
| Annualized Return | Annualized Volatility | Sharpe Ratio | Correlation with WAT | |
|---|---|---|---|---|
| WAT | 33.1% | 35.2% | 0.86 | - |
| Sector ETF (XLV) | 17.4% | 15.7% | 0.82 | 38.1% |
| Equity (SPY) | 16.2% | 13.0% | 0.88 | 30.9% |
| Gold (GLD) | 6.8% | 29.6% | 0.22 | 11.1% |
| Commodities (DBC) | 44.9% | 20.8% | 1.67 | -19.5% |
| Real Estate (VNQ) | 1.5% | 13.6% | -0.15 | 18.0% |
| Bitcoin (BTCUSD) | -28.9% | 44.3% | -0.64 | 10.8% |
Smart multi-asset allocation framework can stack odds in your favor. Learn How
Based On 5-Year Data
| Annualized Return | Annualized Volatility | Sharpe Ratio | Correlation with WAT | |
|---|---|---|---|---|
| WAT | 1.9% | 33.9% | 0.11 | - |
| Sector ETF (XLV) | 6.4% | 15.2% | 0.23 | 54.7% |
| Equity (SPY) | 13.1% | 17.2% | 0.58 | 49.3% |
| Gold (GLD) | 18.4% | 18.9% | 0.79 | 10.1% |
| Commodities (DBC) | 10.3% | 19.6% | 0.41 | 1.8% |
| Real Estate (VNQ) | 0.7% | 18.8% | -0.07 | 43.8% |
| Bitcoin (BTCUSD) | 14.6% | 52.2% | 0.45 | 15.3% |
Smart multi-asset allocation framework can stack odds in your favor. Learn How
Based On 10-Year Data
| Annualized Return | Annualized Volatility | Sharpe Ratio | Correlation with WAT | |
|---|---|---|---|---|
| WAT | 10.6% | 30.9% | 0.39 | - |
| Sector ETF (XLV) | 10.4% | 16.7% | 0.50 | 56.6% |
| Equity (SPY) | 15.3% | 17.9% | 0.72 | 54.4% |
| Gold (GLD) | 11.5% | 16.4% | 0.57 | 6.7% |
| Commodities (DBC) | 8.2% | 18.1% | 0.37 | 9.5% |
| Real Estate (VNQ) | 4.2% | 20.7% | 0.16 | 43.0% |
| Bitcoin (BTCUSD) | 64.1% | 66.2% | 1.04 | 12.4% |
Smart multi-asset allocation framework can stack odds in your favor. Learn How
Returns Analyses
Earnings Returns History
Updated 9/4/2026| Forward Returns | |||
|---|---|---|---|
| Earnings Date | 1D Returns | 5D Returns | 21D Returns |
| 8/4/2026 | 5.7% | 9.9% | 8.3% |
| 5/5/2026 | 13.5% | 15.3% | 25.8% |
| 2/9/2026 | -13.9% | -15.2% | -21.4% |
| 11/4/2025 | 6.3% | 9.0% | 14.7% |
| 8/4/2025 | -1.6% | -3.1% | 2.1% |
| 5/6/2025 | -2.7% | 5.3% | 1.4% |
| 2/12/2025 | -5.8% | -6.7% | -10.1% |
| 11/1/2024 | 19.8% | 19.5% | 19.8% |
| ... | |||
| SUMMARY STATS | |||
| # Positive | 16 | 15 | 15 |
| # Negative | 8 | 9 | 9 |
| Median Positive | 3.1% | 5.4% | 6.5% |
| Median Negative | -5.0% | -5.4% | -9.9% |
| Max Positive | 19.8% | 19.5% | 25.8% |
| Max Negative | -13.9% | -15.2% | -21.4% |
| Forward Returns | |||
|---|---|---|---|
| Earnings Date | 1D Returns | 5D Returns | 21D Returns |
| 8/4/2026 | 5.7% | 9.9% | 8.3% |
| 5/5/2026 | 13.5% | 15.3% | 25.8% |
| 2/9/2026 | -13.9% | -15.2% | -21.4% |
| 11/4/2025 | 6.3% | 9.0% | 14.7% |
| 8/4/2025 | -1.6% | -3.1% | 2.1% |
| 5/6/2025 | -2.7% | 5.3% | 1.4% |
| 2/12/2025 | -5.8% | -6.7% | -10.1% |
| 11/1/2024 | 19.8% | 19.5% | 19.8% |
| 7/31/2024 | 2.6% | 1.0% | 4.1% |
| 5/7/2024 | 1.9% | 9.2% | -4.0% |
| 2/6/2024 | 1.7% | -1.4% | 7.4% |
| 11/7/2023 | 3.4% | -0.5% | 14.8% |
| 8/2/2023 | 6.3% | 8.1% | 4.7% |
| 5/9/2023 | -6.7% | -7.8% | -13.3% |
| 2/15/2023 | -0.7% | -5.4% | -9.4% |
| 11/1/2022 | 2.8% | 2.4% | 15.9% |
| 8/2/2022 | -6.8% | -9.1% | -18.1% |
| 5/3/2022 | 8.1% | 4.6% | 6.4% |
| 2/1/2022 | 1.1% | 1.8% | -1.4% |
| 11/2/2021 | -4.3% | -4.0% | -9.9% |
| 8/3/2021 | 0.7% | 1.2% | 6.5% |
| 5/5/2021 | 2.9% | 5.4% | 5.5% |
| 2/2/2021 | 8.4% | 5.8% | -1.1% |
| 10/27/2020 | 1.7% | 0.9% | 5.4% |
| SUMMARY STATS | |||
| # Positive | 16 | 15 | 15 |
| # Negative | 8 | 9 | 9 |
| Median Positive | 3.1% | 5.4% | 6.5% |
| Median Negative | -5.0% | -5.4% | -9.9% |
| Max Positive | 19.8% | 19.5% | 25.8% |
| Max Negative | -13.9% | -15.2% | -21.4% |
SEC Filings
Expand for More| Report Date | Filing Date | Filing |
|---|---|---|
| 06/30/2026 | 08/11/2026 | 10-Q |
| 03/31/2026 | 05/12/2026 | 10-Q |
| 12/31/2025 | 02/23/2026 | 10-K |
| 09/30/2025 | 11/04/2025 | 10-Q |
| 06/30/2025 | 08/04/2025 | 10-Q |
| 03/31/2025 | 05/06/2025 | 10-Q |
| 12/31/2024 | 02/25/2025 | 10-K |
| 09/30/2024 | 11/01/2024 | 10-Q |
| 06/30/2024 | 07/31/2024 | 10-Q |
| 03/31/2024 | 05/07/2024 | 10-Q |
| 12/31/2023 | 02/27/2024 | 10-K |
| 09/30/2023 | 11/07/2023 | 10-Q |
| 06/30/2023 | 08/02/2023 | 10-Q |
| 03/31/2023 | 05/09/2023 | 10-Q |
| 12/31/2022 | 02/27/2023 | 10-K |
| 09/30/2022 | 11/03/2022 | 10-Q |
| Report Date | Filing Date | Filing |
|---|---|---|
| 06/30/2026 | 08/11/2026 | 10-Q |
| 03/31/2026 | 05/12/2026 | 10-Q |
| 12/31/2025 | 02/23/2026 | 10-K |
| 09/30/2025 | 11/04/2025 | 10-Q |
| 06/30/2025 | 08/04/2025 | 10-Q |
| 03/31/2025 | 05/06/2025 | 10-Q |
| 12/31/2024 | 02/25/2025 | 10-K |
| 09/30/2024 | 11/01/2024 | 10-Q |
| 06/30/2024 | 07/31/2024 | 10-Q |
| 03/31/2024 | 05/07/2024 | 10-Q |
| 12/31/2023 | 02/27/2024 | 10-K |
| 09/30/2023 | 11/07/2023 | 10-Q |
| 06/30/2023 | 08/02/2023 | 10-Q |
| 03/31/2023 | 05/09/2023 | 10-Q |
| 12/31/2022 | 02/27/2023 | 10-K |
| 09/30/2022 | 11/03/2022 | 10-Q |
| 06/30/2022 | 08/04/2022 | 10-Q |
| 03/31/2022 | 05/05/2022 | 10-Q |
| 12/31/2021 | 02/24/2022 | 10-K |
| 09/30/2021 | 11/04/2021 | 10-Q |
| 06/30/2021 | 08/05/2021 | 10-Q |
| 03/31/2021 | 05/06/2021 | 10-Q |
| 12/31/2020 | 02/24/2021 | 10-K |
| 09/30/2020 | 10/28/2020 | 10-Q |
| 06/30/2020 | 07/29/2020 | 10-Q |
| 03/31/2020 | 04/29/2020 | 10-Q |
| 12/31/2019 | 02/25/2020 | 10-K |
| 09/30/2019 | 10/30/2019 | 10-Q |
Recent Forward Guidance
Updated 8/5/2026Latest: Q2 2026 Earnings Reported 8/4/2026
| Forward Guidance | Guidance Change | |||||||
|---|---|---|---|---|---|---|---|---|
| Metric | Source | Low | Mid | High | % Chg | % Delta | Change | Prior |
| Q3 2026 Organic Constant Currency Revenue Growth | Reported | 8.0% | 9.0% | 10.0% | 2.0% | Higher New | Actual: 7.0% for Q2 2026 | |
| Q3 2026 Organic Reported Revenue | Reported | 850.00 Mil | 858.50 Mil | 867.00 Mil | 4.5% | Higher New | Actual: 821.50 Mil for Q2 2026 | |
| Q3 2026 Acquired Business Reported Revenue | Reported | 895.00 Mil | 11.6% | Higher New | Actual: 802.00 Mil for Q2 2026 | |||
| Q3 2026 Total Reported Revenue | Reported | 1.75 Bil | 1.75 Bil | 1.76 Bil | 8.0% | Higher New | Actual: 1.62 Bil for Q2 2026 | |
| Q3 2026 Adjusted EPS | Reported | 3.95 | 4 | 4.05 | 33.3% | Higher New | Actual: 3 for Q2 2026 | |
| 2026 Organic Constant Currency Revenue Growth | Reported | 7.0% | 8.0% | 9.0% | 0.8% | Raised | Guidance: 7.25% for 2026 | |
| 2026 Acquired Business Reported Revenue | Reported | 3.04 Bil | 0.3% | Raised | Guidance: 3.04 Bil for 2026 | |||
| 2026 Adjusted EPS | Reported | 14.45 | 14.55 | 14.65 | 0.3% | Raised | Guidance: 14.5 for 2026 | |
Prior: Q1 2026 Earnings Reported 5/5/2026
| Forward Guidance | Guidance Change | |||||||
|---|---|---|---|---|---|---|---|---|
| Metric | Source | Low | Mid | High | % Chg | % Delta | Change | Prior |
| Q2 2026 Organic Constant Currency Revenue Growth | Reported | 6.0% | 7.0% | 8.0% | ||||
| Q2 2026 Organic Reported Revenue | Reported | 814.00 Mil | 821.50 Mil | 829.00 Mil | ||||
| Q2 2026 Acquired Business Reported Revenue | Reported | 802.00 Mil | ||||||
| Q2 2026 Total Reported Revenue | Reported | 1.62 Bil | 1.62 Bil | 1.63 Bil | ||||
| Q2 2026 Adjusted EPS | Reported | 2.95 | 3 | 3.05 | ||||
| 2026 Organic Constant Currency Revenue Growth | Reported | 6.5% | 7.25% | 8.0% | 16.0% | 1.0% | Raised | Guidance: 6.25% for 2026 |
| 2026 Organic Reported Revenue | Reported | 3.37 Bil | 3.40 Bil | 3.42 Bil | ||||
| 2026 Acquired Business Reported Revenue | Reported | 3.04 Bil | ||||||
| 2026 Total Reported Revenue | Reported | 6.41 Bil | 6.43 Bil | 6.46 Bil | 0.0% | Affirmed | Guidance: 6.43 Bil for 2026 | |
| 2026 Adjusted EPS | Reported | 14.4 | 14.5 | 14.6 | 0.7% | Raised | Guidance: 14.4 for 2026 | |
Q4 2025 Earnings Reported 2/9/2026
| Forward Guidance | Guidance Change | |||||||
|---|---|---|---|---|---|---|---|---|
| Metric | Source | Low | Mid | High | % Chg | % Delta | Change | Prior |
| Q1 2026 Revenue | Reported | 1.20 Bil | 1.20 Bil | 1.21 Bil | ||||
| Q1 2026 Organic Constant Currency Revenue Growth | Reported | 7.0% | 8.0% | 9.0% | 2.0% | Higher New | Actual: 6.0% for Q4 2025 | |
| Q1 2026 Non-GAAP EPS | Reported | 2.25 | 2.3 | 2.35 | -48.9% | Lower New | Actual: 4.5 for Q4 2025 | |
| 2026 Revenue | Reported | 6.41 Bil | 6.43 Bil | 6.46 Bil | ||||
| 2026 Organic Constant Currency Revenue Growth | Reported | 5.5% | 6.25% | 7.0% | -0.8% | Lower New | Actual: 7.0% for 2025 | |
| 2026 Non-GAAP EPS | Reported | 14.3 | 14.4 | 14.5 | 9.9% | Higher New | Actual: 13.1 for 2025 | |
Q3 2025 Earnings Reported 11/4/2025
| Forward Guidance | Guidance Change | |||||||
|---|---|---|---|---|---|---|---|---|
| Metric | Source | Low | Mid | High | % Chg | % Delta | Change | Prior |
| Q4 2025 Constant Currency Sales Growth | Reported | 5.0% | 6.0% | 7.0% | 0.0% | Same New | Actual: 6.0% for Q3 2025 | |
| Q4 2025 Reported Sales Growth | Reported | 5.2% | 6.2% | 7.2% | 0.7% | Higher New | Actual: 5.5% for Q3 2025 | |
| Q4 2025 Non-GAAP EPS | Reported | 4.45 | 4.5 | 4.55 | 40.6% | Higher New | Actual: 3.2 for Q3 2025 | |
| 2025 Constant Currency Sales Growth | Reported | 6.7% | 7.0% | 7.3% | 0.5% | Raised | Guidance: 6.5% for 2025 | |
| 2025 Reported Sales Growth | Reported | 6.5% | 6.8% | 7.1% | 0.8% | Raised | Guidance: 6.0% for 2025 | |
| 2025 Non-GAAP EPS | Reported | 13.05 | 13.1 | 13.15 | 0.8% | Raised | Guidance: 13 for 2025 | |
Investor Activity (13F)
Updated Oct 5, 2026Active managers (13F portfolio over $250M, at least 3 holdings) with a position over $5M that is either over 10% of their portfolio or held in a concentrated book of 50 or fewer total positions. Index/ETF, sovereign, bank, community-bank and charitable/donor-advised filers are excluded.
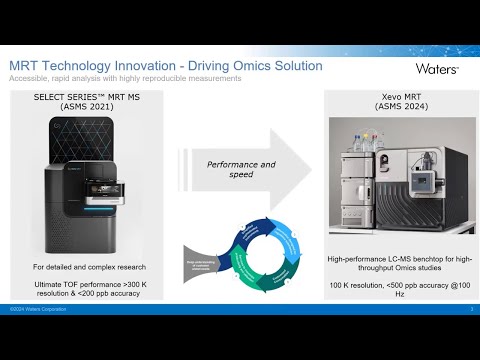
Waters — Investor Video Playlist





Industry Resources
| Health Care Resources |
| U.S. National Library of Medicine |
| ClinicalTrials.gov |
| Modern Healthcare |
| Healthcare Dive |
| Fierce Healthcare |
| Health Affairs |
| Health Data Management |
| FDA Tracker |
| Life Sciences Tools & Services Resources |
| GenomeWeb |
| BioSpace |
| The Scientist |
External Quote Links
| Y Finance | Barrons |
| TradingView | Morningstar |
| SeekingAlpha | ValueLine |
| Motley Fool | Robinhood |
| CNBC | Etrade |
| MarketWatch | Unusual Whales |
| YCharts | Perplexity Finance |
| FinViz |
Prefer one of these to Trefis? Tell us why.