
RadNet (RDNT)
Market Price (9/22/2026): $74.28 | Market Cap: $5.8 BilSector: Health Care | Industry: Health Care Services
RadNet (RDNT)
Market Price (9/22/2026): $74.28Market Cap: $5.8 BilSector: Health CareIndustry: Health Care Services
Investment Highlights Why It Matters Detailed financial logic regarding cash flow yields vs trend-riding momentum.
Attractive cash flow generationCFO/Rev LTMCash Flow from Operations / Revenue (Sales), Last Twelve Months (LTM) is 14% Low stock price volatilityVol 12M is 42% Megatrend and thematic driversMegatrends include Digital Health & Telemedicine, and Precision Medicine. Themes include Health Data Analytics, AI in Healthcare Management, Show more. | Weak multi-year price returns2Y Excs Rtn is -28% Meaningful short interestShort Interest % of Basic SharesShort Interest % of Basic Shares = (Short Interest Quantity) / (Basic Shares Outstanding). A high fraction of short interest can indicate potential risk of a short squeeze. is 13% | Expensive valuation multiplesP/EBITPrice/EBIT or Price/(Operating Income) ratio is 53x Yield minus risk free rate is negativeERPEquity Risk Premium (ERP) = Total Yield - Risk Free Rate, Reflects the premium above risk free assets offered by the investment. is -4.5% Significant short interestShort Interest Days-to-CoverDTC = (Short Interest Share Quantity) / (Average Daily Trading Volume). Reflects how many days it would take to cover (close out) the short interest based on average volumes. High DTC can signify an increased risk of a short squeeze. is 19.47 Key risksRDNT key risks include [1] allegations from a short report challenging the legitimacy of its AI business, Show more. |
| Attractive cash flow generationCFO/Rev LTMCash Flow from Operations / Revenue (Sales), Last Twelve Months (LTM) is 14% |
| Low stock price volatilityVol 12M is 42% |
| Megatrend and thematic driversMegatrends include Digital Health & Telemedicine, and Precision Medicine. Themes include Health Data Analytics, AI in Healthcare Management, Show more. |
| Weak multi-year price returns2Y Excs Rtn is -28% |
| Meaningful short interestShort Interest % of Basic SharesShort Interest % of Basic Shares = (Short Interest Quantity) / (Basic Shares Outstanding). A high fraction of short interest can indicate potential risk of a short squeeze. is 13% |
| Expensive valuation multiplesP/EBITPrice/EBIT or Price/(Operating Income) ratio is 53x |
| Yield minus risk free rate is negativeERPEquity Risk Premium (ERP) = Total Yield - Risk Free Rate, Reflects the premium above risk free assets offered by the investment. is -4.5% |
| Significant short interestShort Interest Days-to-CoverDTC = (Short Interest Share Quantity) / (Average Daily Trading Volume). Reflects how many days it would take to cover (close out) the short interest based on average volumes. High DTC can signify an increased risk of a short squeeze. is 19.47 |
| Key risksRDNT key risks include [1] allegations from a short report challenging the legitimacy of its AI business, Show more. |
Qualitative Assessment
AI Analysis | Feedback
RadNet (RDNT) stock has gained about 30% since 5/31/2026 because of the following key factors:
1. Strong Fiscal Q2 2026 Earnings Beat and Upward Revision of Full-Year Guidance.
RadNet reported robust results for its fiscal Q2 2026 (ended June 30, 2026), surpassing analyst expectations and demonstrating significant growth. The company announced Q2 2026 revenue of $622.7 million, representing a 25.0% increase year-over-year from Q2 2025, and exceeding the consensus estimate of $610.87 million. Additionally, adjusted diluted earnings per share reached $0.29, topping the consensus estimate of $0.20 by $0.09, a 40.16% surprise. This strong performance also included a record Adjusted EBITDA of $99.7 million, up 22.7% compared to the prior year. Following these positive results, RadNet raised its full-year 2026 guidance for Imaging Center revenue, Adjusted EBITDA, and free cash flow.
2. Significant Growth in Advanced Imaging Volumes and Expanding Digital Health Segment.
The company experienced substantial growth in its core imaging business, particularly in higher-value advanced diagnostic procedures. Aggregate advanced imaging volumes, including MRI, CT, and PET/CT procedures, increased by 21.2% year-over-year in fiscal Q2 2026. This growth was driven by increased commercial insurance and Medicare volumes, as well as expanded imaging operations. Furthermore, RadNet's Digital Health segment demonstrated considerable momentum, with revenue (inclusive of intersegment revenue) rising 56.5% year-over-year to $32.4 million in fiscal Q2 2026. The Annual Recurring Revenue (ARR) for Digital Health nearly doubled, reaching $105.5 million as of June 30, 2026, compared to $53.5 million a year prior.
Show more
RadNet (RDNT) stock has gained about 30% since 5/31/2026 because of the following key factors:
1. Strong Fiscal Q2 2026 Earnings Beat and Upward Revision of Full-Year Guidance.
RadNet reported robust results for its fiscal Q2 2026 (ended June 30, 2026), surpassing analyst expectations and demonstrating significant growth. The company announced Q2 2026 revenue of $622.7 million, representing a 25.0% increase year-over-year from Q2 2025, and exceeding the consensus estimate of $610.87 million. Additionally, adjusted diluted earnings per share reached $0.29, topping the consensus estimate of $0.20 by $0.09, a 40.16% surprise. This strong performance also included a record Adjusted EBITDA of $99.7 million, up 22.7% compared to the prior year. Following these positive results, RadNet raised its full-year 2026 guidance for Imaging Center revenue, Adjusted EBITDA, and free cash flow.
2. Significant Growth in Advanced Imaging Volumes and Expanding Digital Health Segment.
The company experienced substantial growth in its core imaging business, particularly in higher-value advanced diagnostic procedures. Aggregate advanced imaging volumes, including MRI, CT, and PET/CT procedures, increased by 21.2% year-over-year in fiscal Q2 2026. This growth was driven by increased commercial insurance and Medicare volumes, as well as expanded imaging operations. Furthermore, RadNet's Digital Health segment demonstrated considerable momentum, with revenue (inclusive of intersegment revenue) rising 56.5% year-over-year to $32.4 million in fiscal Q2 2026. The Annual Recurring Revenue (ARR) for Digital Health nearly doubled, reaching $105.5 million as of June 30, 2026, compared to $53.5 million a year prior.
3. Positive Analyst Sentiment and Upgraded Price Targets.
Following the strong financial results, multiple Wall Street analysts reiterated "Buy" or "Strong Buy" ratings and raised their price targets for RadNet's stock. Truist Financial increased its price objective from $90.00 to $94.00 on August 11, 2026. Barclays also lifted its target price from $65.00 to $79.00 on August 28, 2026. Raymond James reiterated a "Strong Buy" rating and a $95.00 price target on September 22, 2026. The consensus price target among analysts is $90.00, suggesting a potential upside of 23.85% from the stock's closing price of $72.67 on September 21, 2026.
4. Strategic Investments and Enhanced Financial Flexibility.
RadNet pursued strategic initiatives that bolstered its financial position and future growth prospects. In June 2026, the company secured a $250 million incremental term loan designated to fund strategic growth opportunities. Concurrently, RadNet successfully reduced the interest rates on its credit facility by 0.25%, which could lead to lower borrowing costs. These actions, coupled with a healthy Net Debt to Adjusted EBITDA ratio of 1.8x as of June 30, 2026, indicate a solid financial foundation and strategic capital management.
Show less
Stock Movement Drivers
Fundamental Drivers
The 30.9% change in RDNT stock from 5/31/2026 to 9/21/2026 was primarily driven by a 24.9% change in the company's P/S Multiple.| (LTM values as of) | 5312026 | 9212026 | Change |
|---|---|---|---|
| Stock Price ($) | 55.53 | 72.67 | 30.9% |
| Change Contribution By: | |||
| Total Revenues ($ Mil) | 2,144 | 2,269 | 5.8% |
| P/S Multiple | 2.0 | 2.5 | 24.9% |
| Shares Outstanding (Mil) | 77 | 78 | -0.9% |
| Cumulative Contribution | 30.9% |
Market Drivers
5/31/2026 to 9/21/2026| Return | Correlation | |
|---|---|---|
| RDNT | 30.9% | |
| Market (SPY) | 2.5% | 6.9% |
| Sector (XLV) | 13.6% | 30.5% |
Fundamental Drivers
The 4.1% change in RDNT stock from 2/28/2026 to 9/21/2026 was primarily driven by a 15.2% change in the company's Total Revenues ($ Mil).| (LTM values as of) | 2282026 | 9212026 | Change |
|---|---|---|---|
| Stock Price ($) | 69.81 | 72.67 | 4.1% |
| Change Contribution By: | |||
| Total Revenues ($ Mil) | 1,970 | 2,269 | 15.2% |
| P/S Multiple | 2.7 | 2.5 | -7.4% |
| Shares Outstanding (Mil) | 76 | 78 | -2.4% |
| Cumulative Contribution | 4.1% |
Market Drivers
2/28/2026 to 9/21/2026| Return | Correlation | |
|---|---|---|
| RDNT | 4.1% | |
| Market (SPY) | 13.4% | 24.6% |
| Sector (XLV) | 6.4% | 37.4% |
Fundamental Drivers
The 1.3% change in RDNT stock from 8/31/2025 to 9/21/2026 was primarily driven by a 18.9% change in the company's Total Revenues ($ Mil).| (LTM values as of) | 8312025 | 9212026 | Change |
|---|---|---|---|
| Stock Price ($) | 71.76 | 72.67 | 1.3% |
| Change Contribution By: | |||
| Total Revenues ($ Mil) | 1,908 | 2,269 | 18.9% |
| P/S Multiple | 2.8 | 2.5 | -10.9% |
| Shares Outstanding (Mil) | 74 | 78 | -4.4% |
| Cumulative Contribution | 1.3% |
Market Drivers
8/31/2025 to 9/21/2026| Return | Correlation | |
|---|---|---|
| RDNT | 1.3% | |
| Market (SPY) | 21.2% | 31.8% |
| Sector (XLV) | 25.1% | 31.8% |
Fundamental Drivers
The 117.5% change in RDNT stock from 8/31/2023 to 9/21/2026 was primarily driven by a 90.3% change in the company's P/S Multiple.| (LTM values as of) | 8312023 | 9212026 | Change |
|---|---|---|---|
| Stock Price ($) | 33.41 | 72.67 | 117.5% |
| Change Contribution By: | |||
| Total Revenues ($ Mil) | 1,528 | 2,269 | 48.5% |
| P/S Multiple | 1.3 | 2.5 | 90.3% |
| Shares Outstanding (Mil) | 60 | 78 | -23.0% |
| Cumulative Contribution | 117.5% |
Market Drivers
8/31/2023 to 9/21/2026| Return | Correlation | |
|---|---|---|
| RDNT | 117.5% | |
| Market (SPY) | 78.3% | 42.0% |
| Sector (XLV) | 33.4% | 31.3% |
Price Returns Compared
| 2021 | 2022 | 2023 | 2024 | 2025 | 2026 | Total [1] | |
|---|---|---|---|---|---|---|---|
| Returns | |||||||
| RDNT Return | 54% | -37% | 85% | 101% | 2% | 7% | 288% |
| Peers Return | 30% | 3% | -8% | 0% | 20% | 20% | 76% |
| S&P 500 Return | 27% | -19% | 24% | 23% | 16% | 12% | 104% |
Monthly Win Rates [3] | |||||||
| RDNT Win Rate | 67% | 33% | 83% | 75% | 42% | 56% | |
| Peers Win Rate | 60% | 52% | 40% | 52% | 62% | 60% | |
| S&P 500 Win Rate | 75% | 42% | 67% | 75% | 67% | 44% | |
Max Drawdowns [4] | |||||||
| RDNT Max Drawdown | -31% | -50% | -27% | -19% | -37% | -34% | |
| Peers Max Drawdown | -21% | -24% | -26% | -22% | -21% | -16% | |
| S&P 500 Max Drawdown | -5% | -25% | -10% | -8% | -19% | -9% | |
[1] Cumulative total returns since the beginning of 2021
[2] Peers: ADUS, CVS, CI, LH, DGX.
[3] Win Rate = % of calendar months in which monthly returns were positive
[4] Max drawdown represents maximum peak-to-trough decline within a year
[5] 2026 data is for the year up to 9/21/2026 (YTD)
How Low Can It Go
| Event | RDNT | S&P 500 |
|---|---|---|
| 2025 US Tariff Shock | ||
| % Loss | -28.6% | -18.8% |
| % Gain to Breakeven | 40.0% | 23.1% |
| Time to Breakeven | 153 days | 79 days |
| Summer-Fall 2023 Five Percent Yield Shock | ||
| % Loss | -24.7% | -9.5% |
| % Gain to Breakeven | 32.9% | 10.5% |
| Time to Breakeven | 35 days | 24 days |
| 2022 Inflation Shock & Fed Tightening | ||
| % Loss | -43.7% | -24.5% |
| % Gain to Breakeven | 77.5% | 32.4% |
| Time to Breakeven | 351 days | 427 days |
| 2020 COVID-19 Crash | ||
| % Loss | -73.2% | -33.7% |
| % Gain to Breakeven | 272.8% | 50.9% |
| Time to Breakeven | 356 days | 140 days |
| Q4 2018 Fed Policy Error / Growth Scare | ||
| % Loss | -31.4% | -19.2% |
| % Gain to Breakeven | 45.8% | 23.8% |
| Time to Breakeven | 70 days | 105 days |
| 2016-2017 Trump Reflation Bond Selloff | ||
| % Loss | -25.5% | -3.7% |
| % Gain to Breakeven | 34.2% | 3.9% |
| Time to Breakeven | 68 days | 6 days |
In The Past
RadNet's stock fell -28.6% during the 2025 US Tariff Shock. Such a loss loss requires a 40.0% gain to breakeven.
Preserve Wealth
Limiting losses and compounding gains is essential to preserving wealth.
Asset Allocation
Actively managed asset allocation strategies protect wealth. Learn more.
| Event | RDNT | S&P 500 |
|---|---|---|
| 2025 US Tariff Shock | ||
| % Loss | -28.6% | -18.8% |
| % Gain to Breakeven | 40.0% | 23.1% |
| Time to Breakeven | 153 days | 79 days |
| Summer-Fall 2023 Five Percent Yield Shock | ||
| % Loss | -24.7% | -9.5% |
| % Gain to Breakeven | 32.9% | 10.5% |
| Time to Breakeven | 35 days | 24 days |
| 2022 Inflation Shock & Fed Tightening | ||
| % Loss | -43.7% | -24.5% |
| % Gain to Breakeven | 77.5% | 32.4% |
| Time to Breakeven | 351 days | 427 days |
| 2020 COVID-19 Crash | ||
| % Loss | -73.2% | -33.7% |
| % Gain to Breakeven | 272.8% | 50.9% |
| Time to Breakeven | 356 days | 140 days |
| Q4 2018 Fed Policy Error / Growth Scare | ||
| % Loss | -31.4% | -19.2% |
| % Gain to Breakeven | 45.8% | 23.8% |
| Time to Breakeven | 70 days | 105 days |
| 2016-2017 Trump Reflation Bond Selloff | ||
| % Loss | -25.5% | -3.7% |
| % Gain to Breakeven | 34.2% | 3.9% |
| Time to Breakeven | 68 days | 6 days |
| 2015-2016 China Devaluation / Global Growth Scare | ||
| % Loss | -34.0% | -12.2% |
| % Gain to Breakeven | 51.4% | 13.9% |
| Time to Breakeven | 238 days | 62 days |
| 2014-2016 Oil Price Collapse | ||
| % Loss | -25.4% | -6.8% |
| % Gain to Breakeven | 34.1% | 7.3% |
| Time to Breakeven | 204 days | 15 days |
| 2013 Taper Tantrum | ||
| % Loss | -46.2% | -0.2% |
| % Gain to Breakeven | 86.0% | 0.2% |
| Time to Breakeven | 53 days | 1 days |
| 2011 US Debt Ceiling Crisis & European Contagion | ||
| % Loss | -43.3% | -17.9% |
| % Gain to Breakeven | 76.3% | 21.8% |
| Time to Breakeven | 915 days | 123 days |
| 2010 Eurozone Sovereign Debt Crisis / Flash Crash | ||
| % Loss | -51.5% | -15.4% |
| % Gain to Breakeven | 106.1% | 18.2% |
| Time to Breakeven | 291 days | 125 days |
| 2008-2009 Global Financial Crisis | ||
| % Loss | -90.8% | -53.4% |
| % Gain to Breakeven | 983.9% | 114.4% |
| Time to Breakeven | 3093 days | 1085 days |
In The Past
RadNet's stock fell -28.6% during the 2025 US Tariff Shock. Such a loss loss requires a 40.0% gain to breakeven.
Preserve Wealth
Limiting losses and compounding gains is essential to preserving wealth.
Asset Allocation
Actively managed asset allocation strategies protect wealth. Learn more.
About RadNet (RDNT)
RadNet, Inc. (RDNT) is a prominent provider of outpatient diagnostic imaging services across the United States. The company operates a significant network of imaging centers in multiple states, including Arizona, California, Florida, and New York. Through these centers, RadNet offers a comprehensive array of advanced imaging modalities, such as Magnetic Resonance Imaging (MRI), Computed Tomography (CT), Positron Emission Tomography (PET), mammography, and ultrasound, primarily serving patients referred by healthcare professionals.
In addition to its direct patient care services, RadNet also develops and sells specialized technology tailored for the diagnostic imaging industry. This includes computerized systems like Picture Archiving Communications Systems (PACS) for managing and storing medical images. Furthermore, the company is at the forefront of developing and deploying artificial intelligence (AI) suites designed to enhance radiologist interpretation, particularly in critical areas such as mammography and the detection of lung and prostate cancers, aiming to improve diagnostic accuracy and efficiency within the healthcare sector.
AI Analysis | Feedback
Here are 1-3 brief analogies to describe RadNet:
Quest Diagnostics or LabCorp for medical imaging scans (MRI, CT, mammography).
The Tesla of diagnostic imaging, owning clinics and developing AI to interpret scans.
AI Analysis | Feedback
- Magnetic Resonance Imaging (MRI): A non-invasive medical imaging service that uses strong magnetic fields and radio waves to create detailed images of organs and tissues within the body.
- Computed Tomography (CT): A diagnostic imaging service utilizing X-rays and computer processing to produce cross-sectional images of the body, aiding in the diagnosis of various conditions.
- Positron Emission Tomography (PET) and Nuclear Medicine: Specialized imaging services that use radioactive tracers to visualize and measure metabolic activity, blood flow, and other physiological functions in the body.
- Mammography: A specific X-ray imaging service of the breast used to detect and diagnose breast diseases, including cancer.
- Ultrasound: A medical imaging service that uses high-frequency sound waves to create real-time images of internal body structures without using radiation.
- Diagnostic Radiology and Fluoroscopy: Services employing various forms of X-ray technology to visualize internal body structures and processes, helping to diagnose and guide treatment for medical conditions.
- Picture Archiving Communications Systems (PACS): Computerized systems developed and sold to store, retrieve, manage, distribute, and present medical images and data for diagnostic imaging centers.
- AI Suites and Solutions for Medical Imaging: Artificial intelligence software developed and deployed to enhance radiologist interpretation of medical images, with applications in mammography, lung, and prostate cancer detection.
AI Analysis | Feedback
RadNet, Inc. (RDNT) primarily provides outpatient diagnostic imaging services directly to individuals. While insurance companies cover a significant portion of the costs, the direct customers receiving the services are patients. Based on its business model of operating and managing imaging centers, RadNet serves the following major categories of customers:
- Patients with Physician Referrals: These are individuals who require diagnostic imaging services, such as MRI, CT, or X-rays, as recommended or prescribed by their referring physicians (primary care doctors, specialists, etc.) for the diagnosis, monitoring, or treatment of medical conditions.
- Patients for Preventative Screenings: This category includes individuals who utilize RadNet's services for routine or preventative screenings, such as mammography, often as part of general health maintenance or early disease detection.
- Patients involved in Workers' Compensation or Personal Injury Cases: These are individuals whose diagnostic imaging needs arise from work-related injuries or accidents, with the services typically billed to workers' compensation carriers or other third-party liability insurers.
AI Analysis | Feedback
- Siemens Healthineers AG (XTRA: SHL, OTC: SMMNY)
- GE HealthCare Technologies Inc. (NASDAQ: GEHC)
- Koninklijke Philips N.V. (Euronext Amsterdam: PHIA, NYSE: PHG)
AI Analysis | Feedback
Howard G. Berger, M.D. President and Chief Executive Officer
Dr. Berger co-founded RadNet in 1980 and has served as its President and Chief Executive Officer since 1987. He also previously served as the Chief Financial Officer of RadNet, Inc. since 1987. He possesses over 25 years of experience in the development and management of successful healthcare businesses. Dr. Berger is Board Certified in Nuclear Medicine and received his Medical Degree from the University of Illinois Medical School.
Mark D. Stolper Executive Vice President and Chief Financial Officer
Mr. Stolper has held the position of Executive Vice President and Chief Financial Officer of RadNet since 2004. Before this role, he was an independent member of the company's Board of Directors. He is responsible for all financial functions and disciplines within the company.
Stephen M. Forthuber President and Chief Executive Officer, Eastern Operations
Effective January 7, 2026, Mr. Forthuber was promoted to President and Chief Executive Officer, Eastern Operations. Prior to this, he served as President and Chief Operating Officer for Eastern Operations since May 2017 and Chief Operating Officer of Eastern Operations since November 2006. He has 23 years of experience in the healthcare field, with 18 of those years dedicated exclusively to radiology practice management. Mr. Forthuber previously served in multiple roles at MMS, a private company providing outsourced Reimbursement Operations and Practice Management, eventually becoming its President and Chief Operating Officer for Eastern Operations.
Norman R. Hames President and Chief Executive Officer, Western Operations
Effective January 7, 2026, Mr. Hames was promoted to President and Chief Executive Officer, Western Operations. He previously served as President and Chief Operating Officer for Western Operations. With 20 years of industry experience, Mr. Hames oversees all aspects of facility operations for RadNet's Western Operations. Before joining RadNet, he was President and CEO of his own company, Diagnostic Imaging Services, Inc. (DIS), which owned and operated 14 multi-modality imaging centers across Southern California. His initial experience in operating imaging centers was gained at American Medical International (AMI).
Mital Patel Executive Vice President and Chief Operating Officer
Effective January 7, 2026, Ms. Patel was promoted to Executive Vice President and Chief Operating Officer. Prior to this promotion, she held the role of Executive Vice President of Financial Planning and Analysis and Chief Administrative Officer.
AI Analysis | Feedback
Key Risks to RadNet (RDNT)
- Healthcare Reimbursement and Regulatory Pressures: RadNet, as a major provider of outpatient diagnostic imaging services, is highly susceptible to changes in healthcare reimbursement policies, particularly from government programs like Medicare and private insurers. Recent and ongoing reductions in the Medicare Physician Fee Schedule (MPFS) conversion factor have a direct impact on payment rates for many diagnostic imaging procedures, creating persistent revenue risk. The diagnostic imaging industry has faced significant reimbursement rate cuts for over a decade, with some high-volume procedures experiencing substantial reductions. Furthermore, the company is subject to regulatory scrutiny and the complex compliance requirements of the healthcare sector.
- Technological Disruption, AI-Related Risks, and Competition: RadNet both provides diagnostic imaging services and develops and deploys AI suites and computerized systems (PACS). This dual involvement exposes the company to rapid technological advancements and intense competition. While AI offers benefits, it also carries inherent risks, including the potential for diagnostic mistakes due to algorithm errors, biases in training data, lack of transparency in AI decision-making, and ethical and liability concerns. Failure to keep pace with evolving imaging technologies or AI development, or intense competition from other technology providers and imaging centers adopting superior solutions, could impact RadNet's market position and require significant ongoing investment.
- Increasing Operating Costs and Labor Shortages: The company faces significant challenges from rising operating costs, primarily driven by inflation in labor, equipment, and supplies. Wage increases for highly skilled radiology staff and other professional service providers can outpace revenue growth, directly pressuring the company's profit margins. The diagnostic imaging industry also contends with widespread staffing shortages and radiologist burnout, which can lead to operational inefficiencies, delayed patient care, and increased costs for recruitment and retention.
AI Analysis | Feedback
AI Analysis | Feedback
RadNet (RDNT) operates in several key addressable markets within the United States, including outpatient diagnostic imaging services, computerized systems for diagnostic imaging (PACS), and AI suites for radiologist interpretation in mammography, lung, and prostate cancer.
The addressable markets for RadNet's main products and services in the U.S. are as follows:
Outpatient Diagnostic Imaging Services
- The U.S. imaging services market was estimated at approximately USD 104.25 billion in 2025 and is projected to reach about USD 121.32 billion by 2033, demonstrating a compound annual growth rate (CAGR) of 1.9% from 2026 to 2033. Other estimates place the U.S. imaging services market at USD 150.14 billion in 2025, with projections to reach around USD 276.31 billion by 2034 at a CAGR of 7.04% from 2025 to 2034.
- Specifically, the market size for Diagnostic Imaging Centers in the U.S., where RadNet operates a significant number of its centers, was approximately USD 26.3 billion in 2025 and is estimated to be USD 27.2 billion in 2026. RadNet itself is a major player, operating around 398 diagnostic imaging centers across the U.S.
Computerized Systems for the Diagnostic Imaging Industry (Picture Archiving Communications Systems - PACS)
- The U.S. Picture Archiving & Communication System (PACS) market was valued at approximately USD 981.08 million in 2023 and is expected to reach USD 1.27 billion by 2029, growing at a CAGR of 4.50%. Another report estimated the U.S. PACS System market size at USD 1080.99 million in 2024.
AI Suites to Enhance Radiologist Interpretation of Images (Mammography, Lung, and Prostate Cancer)
- The broader U.S. AI in oncology market was estimated at approximately USD 890.5 million in 2023 and is projected to reach USD 10,745.55 million by 2033, with a CAGR of 28.26% from 2024 to 2033.
- AI in Mammography (Breast Imaging): The U.S. Artificial Intelligence in Breast Imaging Market was valued at approximately USD 492.14 million in 2024. The global AI in cancer diagnostics market attributed approximately USD 0.50 billion to breast cancer in 2024, representing about 31% of that market.
- AI in Lung Cancer Diagnosis: Within the global AI in cancer diagnostics market, lung cancer accounted for approximately USD 0.42 billion in 2024, representing about 26% of the market.
- AI in Prostate Cancer Diagnosis: Prostate cancer's share in the global AI in cancer diagnostics market was valued at approximately USD 0.27 billion in 2024, making up roughly 17% of the market.
AI Analysis | Feedback
- Expansion of Imaging Center Network: RadNet is actively growing its footprint through both the development of new, "de novo" imaging centers and strategic acquisitions of existing facilities. In 2024, the company built nine new centers and had 13 projects in the pipeline for 2025. RadNet expanded into the Texas market in 2024 and entered the Midwest with the acquisition of six outpatient imaging centers from Northwest Radiology in Indianapolis in early 2026, which is expected to add $18 million in annual revenue. Additionally, the acquisition of Radiology Regional in Southwest Florida in January 2026 is projected to add approximately $100 million in revenue in 2026. This aggressive expansion strategy aims to increase capacity and meet rising demand in both existing and new markets.
- Growth in Advanced Imaging Modalities: The company anticipates continued strong performance and volume growth in higher-acuity, advanced imaging procedures such as Magnetic Resonance Imaging (MRI), Computed Tomography (CT), and Positron Emission Tomography/Computed Tomography (PET/CT). These modalities have consistently shown double-digit volume increases, contributing significantly to revenue and a favorable shift in the overall business mix. For example, MRI volumes increased 11.7%, CT volumes increased 9.1%, and PET/CT volumes increased 17.5% in the first quarter of 2024 compared to the prior year.
- Development and Commercialization of Digital Health and AI Solutions: RadNet's Digital Health segment, particularly through its DeepHealth platform and the strategic acquisition of AI company Gleamer, is a significant driver of future revenue. The Gleamer acquisition, completed in early 2026, is expected to contribute approximately $30 million in Annual Recurring Revenue (ARR) in 2026. The total ARR for the Digital Health division is projected to approach $140 million by the end of 2026. These AI solutions are designed to enhance radiologist interpretation, automate workflows (especially in high-volume modalities like X-ray), and improve efficiency, addressing rising imaging volumes and radiologist shortages. RadNet also plans to expand sales and licensing of these AI solutions to external customers, reducing reliance on internal use.
- Strategic Joint Venture Partnerships: RadNet is actively pursuing and expanding its joint venture partnerships with health systems. These collaborations are expected to further boost growth by integrating RadNet's operational expertise and imaging technologies within broader healthcare networks, thereby increasing patient access and referral volumes.
AI Analysis | Feedback
Share Repurchases
- RadNet reported $0 in share buybacks as of December 31, 2024.
- A lack of free cash flow has limited the company's ability to execute share buybacks.
Share Issuance
- In June 2023, RadNet closed an underwritten public offering of 8,711,250 shares of its common stock at $29.75 per share, generating approximately $259.2 million in gross proceeds.
- The weighted average number of diluted shares outstanding was 75.2 million in 2025, 74.8 million in 2024, and 59.2 million in 2023.
- As of February 27, 2026, the number of common shares outstanding was 77,612,125.
Outbound Investments
- In 2025, RadNet acquired approximately eight imaging center segment companies for a total of $73.1 million through September, and acquired AI firms for its DeepHealth business including See-Mode Technologies ($29 million), iCAD ($103 million), Kheiron Medical Technologies ($1 million), and Alpha RT ($5 million).
- In 2026, RadNet acquired Paris-based Gleamer for up to €230 million (approximately $250 million), which is expected to add around $30 million in annual recurring revenue.
- Also in 2026, RadNet established its first presence in the Midwest by acquiring Northwest Radiology Network, P.C. in the Indianapolis area, which is expected to add approximately $18 million in annual revenue.
Capital Expenditures
- Capital expenditures were $98.8 million in 2021, including a $26.0 million opportunistic equipment purchase, and $105.7 million in 2022.
- For full-year 2025, capital expenditures amounted to $170.5 million for the Imaging Center segment.
- RadNet's guidance for capital expenditures in 2026 is projected to be between $140 million and $150 million. These investments primarily focus on strengthening core imaging operations and developing proprietary technologies like patient scheduling, image storage, and AI applications to improve quality and efficiency.
Peer Outperformance in Health Care Services
| Industry | Names | 1Y med | 3Y med | 5Y med | Top 3 by 5Y |
|---|---|---|---|---|---|
| Health Care Distributors | 6 | 17.8% | 45.5% | 92.1% | CAH 393% · MCK 348% · COR 173% |
| Managed Health Care | 8 | 41.5% | -4.6% | 2.2% | OSCR 80% · HQY 52% · ELV 17% |
| Health Care Services ← | 20 | 21.2% | 36.3% | -1.7% | HIMS 256% · RDNT 156% · DGX 77% |
| Health Care Facilities | 24 | 6.4% | 8.0% | -5.7% | NHC 273% · THC 256% · ENSG 129% |
| Health Care Equipment | 50 | -0.5% | -1.0% | -21.7% | POCI 11025% · UFPT 345% · GKOS 215% |
| Pharmaceuticals | 62 | -10.5% | 12.0% | -36.3% | LQDA 2281% · INDV 1104% · ETON 1006% |
| Health Care Supplies | 12 | 14.9% | -9.0% | -39.5% | LNTH 282% · HAE 58% · MMSI 19% |
| Life Sciences Tools & Services | 109 | 6.3% | -9.6% | -67.8% | SNWV 1712% · MEDP 227% · NTRA 195% |
| Biotechnology | 367 | 0.0% | -22.7% | -79.2% | CELZ 1336% · DNTH 1214% · ELVN 1055% |
| Health Care Technology | 21 | -25.8% | -50.7% | -79.4% | SPOK 69% · HSTM 2% · VEEV -12% |
Latest Trefis Analyses
Research & Analysis
Invest in Strategies
Wealth Management
Peer Comparisons
| Peers to compare with: |
Financials
| Median | |
|---|---|
| Name | |
| Mkt Price | 180.12 |
| Mkt Cap | 26.7 |
| Rev LTM | 12,954 |
| Op Inc LTM | 1,632 |
| FCF LTM | 1,252 |
| FCF 3Y Avg | 1,120 |
| CFO LTM | 1,771 |
| CFO 3Y Avg | 1,591 |
Growth & Margins
| Median | |
|---|---|
| Name | |
| Rev Chg LTM | 8.8% |
| Rev Chg 3Y Avg | 10.4% |
| Rev Chg Q | 7.6% |
| QoQ Delta Rev Chg LTM | 1.8% |
| Op Inc Chg LTM | 20.6% |
| Op Inc Chg 3Y Avg | 14.8% |
| Op Mgn LTM | 7.0% |
| Op Mgn 3Y Avg | 7.1% |
| QoQ Delta Op Mgn LTM | 0.2% |
| CFO/Rev LTM | 11.2% |
| CFO/Rev 3Y Avg | 10.6% |
| FCF/Rev LTM | 5.6% |
| FCF/Rev 3Y Avg | 5.9% |
Segment Financials
Revenue by Segment| $ Mil | 2025 | 2024 | 2023 | 2022 | 2021 |
|---|---|---|---|---|---|
| Imaging Centers | 1,988 | 1,792 | 1,591 | 1,413 | 1,314 |
| Digital Health | 93 | 66 | 50 | 38 | |
| Elimination of intersegment revenues | -41 | -28 | -24 | -21 | |
| Artificial Intelligence (AI) | 1 | ||||
| Total | 2,040 | 1,830 | 1,617 | 1,430 | 1,315 |
| $ Mil | 2025 | 2024 | 2023 | 2022 | 2021 |
|---|---|---|---|---|---|
| Imaging Centers | 242 | 250 | 120 | 167 | 78 |
| Severance costs | -3 | -2 | -1 | ||
| Loss on sale and disposal of equipment and other | -10 | -2 | -3 | ||
| Digital Health | -15 | -3 | -1 | ||
| Depreciation and amortization | -152 | -138 | -116 | ||
| Artificial Intelligence (AI) | -21 | -4 | |||
| Total | 62 | 105 | 99 | 46 | 73 |
Price Behavior
| Market Price | $72.67 | |
| Market Cap ($ Bil) | 5.7 | |
| First Trading Date | 01/03/1997 | |
| Distance from 52W High | -14.0% | |
| 50 Days | 200 Days | |
| DMA Price | $70.79 | $65.70 |
| DMA Trend | indeterminate | up |
| Distance from DMA | 2.7% | 10.6% |
| 3M | 1YR | |
| Volatility | 42.2% | 42.3% |
| Downside Capture | -9.33 | 130.91 |
| Upside Capture | 122.47 | 100.81 |
| Correlation (SPY) | 15.9% | 32.8% |
| 1M | 2M | 3M | 6M | 1Y | 3Y | |
|---|---|---|---|---|---|---|
| Beta | 2.07 | 0.98 | 0.32 | 0.86 | 1.11 | 1.21 |
| Up Beta | 2.07 | 1.06 | 0.21 | 0.29 | 0.94 | 1.19 |
| Down Beta | 2.80 | -0.23 | 0.04 | 0.95 | 0.96 | 1.05 |
| Up Capture | 306% | 177% | 123% | 103% | 122% | 253% |
| Bmk +ve Days | 10 | 21 | 32 | 68 | 138 | 427 |
| Stock +ve Days | 11 | 21 | 36 | 69 | 129 | 377 |
| Down Capture | 29% | 74% | -33% | 110% | 122% | 106% |
| Bmk -ve Days | 11 | 21 | 32 | 59 | 113 | 324 |
| Stock -ve Days | 10 | 21 | 28 | 58 | 121 | 371 |
[1] Upside and downside betas calculated using positive and negative benchmark daily returns respectively
Based On 1-Year Data
| Annualized Return | Annualized Volatility | Sharpe Ratio | Correlation with RDNT | |
|---|---|---|---|---|
| RDNT | -5.1% | 42.1% | -0.02 | - |
| Sector ETF (XLV) | 25.2% | 16.1% | 1.20 | 31.5% |
| Equity (SPY) | 18.2% | 13.0% | 1.01 | 31.2% |
| Gold (GLD) | 18.8% | 29.3% | 0.59 | 11.0% |
| Commodities (DBC) | 47.0% | 20.6% | 1.76 | -6.9% |
| Real Estate (VNQ) | 5.7% | 13.6% | 0.15 | 30.6% |
| Bitcoin (BTCUSD) | -31.0% | 44.4% | -0.71 | 25.5% |
Smart multi-asset allocation framework can stack odds in your favor. Learn How
Based On 5-Year Data
| Annualized Return | Annualized Volatility | Sharpe Ratio | Correlation with RDNT | |
|---|---|---|---|---|
| RDNT | 20.9% | 43.9% | 0.56 | - |
| Sector ETF (XLV) | 6.7% | 15.2% | 0.26 | 37.6% |
| Equity (SPY) | 13.1% | 17.2% | 0.58 | 47.9% |
| Gold (GLD) | 18.9% | 18.8% | 0.81 | 6.5% |
| Commodities (DBC) | 11.0% | 19.5% | 0.44 | 2.8% |
| Real Estate (VNQ) | 1.2% | 18.8% | -0.04 | 38.4% |
| Bitcoin (BTCUSD) | 12.5% | 52.6% | 0.42 | 30.1% |
Smart multi-asset allocation framework can stack odds in your favor. Learn How
Based On 10-Year Data
| Annualized Return | Annualized Volatility | Sharpe Ratio | Correlation with RDNT | |
|---|---|---|---|---|
| RDNT | 26.8% | 48.4% | 0.67 | - |
| Sector ETF (XLV) | 10.9% | 16.7% | 0.53 | 37.6% |
| Equity (SPY) | 15.6% | 17.9% | 0.74 | 46.1% |
| Gold (GLD) | 12.1% | 16.4% | 0.61 | 3.8% |
| Commodities (DBC) | 8.4% | 18.1% | 0.38 | 14.5% |
| Real Estate (VNQ) | 4.9% | 20.7% | 0.20 | 42.5% |
| Bitcoin (BTCUSD) | 62.7% | 66.2% | 1.03 | 17.0% |
Smart multi-asset allocation framework can stack odds in your favor. Learn How
Returns Analyses
Earnings Returns History
Updated 9/11/2026| Forward Returns | |||
|---|---|---|---|
| Earnings Date | 1D Returns | 5D Returns | 21D Returns |
| 8/10/2026 | 6.8% | 5.5% | -0.6% |
| 5/11/2026 | -3.9% | -10.0% | -3.5% |
| 3/2/2026 | 7.7% | -13.1% | -20.2% |
| 11/10/2025 | 3.2% | -4.0% | -1.5% |
| 8/11/2025 | 16.2% | 26.4% | 37.0% |
| 5/12/2025 | 2.3% | 9.7% | 6.4% |
| 3/5/2025 | -2.8% | -11.0% | -6.7% |
| 11/12/2024 | -1.2% | -4.5% | -6.1% |
| ... | |||
| SUMMARY STATS | |||
| # Positive | 14 | 15 | 11 |
| # Negative | 10 | 9 | 13 |
| Median Positive | 3.4% | 5.0% | 10.8% |
| Median Negative | -1.3% | -5.7% | -3.5% |
| Max Positive | 16.2% | 26.4% | 45.4% |
| Max Negative | -4.6% | -13.1% | -20.2% |
| Forward Returns | |||
|---|---|---|---|
| Earnings Date | 1D Returns | 5D Returns | 21D Returns |
| 8/10/2026 | 6.8% | 5.5% | -0.6% |
| 5/11/2026 | -3.9% | -10.0% | -3.5% |
| 3/2/2026 | 7.7% | -13.1% | -20.2% |
| 11/10/2025 | 3.2% | -4.0% | -1.5% |
| 8/11/2025 | 16.2% | 26.4% | 37.0% |
| 5/12/2025 | 2.3% | 9.7% | 6.4% |
| 3/5/2025 | -2.8% | -11.0% | -6.7% |
| 11/12/2024 | -1.2% | -4.5% | -6.1% |
| 8/9/2024 | -1.9% | 2.5% | -4.0% |
| 5/13/2024 | 1.8% | 5.0% | 10.8% |
| 3/5/2024 | 2.3% | -3.0% | 1.0% |
| 11/13/2023 | -1.3% | 10.0% | 24.6% |
| 8/9/2023 | -0.7% | 1.0% | -3.1% |
| 5/11/2023 | -0.1% | 4.1% | 20.4% |
| 3/1/2023 | 2.1% | 4.8% | 5.0% |
| 11/9/2022 | 6.6% | 9.0% | 31.4% |
| 8/10/2022 | 0.6% | 2.0% | -1.3% |
| 5/10/2022 | -4.6% | 8.1% | 9.5% |
| 3/2/2022 | 0.0% | -10.7% | -2.3% |
| 11/9/2021 | -0.0% | -2.9% | -13.1% |
| 8/10/2021 | -1.0% | -5.7% | -13.7% |
| 5/11/2021 | 5.1% | 2.6% | 45.4% |
| 3/9/2021 | 5.0% | 8.7% | -1.4% |
| 11/10/2020 | 3.5% | 3.5% | 6.8% |
| SUMMARY STATS | |||
| # Positive | 14 | 15 | 11 |
| # Negative | 10 | 9 | 13 |
| Median Positive | 3.4% | 5.0% | 10.8% |
| Median Negative | -1.3% | -5.7% | -3.5% |
| Max Positive | 16.2% | 26.4% | 45.4% |
| Max Negative | -4.6% | -13.1% | -20.2% |
SEC Filings
Expand for More| Report Date | Filing Date | Filing |
|---|---|---|
| 06/30/2026 | 08/10/2026 | 10-Q |
| 03/31/2026 | 05/11/2026 | 10-Q |
| 12/31/2025 | 03/02/2026 | 10-K |
| 09/30/2025 | 11/10/2025 | 10-Q |
| 06/30/2025 | 08/11/2025 | 10-Q |
| 03/31/2025 | 05/12/2025 | 10-Q |
| 12/31/2024 | 03/03/2025 | 10-K |
| 09/30/2024 | 11/12/2024 | 10-Q |
| 06/30/2024 | 08/09/2024 | 10-Q |
| 03/31/2024 | 05/10/2024 | 10-Q |
| 12/31/2023 | 02/29/2024 | 10-K |
| 09/30/2023 | 11/09/2023 | 10-Q |
| 06/30/2023 | 08/09/2023 | 10-Q |
| 03/31/2023 | 05/10/2023 | 10-Q |
| 12/31/2022 | 03/01/2023 | 10-K |
| 09/30/2022 | 11/09/2022 | 10-Q |
| Report Date | Filing Date | Filing |
|---|---|---|
| 06/30/2026 | 08/10/2026 | 10-Q |
| 03/31/2026 | 05/11/2026 | 10-Q |
| 12/31/2025 | 03/02/2026 | 10-K |
| 09/30/2025 | 11/10/2025 | 10-Q |
| 06/30/2025 | 08/11/2025 | 10-Q |
| 03/31/2025 | 05/12/2025 | 10-Q |
| 12/31/2024 | 03/03/2025 | 10-K |
| 09/30/2024 | 11/12/2024 | 10-Q |
| 06/30/2024 | 08/09/2024 | 10-Q |
| 03/31/2024 | 05/10/2024 | 10-Q |
| 12/31/2023 | 02/29/2024 | 10-K |
| 09/30/2023 | 11/09/2023 | 10-Q |
| 06/30/2023 | 08/09/2023 | 10-Q |
| 03/31/2023 | 05/10/2023 | 10-Q |
| 12/31/2022 | 03/01/2023 | 10-K |
| 09/30/2022 | 11/09/2022 | 10-Q |
| 06/30/2022 | 08/09/2022 | 10-Q |
| 03/31/2022 | 05/10/2022 | 10-Q |
| 12/31/2021 | 03/01/2022 | 10-K |
| 09/30/2021 | 11/09/2021 | 10-Q |
| 06/30/2021 | 08/09/2021 | 10-Q |
| 03/31/2021 | 05/10/2021 | 10-Q |
| 12/31/2020 | 03/16/2021 | 10-K |
| 09/30/2020 | 11/09/2020 | 10-Q |
| 06/30/2020 | 08/10/2020 | 10-Q |
| 03/31/2020 | 05/11/2020 | 10-Q |
| 12/31/2019 | 03/16/2020 | 10-K |
| 09/30/2019 | 11/12/2019 | 10-Q |
Recent Forward Guidance
Updated 8/11/2026Latest: Q2 2026 Earnings Reported 8/10/2026
| Forward Guidance | Guidance Change | |||||||
|---|---|---|---|---|---|---|---|---|
| Metric | Source | Low | Mid | High | % Chg | % Delta | Change | Prior |
| 2026 Total Net Revenue | Reported | 2.37 Bil | 2.40 Bil | 0.6% | Raised | Guidance: 2.38 Bil for 2026 | ||
| 2026 Adjusted EBITDA | Reported | 345.00 Mil | 351.50 Mil | 1.4% | Raised | Guidance: 346.50 Mil for 2026 | ||
| 2026 Cash Interest Expense | Reported | 48.00 Mil | 50.50 Mil | |||||
| 2026 Capital Expenditures | Reported | 165.00 Mil | 170.00 Mil | 0 | Affirmed | Guidance: 170.00 Mil for 2026 | ||
| 2026 Free Cash Flow | Reported | 115.00 Mil | 120.00 Mil | 2.6% | Raised | Guidance: 117.00 Mil for 2026 | ||
Prior: Q1 2026 Earnings Reported 5/11/2026
| Forward Guidance | Guidance Change | |||||||
|---|---|---|---|---|---|---|---|---|
| Metric | Source | Low | Mid | High | % Chg | % Delta | Change | Prior |
| 2026 Total Net Revenue | Reported | 2.35 Bil | 2.38 Bil | 2.40 Bil | 1.3% | Raised | Guidance: 2.35 Bil for 2026 | |
| 2026 Adjusted EBITDA | Reported | 340.00 Mil | 346.50 Mil | 353.00 Mil | 1.5% | Raised | Guidance: 341.50 Mil for 2026 | |
| 2026 Capital Expenditures | Reported | 165.00 Mil | 170.00 Mil | 175.00 Mil | ||||
| 2026 Free Cash Flow | Reported | 112.00 Mil | 117.00 Mil | 122.00 Mil | 6.4% | Raised | Guidance: 110.00 Mil for 2026 | |
Q4 2025 Earnings Reported 3/2/2026
| Forward Guidance | Guidance Change | |||||||
|---|---|---|---|---|---|---|---|---|
| Metric | Source | Low | Mid | High | % Chg | % Delta | Change | Prior |
| 2026 Total Net Revenue | Reported | 2.33 Bil | 2.35 Bil | 2.38 Bil | 22.7% | Higher New | Actual: 1.92 Bil for 2025 | |
| 2026 Imaging Center Revenue Growth | Reported | 17.0% | 18.0% | 19.0% | ||||
| 2026 Digital Health Revenue Growth | Reported | 46.0% | 51.0% | 56.0% | ||||
| 2026 Annual Recurring Revenue | Reported | 140.00 Mil | ||||||
| 2026 Adjusted EBITDA | Reported | 335.00 Mil | 341.50 Mil | 348.00 Mil | 22.0% | Higher New | Actual: 280.00 Mil for 2025 | |
| 2026 Free Cash Flow | Reported | 105.00 Mil | 110.00 Mil | 115.00 Mil | 46.7% | Higher New | Actual: 75.00 Mil for 2025 | |
Q3 2025 Earnings Reported 11/10/2025
| Forward Guidance | Guidance Change | |||||||
|---|---|---|---|---|---|---|---|---|
| Metric | Source | Low | Mid | High | % Chg | % Delta | Change | Prior |
| 2025 Total Net Revenue | Reported | 1.90 Bil | 1.92 Bil | 1.93 Bil | 2.1% | Raised | Guidance: 1.88 Bil for 2025 | |
| 2025 Digital Health Total Net Revenue | Reported | 85.00 Mil | 90.00 Mil | 95.00 Mil | 5.9% | Raised | Guidance: 85.00 Mil for 2025 | |
| 2025 Adjusted EBITDA | Reported | 276.00 Mil | 280.00 Mil | 284.00 Mil | 1.8% | Raised | Guidance: 275.00 Mil for 2025 | |
| 2025 Cash Interest Expense | Reported | 31.00 Mil | 33.50 Mil | 36.00 Mil | ||||
| 2025 Capital Expenditures | Reported | 157.00 Mil | 162.00 Mil | 167.00 Mil | 3.2% | Raised | Guidance: 157.00 Mil for 2025 | |
| 2025 Free Cash Flow | Reported | 70.00 Mil | 75.00 Mil | 80.00 Mil | 0.0% | Affirmed | Guidance: 75.00 Mil for 2025 | |
Insider Activity
Updated 6/18/2026| # | Owner | Title | Holding | Action | Filing Date | Price | Shares | Transacted Value | Value of Held Shares | Form |
|---|---|---|---|---|---|---|---|---|---|---|
| 1 | Wesdorp, Cornelis | Pres & CEO, Digital Health | Direct | Sell | 6182026 | 58.11 | 4,750 | 276,022 | 4,013,948 | Form |
| 2 | Forthuber, Stephen M | Pres & CEO-Eastern Operations | Direct | Sell | 6162026 | 58.16 | 44,067 | 2,562,911 | 29,498,402 | Form |
| 3 | Sorensen, Alma Gregory | Chief Strategy Officer | Direct | Sell | 3232026 | 62.20 | 15,000 | 933,014 | 75,196,145 | Form |
| 4 | Sorensen, Alma Gregory | Chief Strategy Officer | Direct | Sell | 3182026 | 62.15 | 15,000 | 932,280 | 76,069,262 | Form |
| 5 | Forthuber, Stephen M | Pres & COO-Eastern Operations | Direct | Sell | 12092025 | 78.33 | 45,088 | 3,531,849 | 41,455,124 | Form |
| # | Owner | Title | Holding | Action | Filing Date | Price | Shares | Transacted Value | Value of Held Shares | Form |
|---|---|---|---|---|---|---|---|---|---|---|
| 1 | Wesdorp, Cornelis | Pres & CEO, Digital Health | Direct | Sell | 6182026 | 58.11 | 4,750 | 276,022 | 4,013,948 | Form |
| 2 | Forthuber, Stephen M | Pres & CEO-Eastern Operations | Direct | Sell | 6162026 | 58.16 | 44,067 | 2,562,911 | 29,498,402 | Form |
| 3 | Sorensen, Alma Gregory | Chief Strategy Officer | Direct | Sell | 3232026 | 62.20 | 15,000 | 933,014 | 75,196,145 | Form |
| 4 | Sorensen, Alma Gregory | Chief Strategy Officer | Direct | Sell | 3182026 | 62.15 | 15,000 | 932,280 | 76,069,262 | Form |
| 5 | Forthuber, Stephen M | Pres & COO-Eastern Operations | Direct | Sell | 12092025 | 78.33 | 45,088 | 3,531,849 | 41,455,124 | Form |
| 6 | Patel, Mital | EVP of Fin Planning, CAO | Direct | Sell | 11192025 | 80.05 | 15,080 | 1,207,154 | 14,420,047 | Form |
| 7 | Patel, Mital | EVP of Fin Planning, CAO | Direct | Sell | 11192025 | 80.00 | 9,920 | 793,600 | 15,617,440 | Form |
| 8 | Patel, Mital | EVP of Fin Planning, CAO | Direct | Sell | 11192025 | 76.06 | 25,000 | 1,901,500 | 15,602,796 | Form |
| 9 | Stolper, Mark | EVP, Chief Financial Officer | Direct | Sell | 9182025 | 73.89 | 35,000 | 2,586,150 | 5,025,407 | Form |
| 10 | Katz, David Jeffrey | EVP and Chief Legal Officer | Direct | Sell | 9172025 | 74.44 | 14,000 | 1,042,160 | 5,075,394 | Form |
| 11 | Wesdorp, Cornelis | Pres & CEO, Digital Health | Direct | Sell | 9122025 | 72.13 | 500 | 36,065 | 3,858,594 | Form |
| 12 | Hames, Norman R | Pres and COO-West Operations | Direct | Sell | 9122025 | 72.74 | 10,000 | 727,400 | 17,398,171 | Form |
| 13 | Wesdorp, Cornelis | Pres & CEO, Digital Health | Direct | Sell | 9102025 | 71.99 | 500 | 35,995 | 3,887,100 | Form |
| 14 | Hames, Norman R | Pres and COO-West Operations | Spouse | Sell | 8292025 | 71.10 | 5,000 | 355,500 | 1,414,108 | Form |
| 15 | Wesdorp, Cornelis | Pres & CEO, Digital Health | Direct | Sell | 8212025 | 66.98 | 1,500 | 100,470 | 3,650,075 | Form |
| 16 | Jayanathan, Ranjan | Chief Information Officer | Direct | Sell | 8212025 | 67.50 | 65,598 | 4,427,865 | 9,328,365 | Form |
| 17 | Katz, David Jeffrey | EVP and Chief Legal Officer | Direct | Sell | 8152025 | 68.31 | 17,000 | 1,161,270 | 5,927,532 | Form |
| 18 | Murdock, Michael N | EVP, Mergers and Acquisitions | Direct | Sell | 6062025 | 58.05 | 11,132 | 646,213 | 2,501,026 | Form |
Investor Activity (13F)
Updated Sep 22, 2026Active managers (13F portfolio over $250M, at least 3 holdings) with a position over $5M that is either over 10% of their portfolio or held in a concentrated book of 50 or fewer total positions. Index/ETF, sovereign, bank, community-bank and charitable/donor-advised filers are excluded.
| Active Manager |
|---|
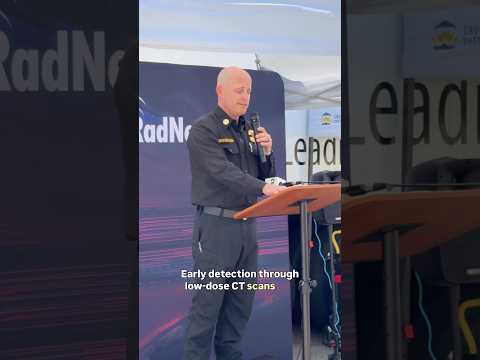
RadNet — Investor Video Playlist





Industry Resources
| Health Care Resources |
| U.S. National Library of Medicine |
| ClinicalTrials.gov |
| Modern Healthcare |
| Healthcare Dive |
| Fierce Healthcare |
| Health Affairs |
| Health Data Management |
| FDA Tracker |
| Health Care Services Resources |
| HealthLeaders Media |
| Medical Economics |
| Physicians Practice |
External Quote Links
| Y Finance | Barrons |
| TradingView | Morningstar |
| SeekingAlpha | ValueLine |
| Motley Fool | Robinhood |
| CNBC | Etrade |
| MarketWatch | Unusual Whales |
| YCharts | Perplexity Finance |
| FinViz |
Prefer one of these to Trefis? Tell us why.