
LOW Paid Holders $47 Bil While The Stock Went Nowhere
The home improvement giant showered its owners with cash, yet the stock barely budged. Here’s what shareholders actually got, and what has to happen next for the trade to make sense.
Over the last five years, home improvement retailer Lowe’s Companies (LOW) handed shareholders $47 Bil in cash, an amount equal to 41% of its entire current market value. While the stock itself has been weak, returning -6% over the past twelve months as the S&P 500 returned +21%, the sheer scale of the payout machine demands a closer look. This raises a sharp question for owners: the company paid out a fortune while the stock lagged the market; was holding worth it, and is it now?
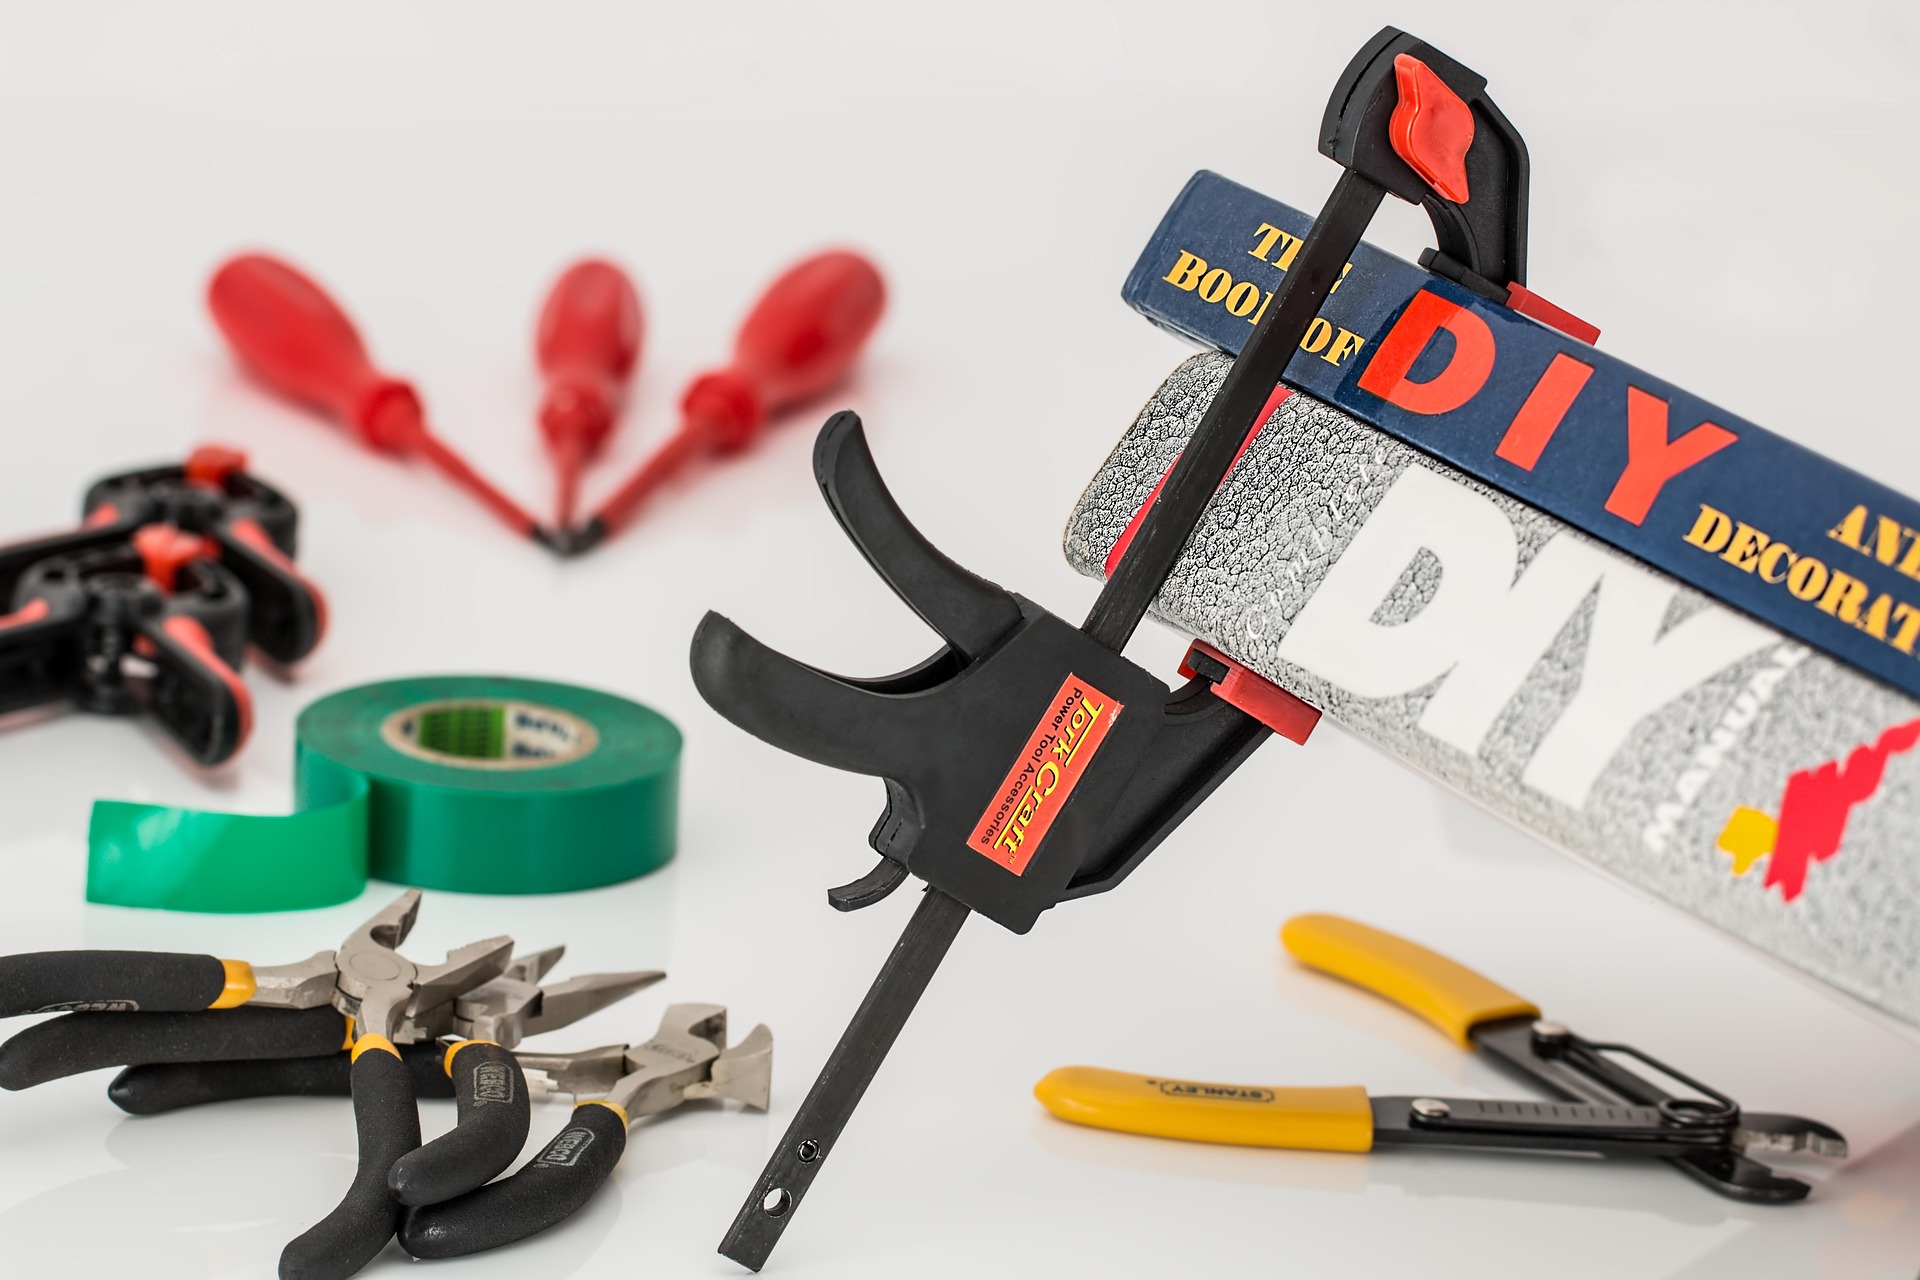
Image by Steve Buissinne from Pixabay
How does a home improvement retailer generate that much spare cash?
The engine is the core business, which generated $88.44 billion in revenue over the last twelve months. From that, Lowe’s returned its large cash pile to owners primarily through stock buybacks, with $35 Bil spent on share repurchases and another $12 Bil paid out as dividends. This isn’t a business in decline; it delivered positive comparable sales for the fourth consecutive quarter.
Management credits the performance to its “Total Home strategy,” which focuses on building out areas of the business that can perform even in a tough housing market. The company cites “continued strength in Pro, Appliances, Online and Home Services” as key drivers. Its online channel has been a particular bright spot, where the company delivered sales growth of 15.5% in its most recent quarter.
If the checks were so big, why did the stock return just +16.7%?
Here is the paradox for shareholders. While the cash returns were extraordinary, the stock’s price performance was not. Over the last five years, LOW stock returned +16.7% in price terms. An investor holding a simple S&P 500 index fund would have seen a return of +84% over the same period. The payouts did not come close to bridging that gap.
The honest catch is that cash returned to shareholders is cash not reinvested for growth, and Lowe’s has been navigating a difficult consumer backdrop. Management is direct about the pressure on its core do-it-yourself customer, stating that “DIY demand remains under pressure” in a “challenging housing environment.” This weakness is concentrated in big-ticket discretionary projects, which make up about one-third of the business. The company’s 3-year average annual revenue growth is -2.4%, reflecting this strain. This pressure on large projects isn’t unique to Lowe’s; it’s a key concern across the home improvement sector. A recent analysis, for instance, explored the real risk inside Home Depot stock.
What is the one number that shows if the ‘Total Home’ strategy is working?
For the capital-return story to be rational from here, the underlying business must prove it can stabilize and grow, even modestly. Management believes its strategy can deliver “continued growth regardless of market conditions.” The company recently affirmed its full year 2026 outlook, setting a clear benchmark for investors. For those who prefer to own the theme of consumer spending more broadly, a consumer discretionary ETF like XLY offers diversified exposure.
The clearest test is whether the company can deliver on its full-year guidance for comparable sales, which it expects in a range of “flat to up 2%.” Hitting the midpoint of that range would signal that its strategic initiatives are successfully offsetting the drag from cautious consumers. It is the single most important measure of whether the cash machine can keep running.
Curious which companies write the biggest checks to their owners? Our Buybacks & Dividends ranking ranks every name we track by total cash returned.
One Generous Company Is Income. Thirty Is A Plan
A record like this shows what disciplined capital return looks like. It is still one company’s discipline, one board’s choice, and one industry’s cash cycle, and any of the three can change.
The Trefis High Quality (HQ) Portfolio assembles about 30 businesses with exactly the traits that fund durable payouts, consistent cash generation, strong margins, sound balance sheets, and re-balances them by rules. It has a track record of outpacing a benchmark that combines the three major indices – the S&P 500, S&P Mid-cap, and Russell 2000. Take the income lesson; apply it across a portfolio.