Procter & Gamble Stock vs. Colgate-Palmolive Stock
Procter & Gamble (NYSE: PG) stock has recently drawn attention after Jim Cramer made a bullish case for the stock. Both PG and its peer Colgate-Palmolive (CL), are down roughly 12% year-to-date, underperforming the broader S&P 500, which is up 16%.
If you had to choose between the two, we believe PG stands out as the better pick. The company demonstrates stronger revenue growth over key periods, superior profitability, and a relatively more attractive valuation compared to CL.
Specifically, PG’s latest quarterly revenue grew 3.0% versus CL’s 1.0%. On a trailing twelve-month basis, PG’s revenue growth was 1.2%, ahead of CL’s 0.1%. Profitability also favors PG, with a last twelve-month operating margin of 24.1% and a three-year average margin of 23.6%, both higher than CL’s corresponding figures.
These differences become even clearer when you look at the financials side by side. Before we delve into the details, if you seek an upside with less volatility than holding an individual stock, consider the High Quality Portfolio. It has comfortably outperformed its benchmark—a combination of the S&P 500, Russell, and S&P MidCap indexes—and has achieved returns exceeding 105% since its inception. Why is that? As a group, HQ Portfolio stocks provided better returns with less risk versus the benchmark index; less of a roller-coaster ride, as evident in HQ Portfolio performance metrics.

Photo by Erik Binggeser on Unsplash
The table highlights how PG’s fundamentals stack up against those of CL on growth, margins, momentum, and valuation multiples.
Valuation & Performance Overview

Valuation & Performance Overview
See more revenue details:
See more margin details:
See detailed fundamentals on Buy or Sell CL Stock and Buy or Sell PG Stock. Below we compare market return and related metrics across years.
Historical Market Performance
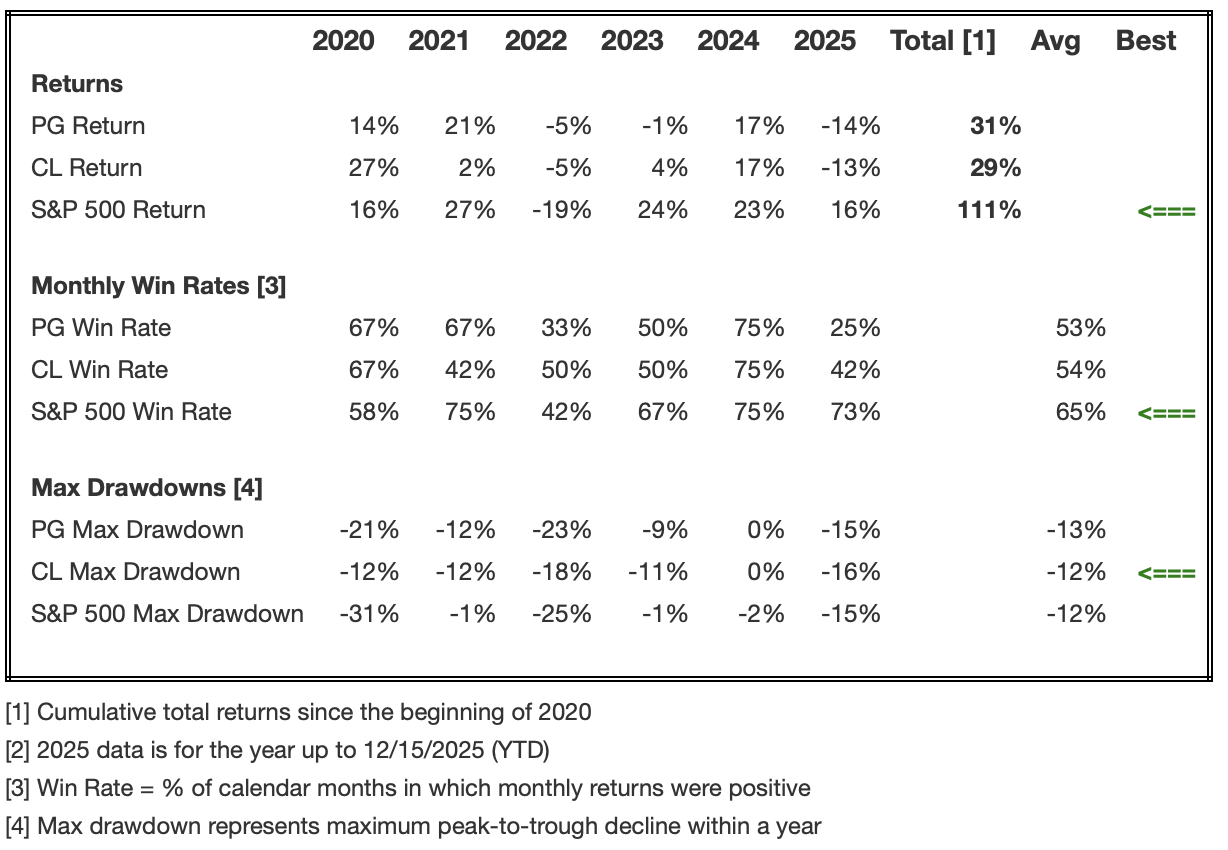
Historical Market Performance
Still not sure about PG or CL? Consider a portfolio approach.
Move Beyond Single Stocks With A Multi-Asset Portfolio
Stocks can jump or crash, but different assets move on different cycles. A multi-asset portfolio helps you stay invested while cushioning swings in equities.
The asset allocation framework of Trefis’ Boston-based wealth management partner yielded positive returns during the 2008-09 period when the S&P lost more than 40%. Our partner’s strategy now includes the Trefis Reinforced Value (RV) Portfolio, which has outperformed its all-cap stocks benchmark (combination of the S&P 500, S&P mid-cap, and Russell 2000 benchmark indices) to produce strong returns for investors. Why is that? The quarterly rebalanced mix of large-, mid-, and small-cap RV Portfolio stocks provided a responsive way to make the most of upbeat market conditions while limiting losses when markets head south, as detailed in RV Portfolio performance metrics.
Invest with Trefis Market-Beating Portfolios
See all Trefis Price Estimates